
ADMET Predictor: Import 21 structure to a new project
This RMarkdown file automates the workflow of importing new chemical structures (from .smi, .mol, or .sdf files) through ADMET Predictor module API functions into a new GastroPlus project. The script utilizes the gastroPlusAPI package to communicate with the GastroPlus X 10.2 service.
This workflow is particularly valuable for:
High-throughput screening follow-ups and evaluations: Quickly importing and evaluating hits from screening campaigns.
Lead optimization: Assessing the ADMET profiles of new chemical entities as they are synthesized.
Virtual screening: Integrating predicted structures from virtual screening efforts for further in silico analysis.
Batch processing: Efficiently handling large datasets of compounds without manual intervention, saving significant time and reducing potential for human error.
As a first step, in this workflow please populated the required assets for the ADMET Predictor® module. This has been already setup in the current project example.
To customize your study with this script for a different simulation / project / variables, please make changes to the “Set Input Information” section.
Configure required packages
Load other necessary necessary packages(tidyverse) required to execute the data manipulation in the script
Load gastroPlusAPI package
Load gastroPlusRModuLens for easy visualization workflow in conjunction the the project setup.
library(tidyverse)
library(kableExtra)
library(DT)
library(gastroPlusAPI)
library(gastroPlusRModuLens)
Set working directory
Set working directory as the current source editor context
if (rstudioapi::isAvailable()){
  current_working_directory <- dirname(rstudioapi::getSourceEditorContext()$path)
  setwd(current_working_directory)
}
Start GPX Service
Establishes a connection to the GastroPlus service, which allows R to communicate with GastroPlus through its API
gpx_service <- start_service(verbose=FALSE)✔ Configured the GastroPlus Servicegpx_service$is_alive()[1] TRUESet Input Information
Make modification to the variables in this chunk to customize your import workflow.
project_path: Location of the project for the import
structure_file: Location of the smi/mol/sdf file of the import compounds
current_compounds: Variable to collect the pre-existing compounds in the project before the ADMET Predictor import
project_path = "../../ProjectFiles/ADMET Predictor.gpproject"
structure_file = "../../ProjectFiles/ap_import_files/21-Comps-w-ExperData-3D.sdf"
open_project(project_path)
current_compounds <- unlist(get_project_assets(AssetType$Compound)$assets)
Load and Import Structure
Load the structure, change the configuration of the import (eg., dose schedule, physiology schedule), update the configurations and import the structure.
import_configuration: List to collect the retrieved import configuration
load_structure(structure_file)

#Get import configuration
import_configuration <- get_admet_predictor_import_configuration()

#View the contents of the import configuration
#str(import_configuration$toJSON())

#Make changes to the configuration
import_configuration$dose_regimen_name <- 'PO capsule 100mg'
import_configuration$physiology_schedule_name <-'Human 30y 85.53kg schedule'
set_admet_predictor_import_configuration(import_configuration)


#Now import the structure with the updated configuration
import_structure()
Process Run Output
Get and execute the run with the ADMET predictor simulations after the import and collect the series of the imported compounds to plot them.
run_name: Name of the ADMET Predictor run obtained from get_runs()
# get the runs of the project after the import
get_runs()# A tibble: 1 × 1
run_name
<chr>
1 Run # set the run_name for the ADMET predictor import run to a variable
run_name= "Run"
# get the simulations in the run from the import. name of the run created with the import: "Run"
get_simulations_in_run("Run")[[1]]
[1] "Simulation for Amiloride"
[[2]]
[1] "Simulation for Amoxicillin"
[[3]]
[1] "Simulation for Desipramine"
[[4]]
[1] "Simulation for Antipyrine"
[[5]]
[1] "Simulation for Atenolol"
[[6]]
[1] "Simulation for Carbamazepine"
[[7]]
[1] "Simulation for Enalaprilat"
[[8]]
[1] "Simulation for Furosemide"
[[9]]
[1] "Simulation for Fluvastatin"
[[10]]
[1] "Simulation for Hydrochlorothiazide"
[[11]]
[1] "Simulation for Methyldopa"
[[12]]
[1] "Simulation for Ketoprofen"
[[13]]
[1] "Simulation for Levodopa"
[[14]]
[1] "Simulation for Lisinopril"
[[15]]
[1] "Simulation for Mannitol"
[[16]]
[1] "Simulation for Metoprolol"
[[17]]
[1] "Simulation for Naproxen"
[[18]]
[1] "Simulation for Verapamil"
[[19]]
[1] "Simulation for Propranolol"
[[20]]
[1] "Simulation for Ranitidine"
[[21]]
[1] "Simulation for Terbutaline"# execute the run with the ADMET predictor import simulations
execute_run(run_name)
all_compounds <- unlist(get_project_assets(AssetType$Compound)$assets)
admet_import_compounds <- setdiff(all_compounds,current_compounds)
# gastroPlusRModuLens function: build the series for the ADMET Predictor import
series_descriptors <- build_series_descriptors(
compound = admet_import_compounds,
c(CompartmentType[["SystemicCirculation"]], StateType[["ConcentrationPlasma"]])
)
series_descriptors [1] "Levodopa - Systemic Circulation - Concentration Plasma"
[2] "Carbamazepine - Systemic Circulation - Concentration Plasma"
[3] "Mannitol - Systemic Circulation - Concentration Plasma"
[4] "Atenolol - Systemic Circulation - Concentration Plasma"
[5] "Fluvastatin - Systemic Circulation - Concentration Plasma"
[6] "Hydrochlorothiazide - Systemic Circulation - Concentration Plasma"
[7] "Methyldopa - Systemic Circulation - Concentration Plasma"
[8] "Antipyrine - Systemic Circulation - Concentration Plasma"
[9] "Propranolol - Systemic Circulation - Concentration Plasma"
[10] "Lisinopril - Systemic Circulation - Concentration Plasma"
[11] "Ketoprofen - Systemic Circulation - Concentration Plasma"
[12] "Furosemide - Systemic Circulation - Concentration Plasma"
[13] "Enalaprilat - Systemic Circulation - Concentration Plasma"
[14] "Ranitidine - Systemic Circulation - Concentration Plasma"
[15] "Amiloride - Systemic Circulation - Concentration Plasma"
[16] "Desipramine - Systemic Circulation - Concentration Plasma"
[17] "Amoxicillin - Systemic Circulation - Concentration Plasma"
[18] "Metoprolol - Systemic Circulation - Concentration Plasma"
[19] "Naproxen - Systemic Circulation - Concentration Plasma"
[20] "Verapamil - Systemic Circulation - Concentration Plasma"
[21] "Terbutaline - Systemic Circulation - Concentration Plasma" # gastroPlusRModuLens function: get the series in the ADMET Predictor run
series_data_APimport <- get_series_data_run(run_name=run_name,series_descriptor = series_descriptors)
series_data_APimport <- series_data_APimport %>% mutate(compound=str_extract(series_name, "^[^-]+") %>% trimws())Plot Results
User can set the default theme provided in the package or implement their own theme. They can also write their own ggplot instance to have customized plot for internal needs.
# Getting the plotting environment ready
# set default ggplot2 theme
theme_set(
  theme_gastroPlus_grid()
)
set_default_ggplot_options()

#plot the simulations faceted
plot_series_data(series_data_APimport,
                 x_label = "Time (h)",
                 y_label = "Concentration (ng/mL)",
) +
  scale_y_continuous()+
  facet_wrap(~compound,scales = "free_y")+
labs(color=NULL)Scale for y is already present.
Adding another scale for y, which will replace the existing scale.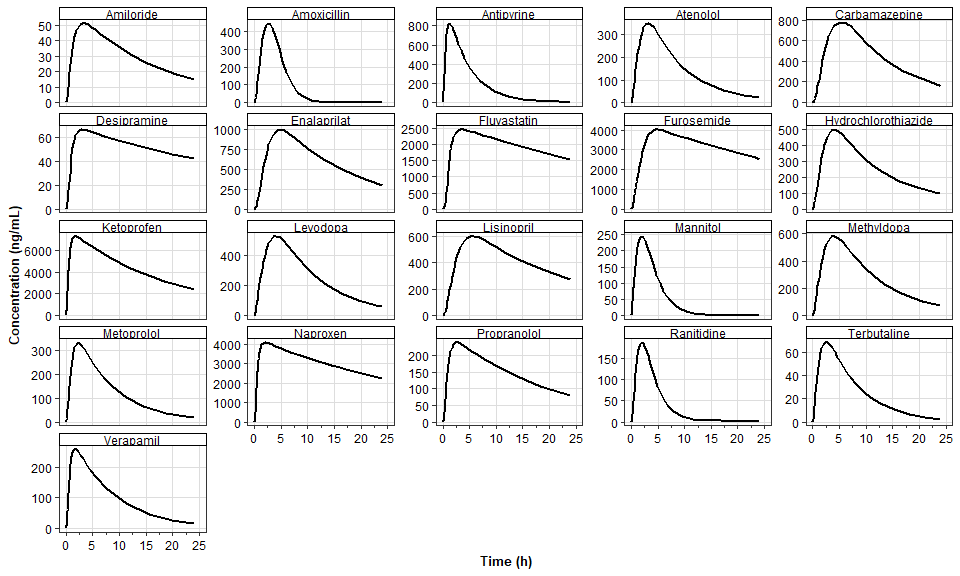
#Plot the simulations in one plot
plot_series_data(series_data_APimport,
                 color= compound,
                 x_label = "Time (h)",
                 y_label = "Concentration (ng/mL)",
) 
Plot and Rank Summary Results
The Summary Table allows you to compare any output parameter e.g. Fa for all compounds in this project. You can sort the compounds from highest to lowest for any parameter, e.g. predicted Fa, bioavailability, AUC, etc. and also plot them effectively.
topn: the variable that takes the number of top ranking and bottom ranking molecules
#get all the summary outputs
summary_output_APimport <- get_summary_output_tidy(run_name) %>%
  filter(!name %in% c("total_dose"))

ggplot(summary_output_APimport, aes(x = compound, y = value)) +
    geom_col(position = "dodge") + # geom_col for bar charts with a pre-calculated y-value
    facet_wrap(~ label, scales = "free_y", ncol = 3) +
    labs(
        title = "ADMET PK parameters by Compound, Faceted by key Summary output PK parameters",
        x = "Compound",
        y = "Value",
        fill = "Summary Parameter Name"
    )+theme(
    axis.text.x = element_text(angle = 45, hjust = 1),
    legend.position = "right"
)#change this variable to get the top ranking molecules
topn <- 3
#get the table of the ranking
summary_output_ranking <- summary_output_APimport %>%
arrange(name,value) %>%
group_by(name) %>%
mutate(
rank = dense_rank(value),
label = str_squish(label)
) %>%
filter(rank %in% c(1:topn,(n()-(topn-1)):(n()))) %>%
ungroup() %>%
select(label, compound, value, rank)
# View(summary_output_ranking)
kable(summary_output_ranking, format = "simple",
caption = "Compound Rankings by ADMET Parameters",
digits = 2)label | compound | value | rank |
|---|---|---|---|
Absorbed | Mannitol | 0.20 | 1 |
Absorbed | Terbutaline | 0.28 | 2 |
Absorbed | Amiloride | 0.30 | 3 |
Absorbed | Antipyrine | 1.00 | 19 |
Absorbed | Desipramine | 1.00 | 20 |
Absorbed | Verapamil | 1.00 | 21 |
Bioavailable | Mannitol | 0.17 | 1 |
Bioavailable | Terbutaline | 0.19 | 2 |
Bioavailable | Amiloride | 0.24 | 3 |
Bioavailable | Fluvastatin | 0.98 | 19 |
Bioavailable | Ketoprofen | 0.99 | 20 |
Bioavailable | Naproxen | 0.99 | 21 |
Clearance (L/h) | Ketoprofen | 0.92 | 1 |
Clearance (L/h) | Furosemide | 1.32 | 2 |
Clearance (L/h) | Naproxen | 1.36 | 3 |
Clearance (L/h) | Ranitidine | 112.45 | 19 |
Clearance (L/h) | Amiloride | 134.15 | 20 |
Clearance (L/h) | Terbutaline | 163.51 | 21 |
Cmax (ng/mL) | Amiloride | 51.47 | 1 |
Cmax (ng/mL) | Desipramine | 66.61 | 2 |
Cmax (ng/mL) | Terbutaline | 68.81 | 3 |
Cmax (ng/mL) | Furosemide | 4025.57 | 19 |
Cmax (ng/mL) | Naproxen | 4082.36 | 20 |
Cmax (ng/mL) | Ketoprofen | 7330.47 | 21 |
Infinite Exposure ((ng/mL)*h) | Terbutaline | 611.59 | 1 |
Infinite Exposure ((ng/mL)*h) | Ranitidine | 889.32 | 2 |
Infinite Exposure ((ng/mL)*h) | Amiloride | 976.28 | 3 |
Infinite Exposure ((ng/mL)*h) | Naproxen | 153327.29 | 19 |
Infinite Exposure ((ng/mL)*h) | Ketoprofen | 153990.87 | 20 |
Infinite Exposure ((ng/mL)*h) | Furosemide | 162956.47 | 21 |
Liver Cmax (ng/mL) | Terbutaline | 143.94 | 1 |
Liver Cmax (ng/mL) | Amiloride | 145.54 | 2 |
Liver Cmax (ng/mL) | Mannitol | 290.21 | 3 |
Liver Cmax (ng/mL) | Furosemide | 4064.73 | 19 |
Liver Cmax (ng/mL) | Naproxen | 4228.14 | 20 |
Liver Cmax (ng/mL) | Ketoprofen | 7452.15 | 21 |
Portal Vein | Mannitol | 0.20 | 1 |
Portal Vein | Terbutaline | 0.28 | 2 |
Portal Vein | Amiloride | 0.30 | 3 |
Portal Vein | Antipyrine | 1.00 | 19 |
Portal Vein | Desipramine | 1.00 | 20 |
Portal Vein | Verapamil | 1.00 | 21 |
Tmax (h) | Antipyrine | 1.28 | 1 |
Tmax (h) | Verapamil | 1.59 | 2 |
Tmax (h) | Ketoprofen | 1.87 | 3 |
Tmax (h) | Furosemide | 5.16 | 19 |
Tmax (h) | Carbamazepine | 5.55 | 20 |
Tmax (h) | Lisinopril | 5.86 | 21 |
Total Exposure ((ng/mL)*h) | Terbutaline | 595.56 | 1 |
Total Exposure ((ng/mL)*h) | Amiloride | 745.45 | 2 |
Total Exposure ((ng/mL)*h) | Ranitidine | 876.14 | 3 |
Total Exposure ((ng/mL)*h) | Naproxen | 73746.16 | 19 |
Total Exposure ((ng/mL)*h) | Furosemide | 75908.34 | 20 |
Total Exposure ((ng/mL)*h) | Ketoprofen | 108137.67 | 21 |
Compound Rankings by ADMET Parameters
Kill GPX Service
kill the GPX service after the script is executed to free system resources.
gpx_service$kill()[1] TRUE