
Import Observed Data Into A GastroPlus Project
This Jupyter notebook reads exposure data from an Excel file and imports them as observed data into a GastroPlus 10.2 project. After importing the data, the data is retrieved from the project and plotted.
Load required libraries
import gastroplus_api as gp
import pandas as pd
from pprint import pprint
import os
Start the GastroPlus service
try:
    gastroplus_service = gp.start_service(verbose=False)
except Exception as e:
    print(f"Error starting GastroPlus service: {e}")
GastroPlus Service configured. Listening on port: 8700If not using start_service() to start the GastroPlus service, adjust the port variable below to match the port of the GastroPlus Service instance
The port set here must match the listening port of the running GastroPlus Service.
#port=8700
port = gastroplus_service.port
host = f"http://localhost:{port}"
client = gp.ApiClient(gp.Configuration(host = host))
gastroplus = gp.GpxApiWrapper(client)
Setup Input Information
Set the following variables as needed in the following cell
SCRIPT_PATH: The location of this script (if you wish to specify other paths relative to this directory)
PROJECT_DIRECTORY: The directory where the project is located
PROJECT_NAME: The name of the project
EXCEL_FILE: The name of the Excel file to import
INDEPENDENT_COLUMN_NAME: The column heading in the Excel file that corresponds to the independent variable
DEPENDENT_COLUMN_NAME: The column heading in the Excel file that corresponds to the dependent variable
INDEPENDENT_UNIT: The units of the independent variable
DEPENDENT_UNIT: The units of the dependent variable
NEW_GROUP_NAME: The group name to be assigned to the imported data
NEW_SERIES_NAME: The series name to be assigned to the imported data
SAVE_PROJECT: Whether to save the project after importing the data
SCRIPT_PATH = os.getcwd()
PROJECT_DIRECTORY = os.path.normpath(os.path.join(SCRIPT_PATH, '../../ProjectFiles'))
PROJECT_NAME = "Metoprolol.gpproject"
PROJECT_FILE_NAME = os.path.join(PROJECT_DIRECTORY, PROJECT_NAME)
EXCEL_FILE = 'External_data.xlsx'
EXCEL_FILE_NAME = os.path.join(SCRIPT_PATH, EXCEL_FILE)
# These are the names of the columns in the Excel file
INDEPENDENT_COLUMN_NAME = "Time (h)"
DEPENDENT_COLUMN_NAME = "Conc. (µg/mL)"
# These are the units of the data columns
INDEPENDENT_UNIT = "hour"
DEPENDENT_UNIT = "microgram/milliliter"
NEW_GROUP_NAME = "IVP 500mg Pentikainen"
NEW_SERIES_NAME = "Plasma"
SAVE_PROJECT = False
Open Project and Read Existing Observed Data
Open the project and get the list of observed data that the project initially contains
gastroplus.open_project(PROJECT_FILE_NAME)
observed_data_inventory = gastroplus.experimental_data_inventory()
pd.json_normalize(observed_data_inventory.to_dict(), record_path=['observed_series_keys'])
group_type | group_name | series_type | series_name | |
|---|---|---|---|---|
0 | InVitroDissolutionRelease | Fast CR tablet | TimeRealSeries | Fast CR tablet |
1 | InVitroDissolutionRelease | Slow CR tablet | TimeRealSeries | Slow CR tablet |
2 | InVitroDissolutionRelease | Moderate CR tablet | TimeRealSeries | Moderate CR tablet |
3 | InVitroDissolutionRelease | New Form CR tablet | TimeRealSeries | New Form CR tablet |
4 | ExposureData | Fast CR tablet 100mg | UncertainConcentrationSeries | Fast CR tablet 100mg |
5 | ExposureData | Moderate CR tablet 100mg | UncertainConcentrationSeries | Moderate CR tablet 100mg |
6 | ExposureData | Slow CR tablet 100mg | UncertainConcentrationSeries | Slow CR tablet 100mg |
Load and process data from an Excel file
Load data from the Excel file and rename column headings to prepare for adding to the project
external_data = pd.read_excel(EXCEL_FILE_NAME)

# prepare data for import by renaming the columns
observed_data =  external_data.rename(columns={INDEPENDENT_COLUMN_NAME : "independent", DEPENDENT_COLUMN_NAME : "dependent"})
Import the data into the project
series_key = gp.SeriesKey(group_type = gp.ObservedDataGroupType.ExposureData,
                                          group_name = NEW_GROUP_NAME,
                                          series_type = gp.ObservedDataSeriesType.UncertainConcentrationSeries,
                                          series_name = NEW_SERIES_NAME)

# Create list of ObservedSeriesPoints objects from the observed_data Dataframe
series = [gp.ObservedSeriesPointsInner(independent = row.independent, dependent = row.dependent) for row in observed_data.itertuples()]

# Define the experimental setup for the observed data
experimental_setup = gp.ExposureSeriesMetadataExposureExperimentalSetup(dose = gp.ScalarValue(value = 300, unit = "milligram"),
                                                        body_mass = gp.ScalarValue(value = 60.3, unit = "kilogram"),
                                                        infusion_time= gp.ScalarValue(value = 0, unit = "hour"))

datakey = gp.DataKey(module = "SystemicCirculation",
                  compartment = "VenousReturn",
                  state = "ConcentrationPlasma")

# combine the experimental setup and data key into a ExposureSeriesMetadata object
exposure_series_metadata = gp.ExposureSeriesMetadata(exposure_experimental_setup = experimental_setup,
                                                     data_key = datakey)

set_series_data_request = gp.SetSeriesDataRequest(dependent_unit = DEPENDENT_UNIT,
                                                  independent_unit = INDEPENDENT_UNIT,
                                                  exposure_series_metadata = exposure_series_metadata,
                                                  series = series)

# import the observed data into the project
gastroplus.set_series_data(series_key.group_name, series_key.group_type, series_key.series_name, series_key.series_type, set_series_data_request)
Check the imported data
Get the list of observed data that the project to see that it includes the newly imported data
updated_observed_data_inventory = gastroplus.experimental_data_inventory()
pd.json_normalize(updated_observed_data_inventory.to_dict(), record_path=['observed_series_keys'])
group_type | group_name | series_type | series_name | |
|---|---|---|---|---|
0 | InVitroDissolutionRelease | Fast CR tablet | TimeRealSeries | Fast CR tablet |
1 | InVitroDissolutionRelease | Slow CR tablet | TimeRealSeries | Slow CR tablet |
2 | InVitroDissolutionRelease | Moderate CR tablet | TimeRealSeries | Moderate CR tablet |
3 | InVitroDissolutionRelease | New Form CR tablet | TimeRealSeries | New Form CR tablet |
4 | ExposureData | IVP 500mg Pentikainen | UncertainConcentrationSeries | Plasma |
5 | ExposureData | Fast CR tablet 100mg | UncertainConcentrationSeries | Fast CR tablet 100mg |
6 | ExposureData | Moderate CR tablet 100mg | UncertainConcentrationSeries | Moderate CR tablet 100mg |
7 | ExposureData | Slow CR tablet 100mg | UncertainConcentrationSeries | Slow CR tablet 100mg |
Retrieve the data that was just imported
series_data_information = gastroplus.get_series_data(series_key.group_name,
                                                series_key.group_type,
                                                series_key.series_name,
                                                series_key.series_type).series_data
pprint(series_data_information.to_dict()){'series_group_name': 'IVP 500mg Pentikainen',
'series_map': [{'series_information': {'dependent_unit': 'ng/mL',
'distribution_type': 'Unknown',
'exposure_series_metadata': {'data_key': {'compartment': 'VenousReturn',
'module': 'SystemicCirculation',
'section': '',
'state': 'ConcentrationPlasma'},
'exposure_experimental_setup': {'body_mass': {'unit': 'kg',
'value': 60.3},
'dose': {'unit': 'mg',
'value': 300.0},
'infusion_time': {'unit': 'h',
'value': 0.0}}},
'independent_unit': 'h',
'series': [{'dependent': 15269.999999999998,
'independent': 0.04,
'uncertainty_percentage': 0.0},
{'dependent': 12429.999999999998,
'independent': 0.17,
'uncertainty_percentage': 0.0},
{'dependent': 9970.0,
'independent': 0.32,
'uncertainty_percentage': 0.0},
{'dependent': 7679.999999999999,
'independent': 0.44,
'uncertainty_percentage': 0.0},
{'dependent': 5150.0,
'independent': 0.72,
'uncertainty_percentage': 0.0},
{'dependent': 3599.9999999999995,
'independent': 0.99,
'uncertainty_percentage': 0.0},
{'dependent': 2450.0,
'independent': 1.49,
'uncertainty_percentage': 0.0},
{'dependent': 1669.9999999999998,
'independent': 1.98,
'uncertainty_percentage': 0.0},
{'dependent': 919.9999999999999,
'independent': 2.97,
'uncertainty_percentage': 0.0},
{'dependent': 579.9999999999999,
'independent': 4.02,
'uncertainty_percentage': 0.0},
{'dependent': 409.99999999999994,
'independent': 5.01,
'uncertainty_percentage': 0.0},
{'dependent': 280.0,
'independent': 5.99,
'uncertainty_percentage': 0.0},
{'dependent': 189.99999999999997,
'independent': 6.98,
'uncertainty_percentage': 0.0},
{'dependent': 119.99999999999999,
'independent': 8.0,
'uncertainty_percentage': 0.0},
{'dependent': 79.99999999999999,
'independent': 8.99,
'uncertainty_percentage': 0.0},
{'dependent': 59.99999999999999,
'independent': 10.01,
'uncertainty_percentage': 0.0}],
'series_name': 'Plasma',
'series_type': 'UncertainConcentrationSeries',
'statistic_type': 'Unknown',
'uncertainty_type': 'ArithmeticCoeffictionOfVariation',
'use_in_distribution': True},
'series_name': 'Plasma'}]}Extract the data that will be used to plot the observed data
df = pd.json_normalize(
    series_data_information.to_dict(),
    record_path=["series_map", "series_information", "series"],
    meta=[
        "series_group_name",
        ["series_map", "series_name"],
        ["series_map", "series_information", "dependent_unit"],
        ["series_map", "series_information", "independent_unit"],
    ],
)
df
independent | dependent | uncertainty_percentage | series_group_name | series_map.series_name | series_map.series_information.dependent_unit | series_map.series_information.independent_unit | |
|---|---|---|---|---|---|---|---|
0 | 0.04 | 15270.0 | 0.0 | IVP 500mg Pentikainen | Plasma | ng/mL | h |
1 | 0.17 | 12430.0 | 0.0 | IVP 500mg Pentikainen | Plasma | ng/mL | h |
2 | 0.32 | 9970.0 | 0.0 | IVP 500mg Pentikainen | Plasma | ng/mL | h |
3 | 0.44 | 7680.0 | 0.0 | IVP 500mg Pentikainen | Plasma | ng/mL | h |
4 | 0.72 | 5150.0 | 0.0 | IVP 500mg Pentikainen | Plasma | ng/mL | h |
5 | 0.99 | 3600.0 | 0.0 | IVP 500mg Pentikainen | Plasma | ng/mL | h |
6 | 1.49 | 2450.0 | 0.0 | IVP 500mg Pentikainen | Plasma | ng/mL | h |
7 | 1.98 | 1670.0 | 0.0 | IVP 500mg Pentikainen | Plasma | ng/mL | h |
8 | 2.97 | 920.0 | 0.0 | IVP 500mg Pentikainen | Plasma | ng/mL | h |
9 | 4.02 | 580.0 | 0.0 | IVP 500mg Pentikainen | Plasma | ng/mL | h |
10 | 5.01 | 410.0 | 0.0 | IVP 500mg Pentikainen | Plasma | ng/mL | h |
11 | 5.99 | 280.0 | 0.0 | IVP 500mg Pentikainen | Plasma | ng/mL | h |
12 | 6.98 | 190.0 | 0.0 | IVP 500mg Pentikainen | Plasma | ng/mL | h |
13 | 8.00 | 120.0 | 0.0 | IVP 500mg Pentikainen | Plasma | ng/mL | h |
14 | 8.99 | 80.0 | 0.0 | IVP 500mg Pentikainen | Plasma | ng/mL | h |
15 | 10.01 | 60.0 | 0.0 | IVP 500mg Pentikainen | Plasma | ng/mL | h |
Plot the observed data
from plotnine import ggplot, aes, geom_point, labs, theme_classic

plot = (
      ggplot(df, aes(x="independent", y="dependent"))
      + geom_point(color="blue")
      + labs(
            x=df["series_map.series_information.independent_unit"].iloc[0],
            y=df["series_map.series_information.dependent_unit"].iloc[0],
            title=f"{df['series_group_name'].iloc[0]} - {df['series_map.series_name'].iloc[0]}",
      )
      + theme_classic()
)
plot.draw()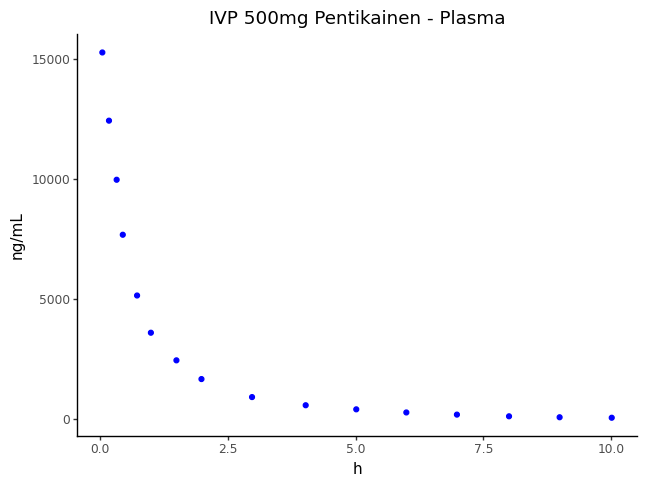
Save the project if SAVE_PROJECT is True
if SAVE_PROJECT:
    gastroplus.save_project()