
IVIVC Automation Example with Python
This jupyter notebook configures and runs an IVIVC workflow. The script utilizes the gastroPlusAPI package to communicate with the GastroPlus X 10.2 service.
Load required libraries
import gastroplus_api as gp
import pandas as pd
import os

from pprint import pprint
Start the GastroPlus service
start_service() starts the GastroPlus service and stores the port the service is listening on. Alternatively, you can start the service externally and set the port variable below.
try:
    gastroplus_service = gp.start_service(verbose=False)
except Exception as e:
print(f"Error starting GastroPlus service: {e}")GastroPlus Service configured. Listening on port: 8700Configure and create the gastroplus client instance. The gastroplus object will used to interact with the GastroPlus Service.
If not using start_service() to start the GastroPlus service (i.e., starting externally from this script), adjust the port variable below to match the port of the GastroPlus Service instance
The port set here must match the listening port of the running GastroPlus Service.
#port=8700
port = gastroplus_service.port
host = f"http://localhost:{port}"
client = gp.ApiClient(gp.Configuration(host = host))
gastroplus = gp.GpxApiWrapper(client)
Load the Project
Set the project directory and the project name. Use either a absolute or relative path to the project file. Here, we use the example Metoprolol project.
PROJECT_DIRECTORY = os.path.abspath("../../ProjectFiles/")
PROJECT_NAME = "Metoprolol"
PROJECT_FILE_NAME = os.path.join(PROJECT_DIRECTORY, PROJECT_NAME + ".gpproject")
gastroplus.open_project(PROJECT_FILE_NAME)
Check the Assets in the Project
Notice that there is one compound (Metoprolol), one physiology (Human 30YO 66kg), four formulations with their respective dose schedules (Fast CR Tablet, Slow CR Tablet, Moderate CR Tablet, New Form CR Tablet). There are two simulations for each formulation; one linked to the One-compartment PK model and the other linked to the Two-compartment PK model.
The project also contains Exposure and In Vitro Dissolution Release experimental data for the Fast, Moderate, and Slow formulations while the New Form fomulation only has In Vitro Dissolution Release data.
asset_types = [gp.AssetType.Compound,gp.AssetType.Physiology, gp.AssetType.DosingSchedule, gp.AssetType.Formulation, gp.AssetType.Simulation]
assets = gastroplus.get_assets(asset_types=asset_types)
assets_df = pd.json_normalize(assets.to_dict(), record_path=['project_assets', 'assets'], meta=[['project_assets', 'asset_type']])
assets_df = assets_df.rename(columns={assets_df.columns[0]: "assets", "project_assets.asset_type": "asset_type"})
assets_df
assets | asset_type | |
|---|---|---|
0 | Metoprolol | Compound |
1 | Human 30YO 66kg | Physiology |
2 | Fast CR Tablet | Formulation |
3 | Slow CR Tablet | Formulation |
4 | Moderate CR Tablet | Formulation |
5 | New Form CR Tablet | Formulation |
6 | Fast CR Tablet 100mg | Dosing Schedule |
7 | Moderate CR Tablet 100mg | Dosing Schedule |
8 | New Form CR Tablet 100mg | Dosing Schedule |
9 | Slow CR Tablet 100mg | Dosing Schedule |
10 | Fast CR oral tablet 100mg-2Comps | Simulation |
11 | Moderate CR oral tablet 100mg-2Comps | Simulation |
12 | Slow CR oral tablet 100mg-2Comps | Simulation |
13 | New Form CR oral tablet 100mg-2Comps | Simulation |
14 | Fast CR oral tablet 100mg-1Comp | Simulation |
15 | Moderate CR oral tablet 100mg-1Comp | Simulation |
16 | Slow CR oral tablet 100mg-1Comp | Simulation |
17 | New Form CR oral tablet 100mg-1Comp | Simulation |
experimental_data_inventory = gastroplus.experimental_data_inventory()
experimental_data_inventory_df = pd.json_normalize(experimental_data_inventory.to_dict(), record_path=['observed_series_keys'])
experimental_data_inventory_df
group_type | group_name | series_type | series_name | |
|---|---|---|---|---|
0 | InVitroDissolutionRelease | Fast CR tablet | TimeRealSeries | Fast CR tablet |
1 | InVitroDissolutionRelease | Slow CR tablet | TimeRealSeries | Slow CR tablet |
2 | InVitroDissolutionRelease | Moderate CR tablet | TimeRealSeries | Moderate CR tablet |
3 | InVitroDissolutionRelease | New Form CR tablet | TimeRealSeries | New Form CR tablet |
4 | ExposureData | Fast CR tablet 100mg | UncertainConcentrationSeries | Fast CR tablet 100mg |
5 | ExposureData | Moderate CR tablet 100mg | UncertainConcentrationSeries | Moderate CR tablet 100mg |
6 | ExposureData | Slow CR tablet 100mg | UncertainConcentrationSeries | Slow CR tablet 100mg |
Extract the assets types and exposure group names into separate lists. With the similar naming of related assets, we’ll be able to create the IVIVC configurations more easily using these lists and for-loops.
physiologies = assets_df[assets_df['asset_type'] == gp.AssetType.Physiology]['assets'].tolist()
dose_regimens = assets_df[assets_df['asset_type'] == gp.AssetType.DosingSchedule]['assets'].tolist()
simulations = assets_df[assets_df['asset_type'] == gp.AssetType.Simulation]['assets'].tolist()
exposure_group_names = experimental_data_inventory_df[experimental_data_inventory_df['group_type'] == gp.ObservedDataGroupType.ExposureData]['group_name'].tolist()
Create IVIVC Inputs
We will add the following inputs:
One Subject,
AvgSubject, with the project’s one physiologyHuman 30YO 66kgOne input for each formulation with their respective dose schedule and In Vitro dissolution series:
Input
Dose Schedule
Dissolution Series
Fast CR
Fast CR Tablet 100mg
Fast CR tablet
Moderate CR
Moderate CR Tablet 100mg
Moderate CR tablet
New Form CR
New Form CR Tablet 100mg
New Form CR tablet
Slow CR
Slow CR Tablet 100mg
Slow CR tablet
Associate each input with its respective base simulation and exposure group. A subject must also be specified but we have only one subject to select from in this example.
Input | Subject | Base Simulation | Exposure Group |
|---|---|---|---|
Fast CR | AvgSubject | Fast CR oral tablet 100mg-2Comps | Fast CR tablet 100mg |
Moderate CR | AvgSubject | Moderate CR oral tablet 100mg-2Comps | Moderate CR tablet 100mg |
New Form CR | AvgSubject | New Form CR oral tablet 100mg-2Comps | |
Slow CR | AvgSubject | Slow CR oral tablet 100mg-2Comps | Slow CR tablet 100mg |
IVIVC_SUBJECT_NAMES = ["AvgSubject"]Check the current IVIVC subject names and inputs, they should initially be empty
ivivc_subjects = gastroplus.ivivc_subjects().ivivc_subjects
ivivc_inputs = gastroplus.ivivc_inputs().ivivc_inputs
print(f"IVIVC Subjects: {ivivc_subjects}")
print(f"IVIVC Inputs: {ivivc_inputs}")
for input in ivivc_inputs:
print(f"IVIVC Input: {input}")IVIVC Subjects: []
IVIVC Inputs: []Add a subject to the IVIVC project, which will have the first (and only) physiology
for subject_name in IVIVC_SUBJECT_NAMES:
    if subject_name not in [subject.subject_name for subject in ivivc_subjects]:
        gastroplus.add_ivivc_subject(subject_name, physiologies[0])
Create an input_names and group_names lists that will help make creating our IVIVC inputs easier
input_names = [regimen.split(" Tablet")[0] for regimen in dose_regimens]
dissolution_group_names = [input + " tablet" for input in input_names]
print(f"Input Names: {input_names}")
print(f"Dissolution Group Names: {dissolution_group_names}")Input Names: ['Fast CR', 'Moderate CR', 'New Form CR', 'Slow CR']
Dissolution Group Names: ['Fast CR tablet', 'Moderate CR tablet', 'New Form CR tablet', 'Slow CR tablet']Iterate over the input names to create our inputs.
for index, input_name in enumerate(input_names):
    if input_name not in [input.input_name for input in ivivc_inputs]:
        print(f"Adding IVIVC Input: '{input_name}' with dose regimen: '{dose_regimens[index]}' and group/series name: '{dissolution_group_names[index]}'")
gastroplus.add_ivivc_input(input_name, dose_regimens[index], dissolution_group_names[index], dissolution_group_names[index])Adding IVIVC Input: 'Fast CR' with dose regimen: 'Fast CR Tablet 100mg' and group/series name: 'Fast CR tablet'
Adding IVIVC Input: 'Moderate CR' with dose regimen: 'Moderate CR Tablet 100mg' and group/series name: 'Moderate CR tablet'
Adding IVIVC Input: 'New Form CR' with dose regimen: 'New Form CR Tablet 100mg' and group/series name: 'New Form CR tablet'
Adding IVIVC Input: 'Slow CR' with dose regimen: 'Slow CR Tablet 100mg' and group/series name: 'Slow CR tablet'Since the assets were named uniformly, we can get the corresponding base simulation name and exposure group from the input names
base_simulations = [next(filter(lambda simulation: simulation.startswith(input), simulations), None) for input in input_names]
print (f"Base Simulations: {base_simulations}")
exposure_group = [next(filter(lambda group_name: group_name.startswith(input), exposure_group_names), None) for input in input_names]
print (f"Exposure_groups: {exposure_group}")Base Simulations: ['Fast CR oral tablet 100mg-2Comps', 'Moderate CR oral tablet 100mg-2Comps', 'New Form CR oral tablet 100mg-2Comps', 'Slow CR oral tablet 100mg-2Comps']
Exposure_groups: ['Fast CR tablet 100mg', 'Moderate CR tablet 100mg', None, 'Slow CR tablet 100mg']Create input subjects
for subject in IVIVC_SUBJECT_NAMES:
    for index, input_name in enumerate(input_names):
        gastroplus.add_ivivc_input_subject(input_name, subject, base_simulations[index], None if exposure_group[index] is None else exposure_group[index])
Deconvolution
The deconvolution is configured with two inputs; Moderate CR and Slow CR. The deconvolution_method is set to LooRiegelman2. After executing the deconvolution, the output is retrieved and the concentration, fraction, AUC and Levy plots are displayed.
# Select inputs for deconvolution
selected_inputs =  [input for input in input_names if input.startswith("Slow") or input.startswith("Moderate")]
print(f"Deconvolution Inputs: {selected_inputs}")

deconvolution_config = gp.DeconvolutionRunInfo(
    deconvolution_subjects = IVIVC_SUBJECT_NAMES,
    deconvolution_inputs = selected_inputs,
    deconvolution_method = "LooRiegelman2"
)

gastroplus.ivivc_configure_deconvolution(deconvolution_config)
gastroplus.ivivc_deconvolution()
deconvolution_output = gastroplus.ivivc_deconvolution_output()Deconvolution Inputs: ['Moderate CR', 'Slow CR']Plot Deconvolution Results
Deconvolution data formatting and plotting helper functions
# Deconvolution plot functions
import pandas as pd
from plotnine import ggplot, aes, geom_line, geom_point, labs
def deconvolution_output_to_series_df(deconvolution_output, level = "subjects"):
output = deconvolution_output.to_dict()["ivivc_deconvolution_output"]
try:
# Normalize the nested list of dictionaries into a flat DataFrame
# This mimics R's multiple unnest operations.
record_path = ['subjects', 'series', 'points']
meta =[
'input', # From the top level of deconv_output
['subjects', 'subject'], # From the 'subjects' list items
['subjects', 'series', 'series_name'], # From the 'series' list items
['subjects', 'series', 'independent_unit'],
['subjects', 'series', 'dependent_unit']
]
if level == "input":
record_path = ['series', 'points']
meta = [
'input', # From the top level of deconv_output
['series', 'series_name'], # From the 'series' list items
['series', 'independent_unit'],
['series', 'dependent_unit']
]
df = pd.json_normalize(
output,
record_path=record_path,
meta=meta,
errors='raise' # Raise an error if the structure is not as expected
)
except Exception as e:
print(f"Error during data normalization: {e}")
print("Please ensure deconv_output has the expected nested structure.")
# Provide guidance on expected structure if normalization fails
return
# Rename columns for clarity
rename_map = {
'subjects.subject': 'subject',
'subjects.series.series_name': 'series_name',
'series.series_name': 'series_name',
'subjects.series.independent_unit': 'independent_unit',
'subjects.series.dependent_unit': 'dependent_unit'
}
df = df.rename(columns=rename_map)
if 'series_name' not in df.columns:
print("Warning: 'series_name' column not found after normalization.")
return
if level == "subjects":
df.loc[:, 'Series'] = (
df['input'].astype(str) + " " +
df['subject'].astype(str) + " " +
df['series_name'].astype(str)
)
else:
df.loc[:, 'Series'] = (
df['input'].astype(str) + " " +
df['series_name'].astype(str)
)
return df
def unit_parens(quantity: str, unit: str) -> str:
"""
Helper function to format quantity and unit strings, similar to R's paste.
Example: unit_parens_py("Time", "h") -> "Time (h)"
"""
if pd.notna(unit) and unit: # Check for None, NaN, and empty string
return f"{quantity} ({unit})"
return quantity
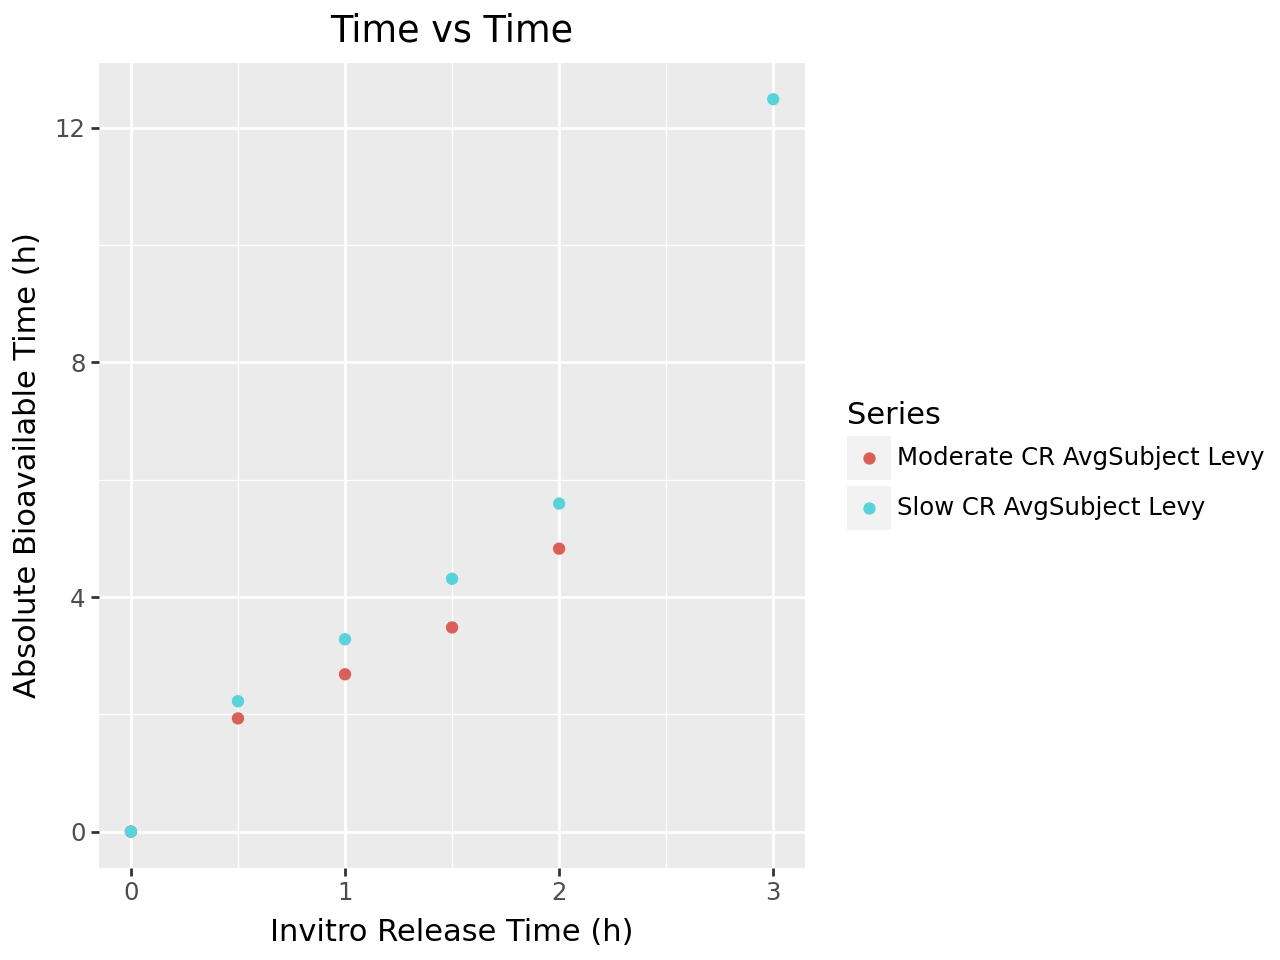
def plot_ivivc_deconvolution_levy(deconv_output, deconv_method: str):
df = deconvolution_output_to_series_df(deconv_output)
df_levy = df[df['series_name'].str.contains("Levy", regex=False, na=False)].copy()
if df_levy.empty:
print("No data found after filtering for 'Levy' series.")
return
# Determine the dependent variable label based on deconv_method
dependent_label = "Absolute Bioavailable Time"
independent_label = "Invitro Release Time"
if deconv_method == "Numerical" or deconv_method == "Mechanistic":
dependent_label = "Invivo Release Time"
independent_unit = df_levy['independent_unit'].iloc[0]
dependent_unit = df_levy['dependent_unit'].iloc[0]
plot = (ggplot(df_levy, aes(x='independent', y='dependent', color = 'Series')) +
geom_point() +
labs(title= "Time vs Time",
x = unit_parens(independent_label, independent_unit),
y = unit_parens(dependent_label, dependent_unit)
)
)
display(plot)
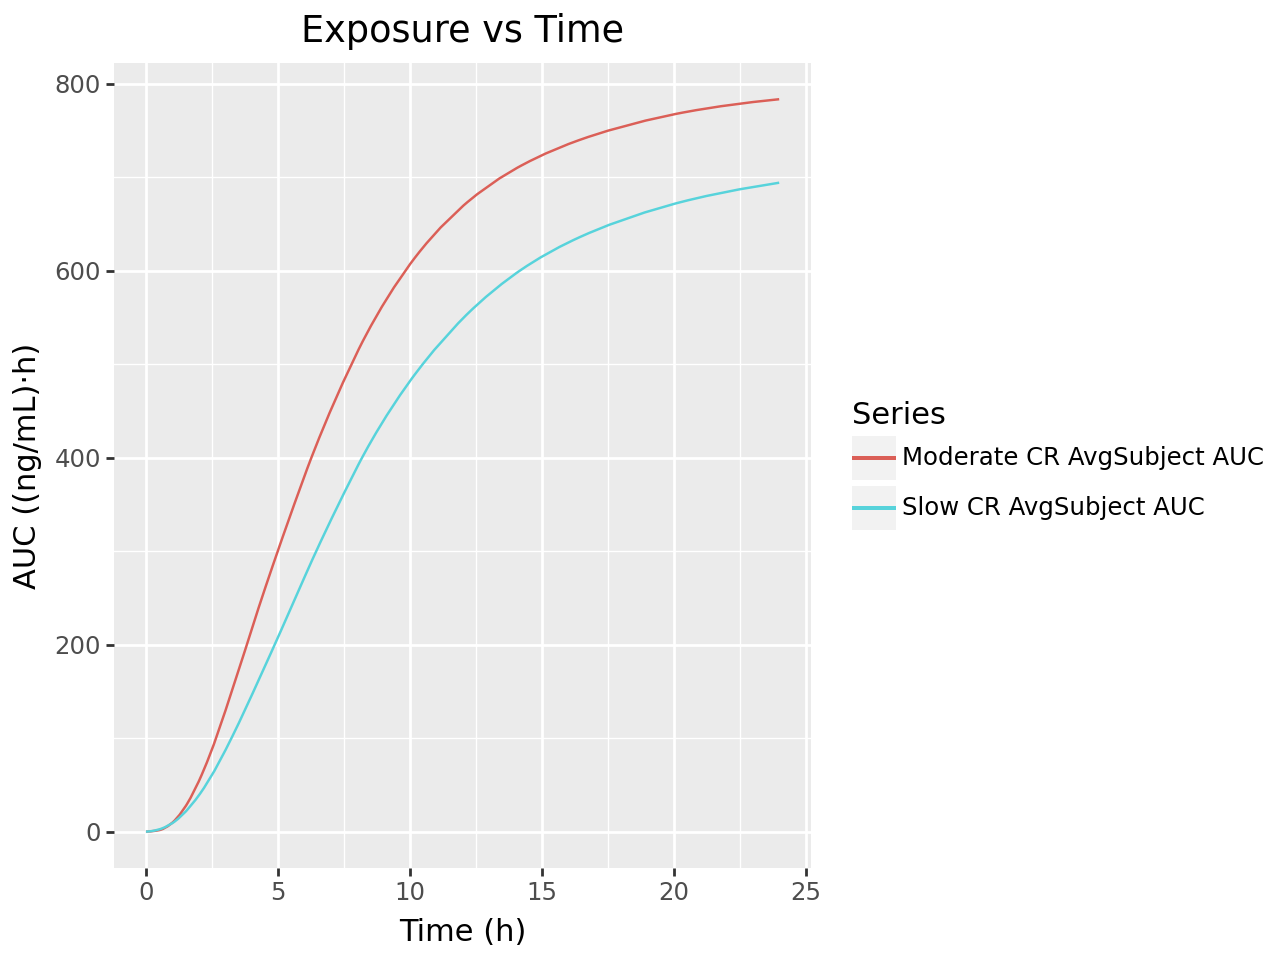
def plot_ivivc_deconvolution_auc(deconv_output):
df = deconvolution_output_to_series_df(deconv_output)
df_auc = df[df['series_name'].str.contains("AUC", regex=False, na=False)].copy()
if df_auc.empty:
print("No data found after filtering for 'AUC' series.")
return
independent_unit = df_auc['independent_unit'].iloc[0]
dependent_unit = df_auc['dependent_unit'].iloc[0]
plot = (ggplot(df_auc, aes(x='independent', y='dependent', color = 'Series')) +
geom_line() +
labs(title= "Exposure vs Time",
x = unit_parens("Time", independent_unit),
y = unit_parens("AUC", dependent_unit)
)
)
display(plot)
def plot_ivivc_deconvolution_concentration(deconv_output):
df = deconvolution_output_to_series_df(deconv_output)
df_conc = df[df['series_name'].str.contains("Plasma Concentration", regex=False, na=False)].copy()
# Add a new column 'InputSubject' so we set colors base on that combination
df_conc.loc[:, 'InputSubject'] = (
df_conc['input'].astype(str) + " " +
df_conc['subject'].astype(str) + " "
)
if df_conc.empty:
print("No data found after filtering for 'Plasma Concentration' series.")
return
observed = df_conc[df_conc['series_name'].str.contains("Observed", regex=False, na=False)].copy()
predicted = df_conc[df_conc['series_name'].str.contains("Predicted", regex=False, na=False)].copy()
independent_unit = df_conc['independent_unit'].iloc[0]
dependent_unit = df_conc['dependent_unit'].iloc[0]
plot = (ggplot() +
geom_line(predicted, aes(x = 'independent', y= 'dependent', color = 'InputSubject', group = 'Series')) +
geom_point(observed, aes(x = 'independent', y= 'dependent', color = 'InputSubject', group = 'Series')) +
labs(title= "Observed/Predicted Plasma Concentration",
x = unit_parens("Time", independent_unit),
y = unit_parens("Concentration", dependent_unit)
)
)
display(plot)
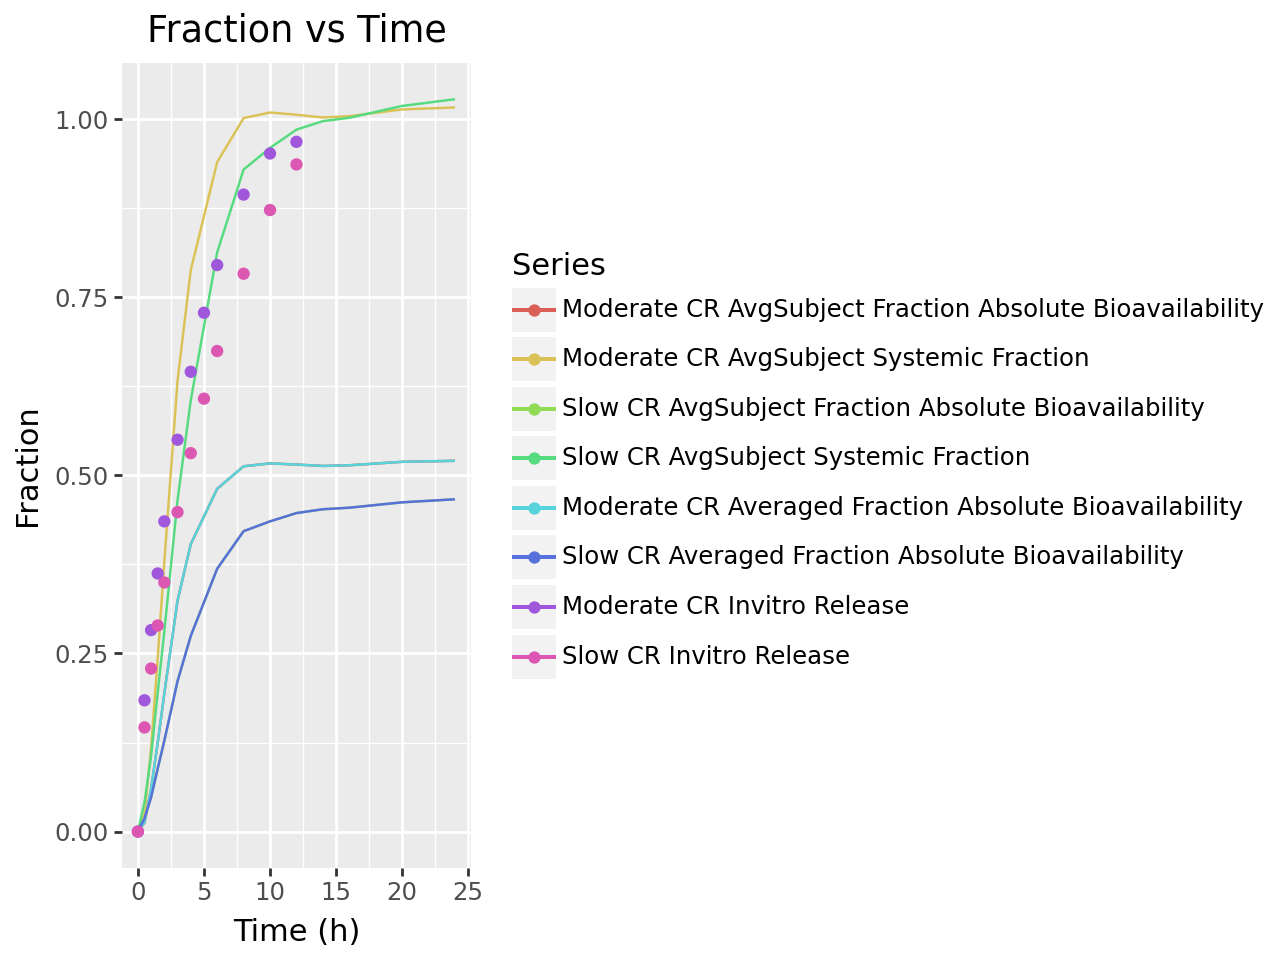
def plot_ivivc_deconvolution_fraction(deconv_output):
df = deconvolution_output_to_series_df(deconv_output)
subject_data = df[df['series_name'].str.contains("Averaged Fraction Absolute Bioavailability") |
df['series_name'].str.contains("Systemic Fraction") |
df['series_name'].str.contains("Fraction Absolute Bioavailability")].copy()
if subject_data.empty:
print("No data found after filtering for 'Invivo Release', 'Systemic Fraction', or 'Fraction Absolute Bioavailability' series.")
return
input_df = deconvolution_output_to_series_df(deconv_output, level="input")
input_data_predicted = input_df[input_df['series_name'].str.contains("Averaged Fraction Absolute Bioavailability", regex=False, na=False)].copy()
input_data_observed = input_df[input_df['series_name'].str.contains("Invitro Release", regex=False, na=False)].copy()
independent_unit = subject_data['independent_unit'].iloc[0]
plot = (ggplot() +
geom_line(subject_data, aes(x = 'independent', y= 'dependent', color = 'Series')) +
geom_line(input_data_predicted, aes(x = 'independent', y= 'dependent', color = 'Series')) +
geom_point(input_data_observed, aes(x = 'independent', y= 'dependent', color = 'Series')) +
labs(title= "Fraction vs Time",
x = unit_parens("Time", independent_unit),
y = "Fraction"
)
)
display(plot)Plot the deconvolution results
plot_ivivc_deconvolution_concentration(deconvolution_output)
plot_ivivc_deconvolution_fraction(deconvolution_output)
plot_ivivc_deconvolution_auc(deconvolution_output)
plot_ivivc_deconvolution_levy(deconvolution_output, deconvolution_config.deconvolution_method)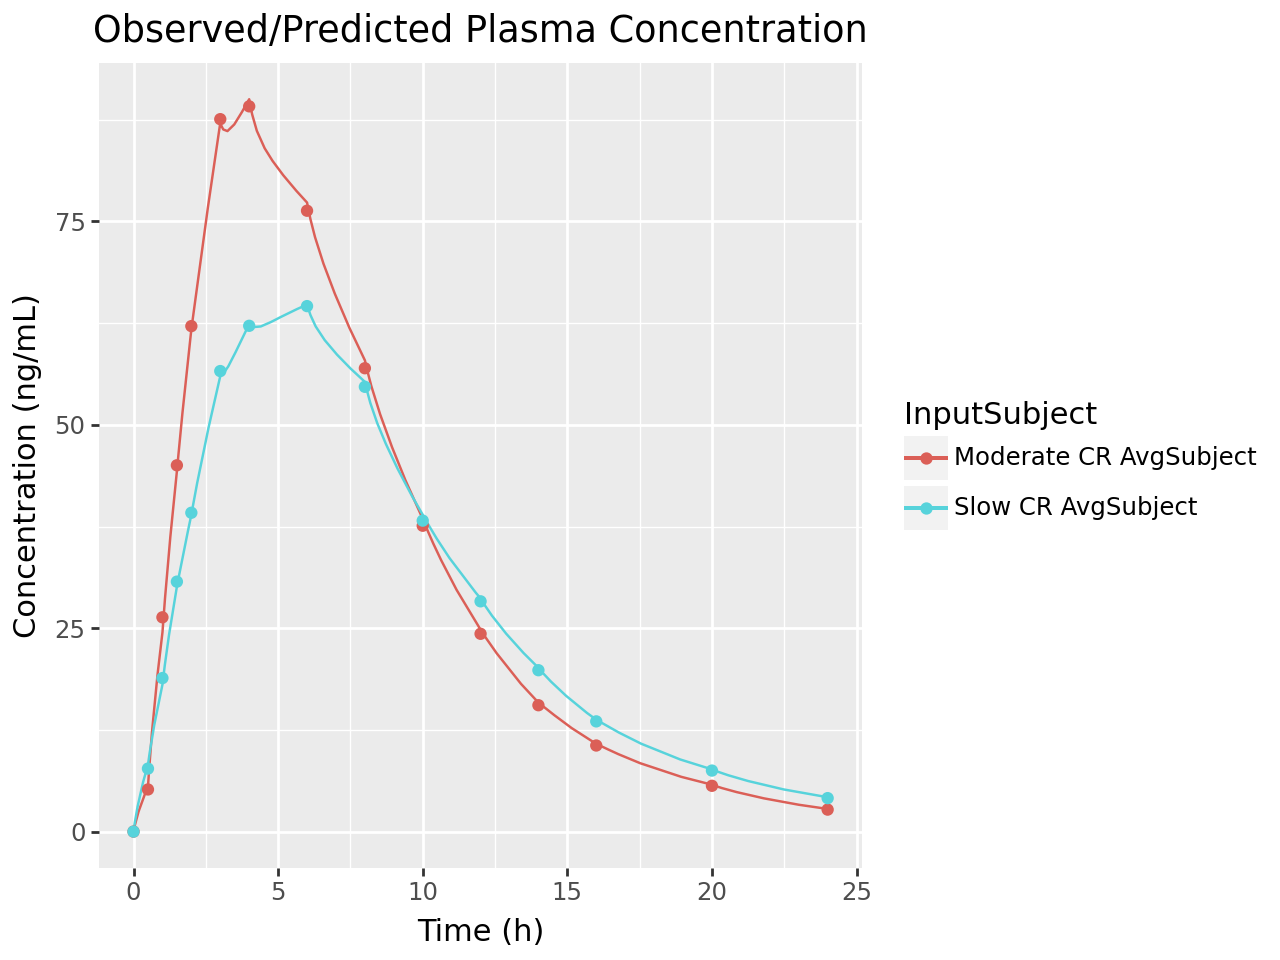
Correlation
Configure the correlation with correlation_methods Linear, Power, SecondOrder and ThirdOrder. The correlation_criterion_type is set to AkaikeInformationCriterion (the default). After executing the correlation, the output is retrieved and the summary table and correlation plot are displayed.
correlation_config = gp.CorrelationRunInfo(
    correlation_methods =  [ "Linear", "Power", "SecondOrder", "ThirdOrder"],
    correlation_criterion_type = "AkaikeInformationCriterion"
)

gastroplus.ivivc_configure_correlation(correlation_config)

gastroplus.ivivc_correlation()
correlation_output = gastroplus.ivivc_correlation_output()
Plot Correlation Results
Data formatting and plotting helper functions
# Correlation plot functions

def correlation_output_to_series_df(correlation_output):
  output = correlation_output.to_dict()["ivivc_correlation_output"]
  # Normalize the nested list of dictionaries into a flat DataFrame
  df = pd.json_normalize(
  output["correlations"],
  record_path=['correlation_fitted_series', "points"],
  meta=[
    'correlation_function_type',
    ['correlation_fitted_series', 'series_name'],
    ['correlation_fitted_series', 'independent_unit'],
    ['correlation_fitted_series', 'dependent_unit']
  ],
  errors='raise'  # Raise an error if the structure is not as expected
  )

  # Rename columns for clarity
  rename_map = {
    'correlation_fitted_series.series_name': 'series_name',
    'correlation_fitted_series.independent_unit': 'independent_unit',
    'correlation_fitted_series.dependent_unit': 'dependent_unit'
  }
  df = df.rename(columns=rename_map)

  df.loc[:, 'FullSeriesName'] = (
    df['correlation_function_type'].astype(str) +
    " Fitted Series " +
    df['series_name'].astype(str)
  )
  return df


def plot_ivivc_correlation(correlation_output):
  fits_df = correlation_output_to_series_df(correlation_output)

  inputs_df = pd.json_normalize(
    correlation_output.to_dict()["ivivc_correlation_output"]["inputs"],
    record_path=["points"],
    meta=['series_name','independent_unit','dependent_unit'],
    errors='raise'  # Raise an error if the structure is not as expected
    )


  plot = (ggplot() +
  geom_line(fits_df, aes(x = 'independent', y= 'dependent', color = 'FullSeriesName')) +
  geom_point(inputs_df, aes(x = 'independent', y= 'dependent', color = 'series_name')) +
  labs(title= "Correlations",
       x = "Fraction In Vitro Release",
       y = "Fraction Bioavailability")
  )
  display(plot)

def ivivc_correlation_summary(correlation_output):
  df = pd.json_normalize(
    correlation_output.to_dict()["ivivc_correlation_output"]["correlations"],
    )
  df = df.drop(columns=["correlation_coefficients", "correlation_fitted_series"])
  column_remap = {
    "correlation_function_type" :"FunctionType",
    "correlation_function" : "Function",
    "r_squared" : "RSQ",
    "root_mean_square_error" : "RMSE",
    "sum_squared_error" : "SSE",
    "akaike_information_criterion" : "AIC",
    "mean_absolute_error" : "MAE",
    "standard_error_prediction" : "SEP"
  }

  df = df.rename(columns=column_remap)
  df = df.sort_values(by="AIC", ascending=True)
  return df
Plot the correlation results and summary table
plot_ivivc_correlation(correlation_output)
summary_df = ivivc_correlation_summary(correlation_output)
summary_df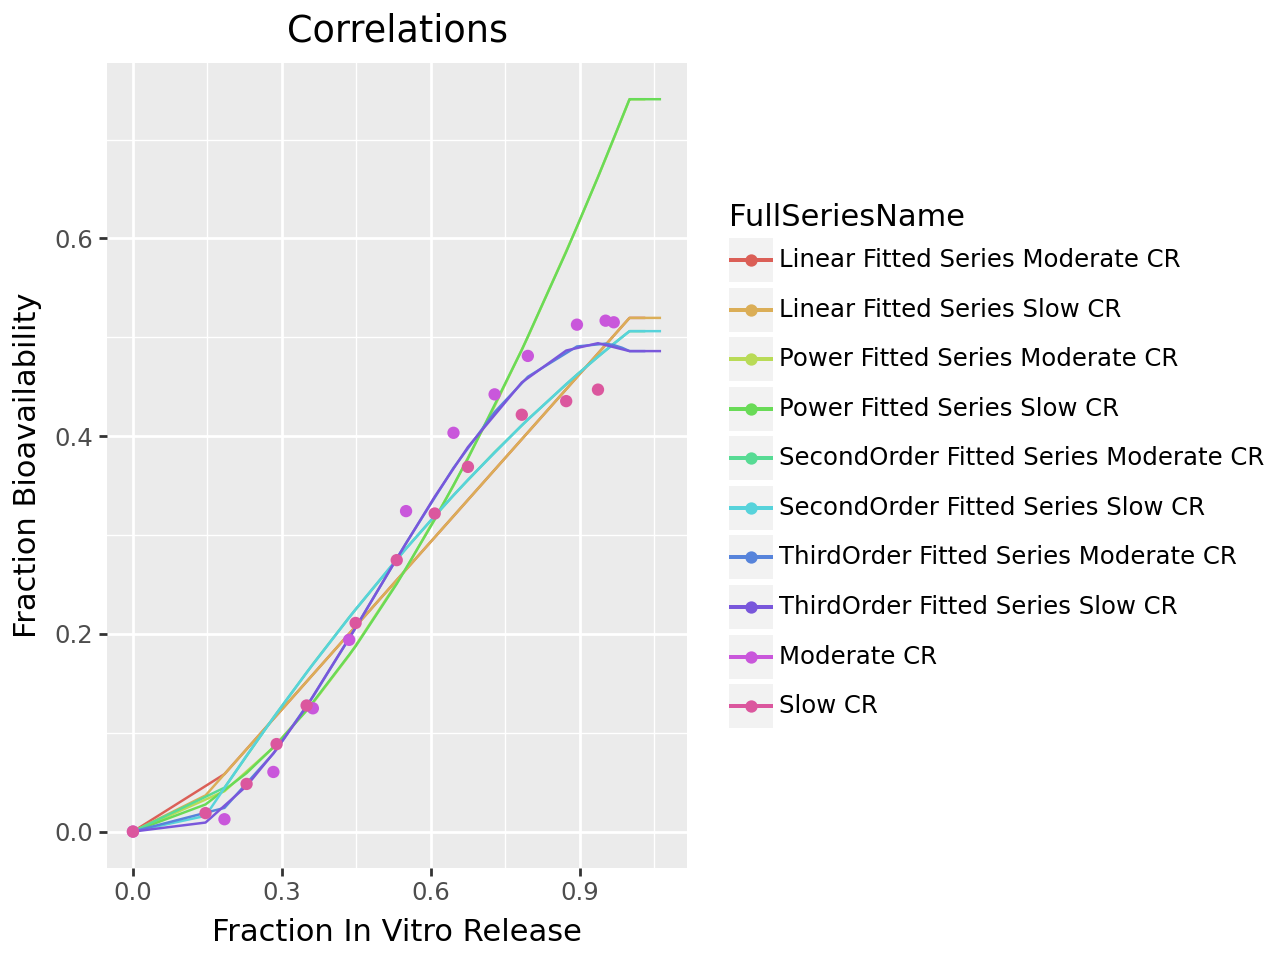
RSQ | MAE | SSE | AIC | SEP | Function | FunctionType | |
|---|---|---|---|---|---|---|---|
1 | 0.981683 | 0.020706 | 0.000603 | -221.826489 | 0.004410 | - 0.003697 - 0.189708 * x + 2.107420 * x² - 1... | ThirdOrder |
2 | 0.953225 | 0.032376 | 0.001540 | -194.764110 | 0.007047 | - 0.099090 + 0.817857 * x - 0.212538 * x² | SecondOrder |
0 | 0.944720 | 0.035056 | 0.001820 | -191.584912 | 0.007661 | - 0.046114 + 0.565753 * x | Linear |
3 | 0.348351 | 0.102872 | 0.021449 | -115.104978 | 0.026304 | 0.740853 * x¹⋅⁷¹³⁶⁰⁵ | Power |
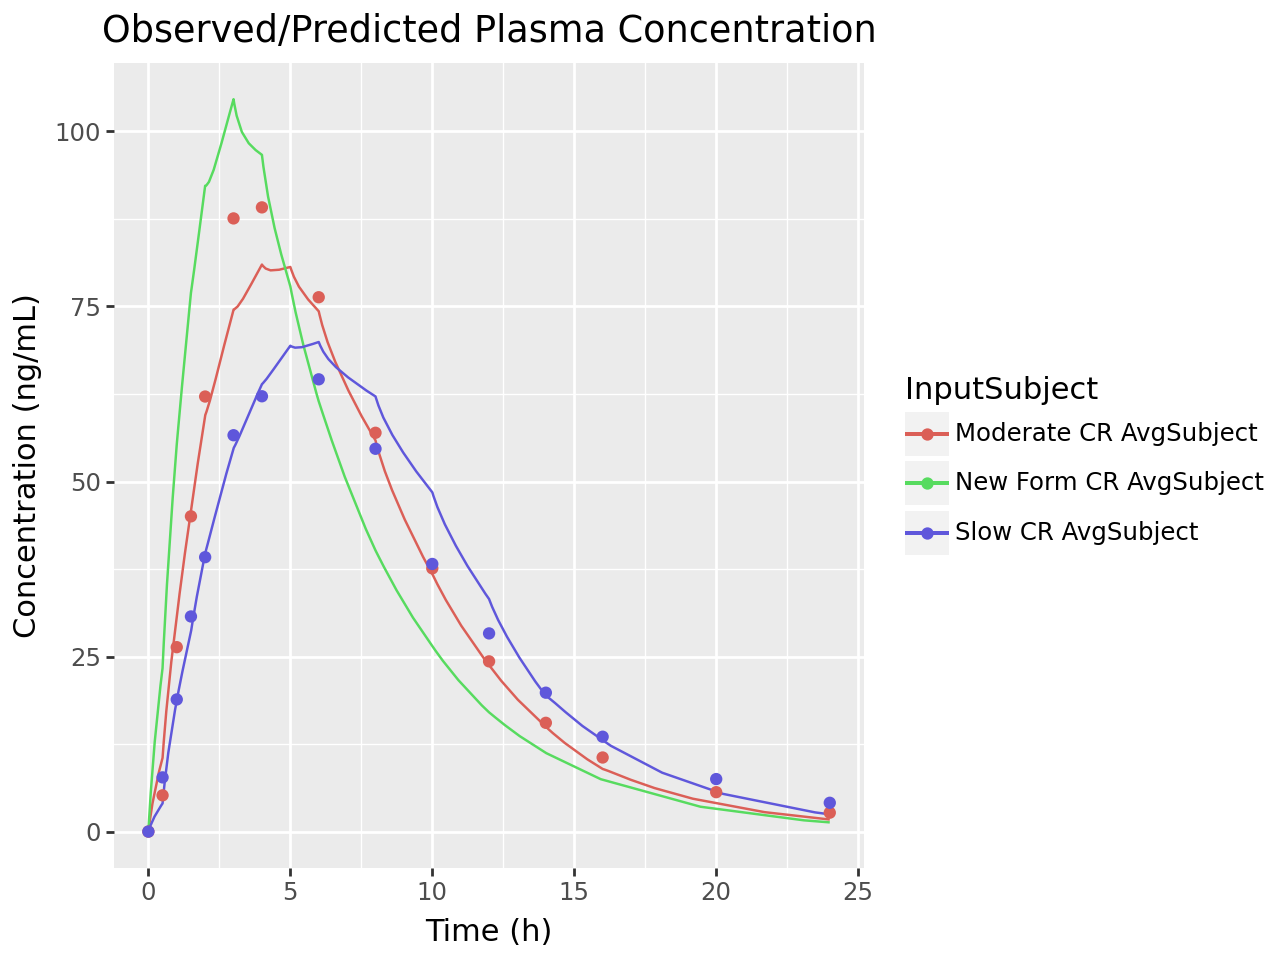
Convolution
The convolution is configured with the one subject and three inputs; Moderate CR, New Form CR and Slow CR. The convolution is executed and the output is retrieved. The observed and predicted plasma concentration-time profiles using the correlation function for all selected inputs are displayed. The reconstructed plasma concentration statistics and validation statistics are also displayed in a formatted table.
convolution_config = gp.ConvolutionRunInfo(
    convolution_subjects = IVIVC_SUBJECT_NAMES,
    convolution_inputs = [input for input in input_names if input.startswith("Slow") or input.startswith("Moderate") or input.startswith("New Form")]
)
gastroplus.ivivc_configure_convolution(convolution_config)
gastroplus.ivivc_convolution()
convolution_output = gastroplus.ivivc_convolution_output()
Plot Convolution Results
Convolution data formatting and plotting helper functions
# Convolution plot functions
def convolution_output_to_series_df(convolution_output):
output = convolution_output.to_dict()["ivivc_convolution_output"]
record_path = ['series', 'points']
meta =[
'input', # From the top level of deconv_output
"subject",
['series', 'series_name'], # From the 'series' list items
['series', 'independent_unit'],
['series', 'dependent_unit']
]
df = pd.json_normalize(
output,
record_path=record_path,
meta=meta,
errors='raise' # Raise an error if the structure is not as expected
)
# Rename columns for clarity
rename_map = {
'series.series_name': 'series_name',
'series.independent_unit': 'independent_unit',
'series.dependent_unit': 'dependent_unit'
}
df = df.rename(columns=rename_map)
if 'series_name' not in df.columns:
print("Warning: 'series_name' column not found after normalization.")
return
df.loc[:, 'Series'] = (
df['input'].astype(str) + " " +
df['subject'].astype(str) + " " +
df['series_name'].astype(str)
)
df.loc[:, 'InputSubject'] = (
df['input'].astype(str) + " " +
df['subject'].astype(str)
)
return df
def plot_ivivc_convolution_concentration(convolution_output):
df = convolution_output_to_series_df(convolution_output)
data = df[df['series_name'].str.contains("Concentration Series", regex=False, na=False) &
~df['series_name'].str.contains("Interpolated", regex=False, na=False)].copy()
observed = data[data['series_name'].str.contains("Observed", regex=False, na=False)].copy()
predicted = data[data['series_name'].str.contains("Predicted", regex=False, na=False)].copy()
independent_unit = observed['independent_unit'].iloc[0]
dependent_unit = observed['dependent_unit'].iloc[0]
plot = (ggplot() +
geom_line(predicted, aes(x = 'independent', y= 'dependent', color = 'InputSubject', group = 'Series')) +
geom_point(observed, aes(x = 'independent', y= 'dependent', color = 'InputSubject', group = 'Series')) +
labs(title= "Observed/Predicted Plasma Concentration",
x = unit_parens("Time", independent_unit),
y = unit_parens("Concentration", dependent_unit)
)
)
display(plot)
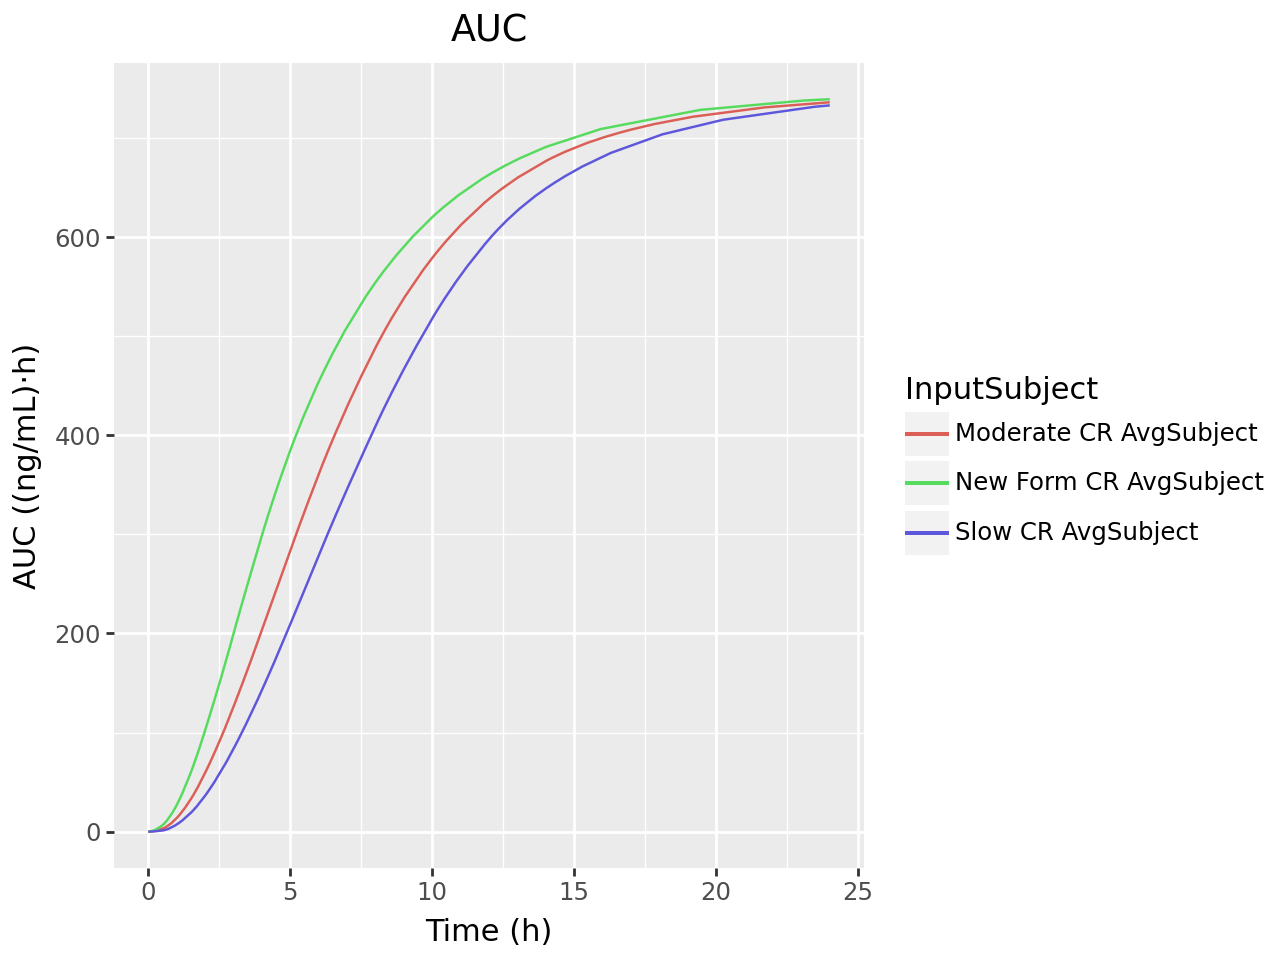
def plot_ivivc_convolution_auc(convolution_output):
df = convolution_output_to_series_df(convolution_output)
data = df[df['series_name'].str.contains("AUC Series", regex=False, na=False)].copy()
data.loc[:, 'Series'] = (
data['input'].astype(str) + " " +
data['subject'].astype(str) + " " +
"AUC Predicted"
)
independent_unit = data['independent_unit'].iloc[0]
dependent_unit = data['dependent_unit'].iloc[0]
plot = (ggplot() +
geom_line(data, aes(x = 'independent', y= 'dependent', color = 'InputSubject', group = 'Series')) +
labs(title= "AUC",
x = unit_parens("Time", independent_unit),
y = unit_parens("AUC", dependent_unit)
)
)
display(plot)
def ivivc_convolution_stats_df(convolution_output):
df = pd.DataFrame.from_dict(convolution_output.to_dict()["ivivc_convolution_output"])
df = df.drop(columns=["series"])
# Expand the 'validation_statistics' column (which contains dicts) into separate columns
validation_stats_df = pd.json_normalize(df['validation_statistics'])
df = pd.concat([df.drop(columns=['validation_statistics']), validation_stats_df], axis=1)
df = df.dropna()
return df
def ivivc_convolution_validation_stats(convolution_output):
df = ivivc_convolution_stats_df(convolution_output)
# Drop columns that start with 'reconstructed'
df = df.loc[:, ~df.columns.str.startswith('reconstructed')]
column_remap = {
"input" :"Input",
"subject" : "Subject",
"cmax_observed.value" : "Observed_CMax",
"cmax_predicted.value" : "Predicted_CMax",
"cmax_predicted.unit" : "CMax_Unit",
"cmax_error_percent" : "CMax_Prediction_Error_%",
"auc_observed.value" : "Observed_AUC",
"auc_predicted.value" : "Predicted_AUC",
"auc_predicted.unit" : "AUC_Unit",
"auc_error_percent" : "AUC_Prediction_Error_%"
}
df = df.rename(columns=column_remap)
column_order = [
"Input", "Subject", "Observed_CMax", "Predicted_CMax", "CMax_Unit", "CMax_Prediction_Error_%", "Observed_AUC",
"Predicted_AUC", "AUC_Unit", "AUC_Prediction_Error_%"
]
df = df[column_order]
return df
def ivivc_convolution_reconstructed_plasma_conc_stats(convolution_output):
df = ivivc_convolution_stats_df(convolution_output)
# Drop columns that start with 'reconstructed'
df = df.loc[:, df.columns.str.startswith('reconstructed') |
df.columns.isin(['input', 'subject'])]
column_remap = {
"input" :"Input",
"subject" : "Subject",
"reconstructed_plasma_time_profile_fit_statistics.akaike_information_criterion" : "AIC",
"reconstructed_plasma_time_profile_fit_statistics.r_squared" : "RSQ",
"reconstructed_plasma_time_profile_fit_statistics.standard_error_prediction" : "SEP",
"reconstructed_plasma_time_profile_fit_statistics.mean_absolute_error" : "MAE"
}
df = df.rename(columns=column_remap)
column_order = [
"Input", "Subject", "RSQ", "SEP", "MAE", "AIC"
]
df = df[column_order]
return df
# Convolution plotting
plot_ivivc_convolution_concentration(convolution_output)
plot_ivivc_convolution_auc(convolution_output)
stats = ivivc_convolution_validation_stats(convolution_output)
display(stats)
recon_stats = ivivc_convolution_reconstructed_plasma_conc_stats(convolution_output)
display(recon_stats)
Input | Subject | Observed_CMax | Predicted_CMax | CMax_Unit | CMax_Prediction_Error_% | Observed_AUC | Predicted_AUC | AUC_Unit | AUC_Prediction_Error_% | |
|---|---|---|---|---|---|---|---|---|---|---|
0 | Moderate CR | AvgSubject | 91.448663 | 81.210079 | ng/mL | -11.195992 | 787.305008 | 735.955569 | (ng/mL)*h | -6.522179 |
2 | Slow CR | AvgSubject | 64.791776 | 69.949769 | ng/mL | 7.960875 | 698.600711 | 731.883829 | (ng/mL)*h | 4.764255 |
Input | Subject | RSQ | SEP | MAE | AIC | |
|---|---|---|---|---|---|---|
0 | Moderate CR | AvgSubject | 0.973227 | 0.000412 | 0.003560 | -1603.593939 |
2 | Slow CR | AvgSubject | 0.941738 | 0.000402 | 0.003766 | -1543.780507 |