PSA With User-Defined Input Data
This example creates and executes PSA run with user-defined set of variables data points. The script utilizes the GastroPlusAPI package to communicate with the GastroPlus X 10.2 service.
The output from the PSA run is then used to create a 3D plot between two input variables and one output variable and a correlation plot between the input variables and the pharmacokinetic output variables.
To customize your study with this script for a different simulation / project / variables, please make changes to the “Set Input Information” section.
Load required libraries
import gastroplus_api as gp
import pandas as pd
import os

from pprint import pprint
Start the GastroPlus service
start_service() starts the GastroPlus service and stores the port the service is listening on. Alternatively, you can start the service externally and set the port variable below.
try:
    gastroplus_service = gp.start_service(verbose=False)
except Exception as e:
print(f"Error starting GastroPlus service: {e}")GastroPlus Service configured. Listening on port: 8700Configure and create the gastroplus client instance. The gastroplus object will used to interact with the GastroPlus Service.
If not using start_service() to start the GastroPlus service (i.e., starting externally from this script), adjust the port variable below to match the port of the GastroPlus Service instance
The port set here must match the listening port of the running GastroPlus Service.
#port=8700
port = gastroplus_service.port
host = f"http://localhost:{port}"
client = gp.ApiClient(gp.Configuration(host = host))
gastroplus = gp.GpxApiWrapper(client)
Setup Input Information
Make modification to the variables in this cell to customize your analysis.
PROJECT_DIRECTORY: Location of the GastroPlus project
PROJECT_NAME: Name of the project where the PSA project will be created
SIMULATION_NAME: Name of the simulation for the PSA run
PSA_ANALYSIS_MODE: Analysis mode for the PSA Run
RUN_NAME: Name of the PSA run that will be created
NUMBER_OF_USER_DEFINED_SIMULATIONS: Number of user defined points for each variable
INPUT_VARIABLES_DF: Pandas dataframe containing the variable information required to setup the PSA run.
The specified user-defined variable values will be used in each simulation of the PSA run.
PROJECT_DIRECTORY = os.path.abspath("../../ProjectFiles/")
PROJECT_NAME = "GPX Library"
PROJECT_FILE_NAME = os.path.join(PROJECT_DIRECTORY, PROJECT_NAME + ".gpproject")
SIMULATION_NAME = "Atenolol 100mg PO tablet"
RUN_NAME = "userdefined_psa"
RUN_TYPE = gp.RunType.ParameterSensitivityAnalysis
PSA_ANALYSIS_MODE = gp.ParameterSensitivityAnalysisMode.UserDefined
INPUT_VARIABLES_DF = pd.DataFrame({
    "Name": ["Strength", "Solubility", "Stomach | Lumen | pH"],
    "Values": [
        [100, 100, 100, 100, 100, 100, 100, 100, 100, 100, 100, 100, 100, 100, 100,
        10, 25, 50, 75, 125, 150, 200, 250, 500, 1000],
        [2700, 2700, 2700, 2700, 2700, 2700, 2700, 2700, 2700, 2700,
         10, 100, 1000, 2500, 5000, 2700, 2700, 2700, 2700, 2700, 2700, 2700, 2700, 2700, 2700],
        [0.1, 0.2, 0.6, 0.8, 1.0, 1.5, 2.0, 2.5, 3.0, 5.0, 1.3, 1.3, 1.3, 1.3, 1.3,
         1.3, 1.3, 1.3, 1.3, 1.3, 1.3, 1.3, 1.3, 1.3, 1.3]
    ],
    "Unit": ["milligram", "gram/meters cubed", ""]
})

NUMBER_OF_USER_DEFINED_SIMULATIONS = len(INPUT_VARIABLES_DF["Values"].iloc[0])
INPUT_VARIABLES_DF
Name | Values | Unit | |
|---|---|---|---|
0 | Strength | [100, 100, 100, 100, 100, 100, 100, 100, 100, ... | milligram |
1 | Solubility | [2700, 2700, 2700, 2700, 2700, 2700, 2700, 270... | gram/meters cubed |
2 | Stomach | Lumen | pH | [0.1, 0.2, 0.6, 0.8, 1.0, 1.5, 2.0, 2.5, 3.0, ... |
Configure and Execute the PSA Run
Based on the variables mentioned in the previous code chunk, the PSA run will be configured and executed
# Load the project
gastroplus.open_project(PROJECT_FILE_NAME)

# Create new PSA run
gastroplus.create_run(run_name=RUN_NAME, run_type=RUN_TYPE)
gastroplus.add_simulations(RUN_NAME, [SIMULATION_NAME])
Retrieve the variable information from the simulation for the variables we want to use in the PSA run. This will be used in the following cell to create the PSA parameters.
variable_information = gastroplus.get_variable_information(RUN_NAME, SIMULATION_NAME, INPUT_VARIABLES_DF["Name"].to_list(), False)
var_info = pd.json_normalize(variable_information.to_dict()["variable_information"])
var_info
scalar_type | variable_name | input_variable_name | variable_value.value | variable_value.unit | |
|---|---|---|---|---|---|
0 | ScalarType.CONCENTRATION | pharma::SmallMolecule-Atenolol|chem::Molecule|... | Solubility | 27000.0 | g/m³ |
1 | ScalarType.UNITLESS | pharma::PhysiologyRegimen-78kg HumanFasted Phy... | Stomach | Lumen | pH | 1.3 | [no units] |
2 | ScalarType.MASS | pharma::DoseRegimen-100mg PO tablet 25um|pharm... | Strength | 100.0 | mg |
Create PSA parameters, PSA settings and combine them into a PSA and Run configuration and then execute the PSA run.
psa_parameters = []

# iterate of the variables to create the PSA parameters
for row in INPUT_VARIABLES_DF.itertuples():
    # get the corresponding var_info row as a dictionary
    info = var_info.loc[var_info["input_variable_name"] == row.Name].to_dict(orient='records')[0]

    # create list of ScalarValue objects from the values in 'Values'
    scalar_values = [gp.ScalarValue(value=value, unit=row.Unit) for value in row.Values]
    #pprint(scalar_values)
    psa_parameter = gp.PSAParameter(
        variable_name=row.Name,
        baseline_value=info["variable_value.value"],
        unit=info["variable_value.unit"],
        scalar_type=info["scalar_type"],
        number_of_tests=NUMBER_OF_USER_DEFINED_SIMULATIONS,
        user_defined_values=scalar_values
    )

    psa_parameters.append(psa_parameter)


# create the PSA setting
psa_setting = gp.PSASetting(
    analysis_mode=PSA_ANALYSIS_MODE,
    simulate_baseline= False,
    update_Kp = False,
    number_of_user_defined_simulations = NUMBER_OF_USER_DEFINED_SIMULATIONS
)

# create the PSA configuration
psa_config = gp.PSAConfiguration(
    PSA_Parameters=psa_parameters,
    PSA_Setting=psa_setting
)

# create the run configuration
run_config = gp.RunConfigurationRunConfiguration(
    PSA_Configuration=psa_config
)

run_configuration = gp.RunConfiguration(
    run_name=RUN_NAME,
    run_configuration=run_config,
    use_full_variable_name=False
)

# Configure and execute the run
configure_response = gastroplus.configure_run(run_configuration)
run_response = gastroplus.execute_run(RUN_NAME)
Process run output
Get summary output and iteration records from the run just executed and create a dataframe that can be used for visualization of results
simulation_keys = gastroplus.available_simulation_iteration_keys(RUN_NAME).simulation_iteration_keys
sim_keys = [key.simulation_iteration_key_name for key in simulation_keys]

summary_output = gastroplus.summary_output(RUN_NAME, gp.SummaryOutputRequest(simulation_iteration_key_names= sim_keys))
sum_df = pd.json_normalize(summary_output.to_dict()["summary_output"])
# Add the simulation iteration keys to the DataFrame, we'll using it later to combine with the iteration records
sum_df['simulation_iteration_key'] = sim_keys
Retrieve the iteration records and append the variable values and their units to the summary dataframe. Note, while the table does not render well in this online documentation, it will render properly is VSCode or when rendered to html.
iteration_records_request_body = gp.IterationRecordsRequest(simulation_iteration_key_names= sim_keys, variable_names=INPUT_VARIABLES_DF["Name"].to_list() )

iteration_records = gastroplus.iteration_records(RUN_NAME, iteration_records_request_body)
iteration_df = pd.json_normalize(iteration_records.to_dict()["iteration_records"])

long_df = iteration_df.explode('variable_values')

long_df = pd.concat([
        long_df.drop(['variable_values'], axis=1),
        long_df['variable_values'].apply(pd.Series)
    ], axis=1)
long_df = pd.concat([
        long_df.drop(['variable_value'], axis=1),
        long_df['variable_value'].apply(pd.Series)
    ], axis=1)
pivoted_df = long_df.pivot(
        index='simulation_iteration_key',
        columns='variable',
        values=['value', 'unit']
    )
pivoted_df.columns = [f"{var}.{col}" for col, var in pivoted_df.columns]
pivoted_df = pivoted_df.reset_index()
pivoted_df

merged_df = pd.merge(sum_df, pivoted_df, on='simulation_iteration_key', how='inner')
merged_df
compound | absorbed | bioavailable | portal_vein | run_simulation_iteration_key | simulation_iteration_key_name | simulation_iteration_key_name_2 | iteration | clearance.value | clearance.unit | ... | total_dose.unit | total_exposure.value | total_exposure.unit | simulation_iteration_key | Solubility.value | Stomach | Lumen | pH.value | Strength.value | Solubility.unit | Stomach | Lumen | pH.unit | Strength.unit | |
|---|---|---|---|---|---|---|---|---|---|---|---|---|---|---|---|---|---|---|---|---|---|
0 | Atenolol | 0.410565 | 0.399227 | 0.399227 | userdefined_psa - Atenolol 100mg PO tablet | D... | Atenolol 100mg PO tablet 0 | Atenolol 100mg PO tablet | Dose: 0.1mg | Solub... | 0 | 27.680189 | L/h | ... | mg | 3456.081716 | (ng/mL)*h | Atenolol 100mg PO tablet | Dose: 0.1mg | Solub... | 2700.0 | 0.1 | 0.1 | g/m³ | [no units] | g |
1 | Atenolol | 0.410533 | 0.399195 | 0.399195 | userdefined_psa - Atenolol 100mg PO tablet | D... | Atenolol 100mg PO tablet 1 | Atenolol 100mg PO tablet | Dose: 0.1mg | Solub... | 1 | 27.691223 | L/h | ... | mg | 3454.489059 | (ng/mL)*h | Atenolol 100mg PO tablet | Dose: 0.1mg | Solub... | 2700.0 | 0.2 | 0.1 | g/m³ | [no units] | g |
2 | Atenolol | 0.410533 | 0.399195 | 0.399195 | userdefined_psa - Atenolol 100mg PO tablet | D... | Atenolol 100mg PO tablet 2 | Atenolol 100mg PO tablet | Dose: 0.1mg | Solub... | 2 | 27.684446 | L/h | ... | mg | 3455.435771 | (ng/mL)*h | Atenolol 100mg PO tablet | Dose: 0.1mg | Solub... | 2700.0 | 0.6 | 0.1 | g/m³ | [no units] | g |
3 | Atenolol | 0.410536 | 0.399198 | 0.399198 | userdefined_psa - Atenolol 100mg PO tablet | D... | Atenolol 100mg PO tablet 3 | Atenolol 100mg PO tablet | Dose: 0.1mg | Solub... | 3 | 27.692797 | L/h | ... | mg | 3453.833819 | (ng/mL)*h | Atenolol 100mg PO tablet | Dose: 0.1mg | Solub... | 2700.0 | 0.8 | 0.1 | g/m³ | [no units] | g |
4 | Atenolol | 0.410533 | 0.399195 | 0.399195 | userdefined_psa - Atenolol 100mg PO tablet | D... | Atenolol 100mg PO tablet 4 | Atenolol 100mg PO tablet | Dose: 0.1mg | Solub... | 4 | 27.674114 | L/h | ... | mg | 3457.707796 | (ng/mL)*h | Atenolol 100mg PO tablet | Dose: 0.1mg | Solub... | 2700.0 | 1.0 | 0.1 | g/m³ | [no units] | g |
5 | Atenolol | 0.410533 | 0.399196 | 0.399196 | userdefined_psa - Atenolol 100mg PO tablet | D... | Atenolol 100mg PO tablet 5 | Atenolol 100mg PO tablet | Dose: 0.1mg | Solub... | 5 | 27.685797 | L/h | ... | mg | 3455.356437 | (ng/mL)*h | Atenolol 100mg PO tablet | Dose: 0.1mg | Solub... | 2700.0 | 1.5 | 0.1 | g/m³ | [no units] | g |
6 | Atenolol | 0.410533 | 0.399195 | 0.399195 | userdefined_psa - Atenolol 100mg PO tablet | D... | Atenolol 100mg PO tablet 6 | Atenolol 100mg PO tablet | Dose: 0.1mg | Solub... | 6 | 27.687610 | L/h | ... | mg | 3454.454944 | (ng/mL)*h | Atenolol 100mg PO tablet | Dose: 0.1mg | Solub... | 2700.0 | 2.0 | 0.1 | g/m³ | [no units] | g |
7 | Atenolol | 0.410534 | 0.399197 | 0.399197 | userdefined_psa - Atenolol 100mg PO tablet | D... | Atenolol 100mg PO tablet 7 | Atenolol 100mg PO tablet | Dose: 0.1mg | Solub... | 7 | 27.692637 | L/h | ... | mg | 3453.231281 | (ng/mL)*h | Atenolol 100mg PO tablet | Dose: 0.1mg | Solub... | 2700.0 | 2.5 | 0.1 | g/m³ | [no units] | g |
8 | Atenolol | 0.410533 | 0.399195 | 0.399195 | userdefined_psa - Atenolol 100mg PO tablet | D... | Atenolol 100mg PO tablet 8 | Atenolol 100mg PO tablet | Dose: 0.1mg | Solub... | 8 | 27.666622 | L/h | ... | mg | 3459.035315 | (ng/mL)*h | Atenolol 100mg PO tablet | Dose: 0.1mg | Solub... | 2700.0 | 3.0 | 0.1 | g/m³ | [no units] | g |
9 | Atenolol | 0.410533 | 0.399195 | 0.399195 | userdefined_psa - Atenolol 100mg PO tablet | D... | Atenolol 100mg PO tablet 9 | Atenolol 100mg PO tablet | Dose: 0.1mg | Solub... | 9 | 27.691636 | L/h | ... | mg | 3454.281499 | (ng/mL)*h | Atenolol 100mg PO tablet | Dose: 0.1mg | Solub... | 2700.0 | 5.0 | 0.1 | g/m³ | [no units] | g |
10 | Atenolol | 0.259672 | 0.255476 | 0.255476 | userdefined_psa - Atenolol 100mg PO tablet | D... | Atenolol 100mg PO tablet 10 | Atenolol 100mg PO tablet | Dose: 0.1mg | Solub... | 10 | 43.338476 | L/h | ... | mg | 2199.918021 | (ng/mL)*h | Atenolol 100mg PO tablet | Dose: 0.1mg | Solub... | 10.0 | 1.3 | 0.1 | g/m³ | [no units] | g |
11 | Atenolol | 0.409335 | 0.397973 | 0.397973 | userdefined_psa - Atenolol 100mg PO tablet | D... | Atenolol 100mg PO tablet 11 | Atenolol 100mg PO tablet | Dose: 0.1mg | Solub... | 11 | 27.761301 | L/h | ... | mg | 3446.662835 | (ng/mL)*h | Atenolol 100mg PO tablet | Dose: 0.1mg | Solub... | 100.0 | 1.3 | 0.1 | g/m³ | [no units] | g |
12 | Atenolol | 0.410529 | 0.399189 | 0.399189 | userdefined_psa - Atenolol 100mg PO tablet | D... | Atenolol 100mg PO tablet 12 | Atenolol 100mg PO tablet | Dose: 0.1mg | Solub... | 12 | 27.705661 | L/h | ... | mg | 3452.359106 | (ng/mL)*h | Atenolol 100mg PO tablet | Dose: 0.1mg | Solub... | 1000.0 | 1.3 | 0.1 | g/m³ | [no units] | g |
13 | Atenolol | 0.410533 | 0.399196 | 0.399196 | userdefined_psa - Atenolol 100mg PO tablet | D... | Atenolol 100mg PO tablet 13 | Atenolol 100mg PO tablet | Dose: 0.1mg | Solub... | 13 | 27.670259 | L/h | ... | mg | 3458.305498 | (ng/mL)*h | Atenolol 100mg PO tablet | Dose: 0.1mg | Solub... | 2500.0 | 1.3 | 0.1 | g/m³ | [no units] | g |
14 | Atenolol | 0.410536 | 0.399198 | 0.399198 | userdefined_psa - Atenolol 100mg PO tablet | D... | Atenolol 100mg PO tablet 14 | Atenolol 100mg PO tablet | Dose: 0.1mg | Solub... | 14 | 27.682014 | L/h | ... | mg | 3456.177532 | (ng/mL)*h | Atenolol 100mg PO tablet | Dose: 0.1mg | Solub... | 5000.0 | 1.3 | 0.1 | g/m³ | [no units] | g |
15 | Atenolol | 0.410533 | 0.399196 | 0.399196 | userdefined_psa - Atenolol 100mg PO tablet | D... | Atenolol 100mg PO tablet 15 | Atenolol 100mg PO tablet | Dose: 0.01mg | Solu... | 15 | 27.702988 | L/h | ... | mg | 345.392617 | (ng/mL)*h | Atenolol 100mg PO tablet | Dose: 0.01mg | Solu... | 2700.0 | 1.3 | 0.01 | g/m³ | [no units] | g |
16 | Atenolol | 0.410549 | 0.399206 | 0.399206 | userdefined_psa - Atenolol 100mg PO tablet | D... | Atenolol 100mg PO tablet 16 | Atenolol 100mg PO tablet | Dose: 0.025mg | Sol... | 16 | 27.672448 | L/h | ... | mg | 864.580236 | (ng/mL)*h | Atenolol 100mg PO tablet | Dose: 0.025mg | Sol... | 2700.0 | 1.3 | 0.025 | g/m³ | [no units] | g |
17 | Atenolol | 0.410549 | 0.399209 | 0.399209 | userdefined_psa - Atenolol 100mg PO tablet | D... | Atenolol 100mg PO tablet 17 | Atenolol 100mg PO tablet | Dose: 0.05mg | Solu... | 17 | 27.703775 | L/h | ... | mg | 1725.998829 | (ng/mL)*h | Atenolol 100mg PO tablet | Dose: 0.05mg | Solu... | 2700.0 | 1.3 | 0.05 | g/m³ | [no units] | g |
18 | Atenolol | 0.410535 | 0.399197 | 0.399197 | userdefined_psa - Atenolol 100mg PO tablet | D... | Atenolol 100mg PO tablet 18 | Atenolol 100mg PO tablet | Dose: 0.075mg | Sol... | 18 | 27.691480 | L/h | ... | mg | 2590.686281 | (ng/mL)*h | Atenolol 100mg PO tablet | Dose: 0.075mg | Sol... | 2700.0 | 1.3 | 0.075 | g/m³ | [no units] | g |
19 | Atenolol | 0.410534 | 0.399196 | 0.399196 | userdefined_psa - Atenolol 100mg PO tablet | D... | Atenolol 100mg PO tablet 19 | Atenolol 100mg PO tablet | Dose: 0.125mg | Sol... | 19 | 27.675969 | L/h | ... | mg | 4321.655892 | (ng/mL)*h | Atenolol 100mg PO tablet | Dose: 0.125mg | Sol... | 2700.0 | 1.3 | 0.125 | g/m³ | [no units] | g |
20 | Atenolol | 0.410533 | 0.399195 | 0.399195 | userdefined_psa - Atenolol 100mg PO tablet | D... | Atenolol 100mg PO tablet 20 | Atenolol 100mg PO tablet | Dose: 0.15mg | Solu... | 20 | 27.690890 | L/h | ... | mg | 5180.773419 | (ng/mL)*h | Atenolol 100mg PO tablet | Dose: 0.15mg | Solu... | 2700.0 | 1.3 | 0.15 | g/m³ | [no units] | g |
21 | Atenolol | 0.410536 | 0.399198 | 0.399198 | userdefined_psa - Atenolol 100mg PO tablet | D... | Atenolol 100mg PO tablet 21 | Atenolol 100mg PO tablet | Dose: 0.2mg | Solub... | 21 | 27.681784 | L/h | ... | mg | 6912.823425 | (ng/mL)*h | Atenolol 100mg PO tablet | Dose: 0.2mg | Solub... | 2700.0 | 1.3 | 0.2 | g/m³ | [no units] | g |
22 | Atenolol | 0.410535 | 0.399197 | 0.399197 | userdefined_psa - Atenolol 100mg PO tablet | D... | Atenolol 100mg PO tablet 22 | Atenolol 100mg PO tablet | Dose: 0.25mg | Solu... | 22 | 27.684051 | L/h | ... | mg | 8640.382330 | (ng/mL)*h | Atenolol 100mg PO tablet | Dose: 0.25mg | Solu... | 2700.0 | 1.3 | 0.25 | g/m³ | [no units] | g |
23 | Atenolol | 0.410533 | 0.399195 | 0.399195 | userdefined_psa - Atenolol 100mg PO tablet | D... | Atenolol 100mg PO tablet 23 | Atenolol 100mg PO tablet | Dose: 0.5mg | Solub... | 23 | 27.692355 | L/h | ... | mg | 17272.443863 | (ng/mL)*h | Atenolol 100mg PO tablet | Dose: 0.5mg | Solub... | 2700.0 | 1.3 | 0.5 | g/m³ | [no units] | g |
24 | Atenolol | 0.410533 | 0.399195 | 0.399195 | userdefined_psa - Atenolol 100mg PO tablet | D... | Atenolol 100mg PO tablet 24 | Atenolol 100mg PO tablet | Dose: 1mg | Solubil... | 24 | 27.695230 | L/h | ... | mg | 34541.847106 | (ng/mL)*h | Atenolol 100mg PO tablet | Dose: 1mg | Solubil... | 2700.0 | 1.3 | 1.0 | g/m³ | [no units] | g |
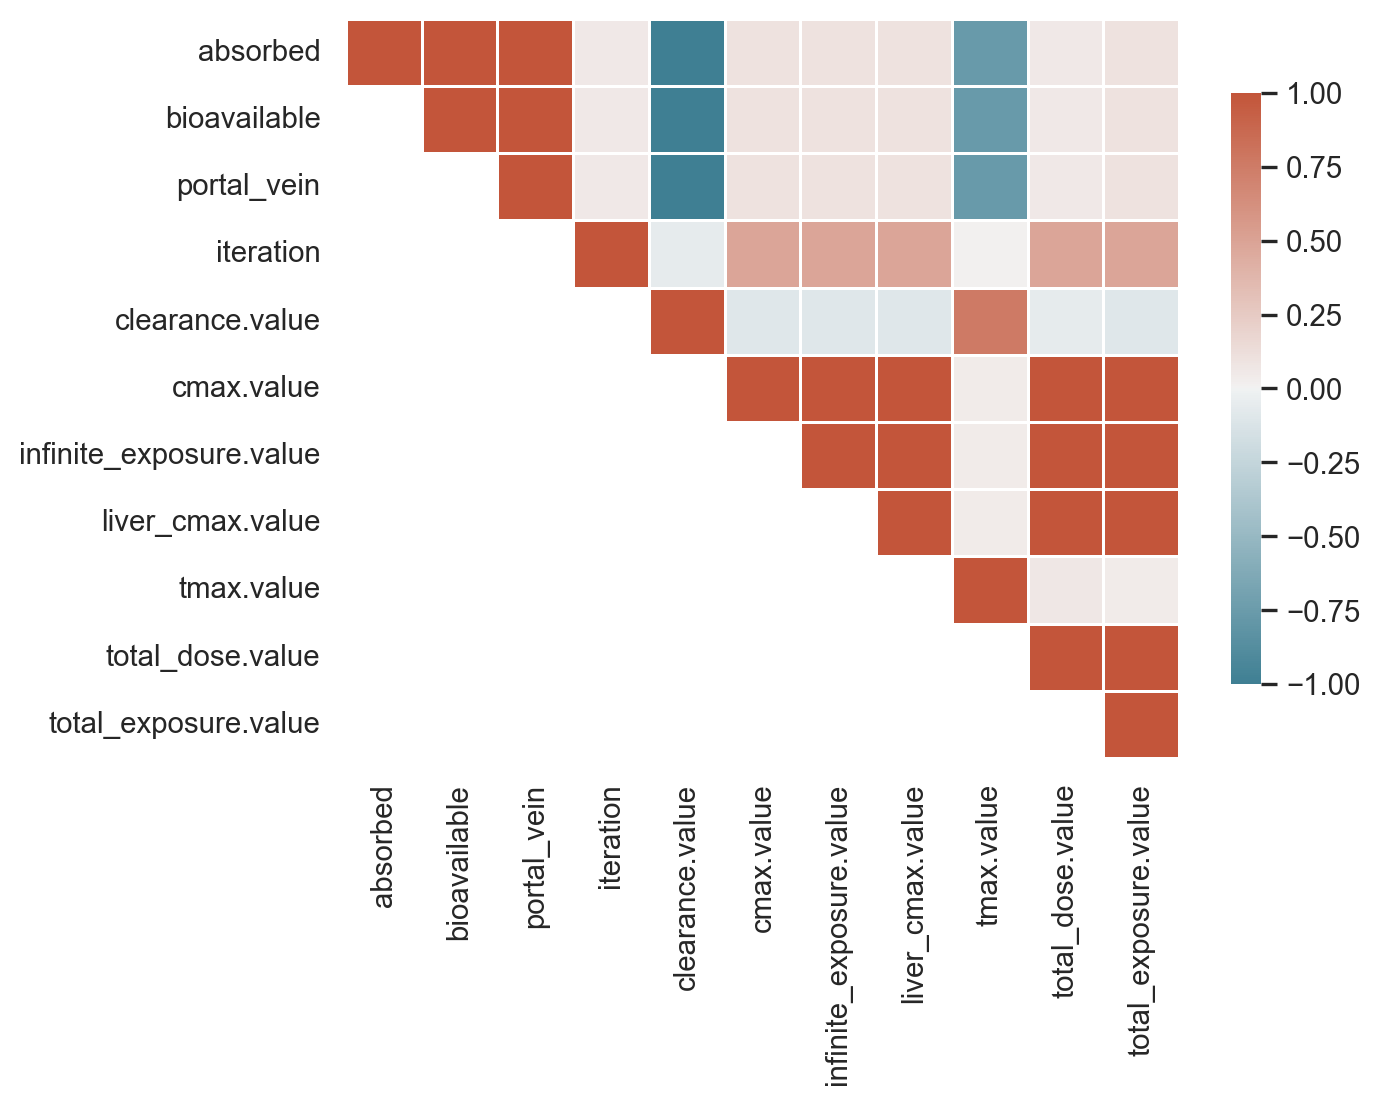
Correlation plot
import matplotlib.pyplot as plt
import seaborn as sns
import numpy as np

numeric_cols = merged_df.select_dtypes(include='number').columns
df_numeric = merged_df.set_index('simulation_iteration_key')[numeric_cols]

corr = df_numeric.corr()
sns.set_theme(style="white")
cmap = sns.diverging_palette(220, 20, as_cmap=True)
mask = np.logical_xor(np.tril(np.ones_like(corr, dtype=bool)),
                      np.eye(*corr.shape, dtype=bool))
sns.heatmap(corr, annot=False, cmap=cmap, mask=mask, vmin=-1, vmax=1, center=0, linecolor='white', linewidths=0.5, cbar_kws={"shrink": .8})

plt.show()
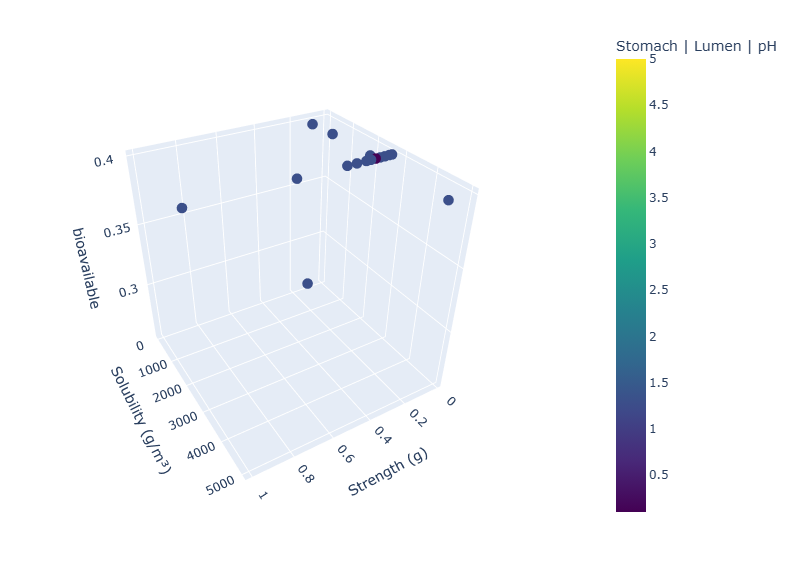
Plot results in 3D plot
import plotly

# Create `values` and `units` dataframe of the data to be plotted
variables_names = dict(x='Strength', y='Solubility', z='bioavailable', color = 'Stomach | Lumen | pH')
values = merged_df[[f"{variables_names['x']}.value",
                              f"{variables_names['y']}.value",
                                f"{variables_names['z']}",
                                f"{variables_names['color']}.value",
 ]]

units = dict(x=merged_df[f"{variables_names['x']}.unit"].iloc[0],
             y=merged_df[f"{variables_names['y']}.unit"].iloc[0],
             z="",
             color="pH")

# Create 3D scatter plot
fig = plotly.graph_objs.Figure(
  data=[plotly.graph_objs.Scatter3d(
    x=values[f"{variables_names['x']}.value"],
    y=values[f"{variables_names['y']}.value"],
    z=values[f"{variables_names['z']}"],
    mode='markers',
    marker=dict(
      size=6,
      color=values[f"{variables_names['color']}.value"],
      colorbar=dict(title=variables_names['color']),
      colorscale='Viridis'
    ),
    text=sim_keys
  )]
)
fig.update_layout(
  scene=dict(
    xaxis_title=f"{variables_names['x']} ({units['x']})",
    yaxis_title=f"{variables_names['y']} ({units['y']})",
    zaxis_title=f"{variables_names['z']}"
  )
)
fig.show()Unable to display output for mime type(s): text/htmlUnable to display output for mime type(s): text/html