Run Batch Simulation
This Jupyter notebook executes a run of type ‘batch simulation’. The script utilizes the gastroPlusAPI package to communicate with the GastroPlus X 10.2 service.
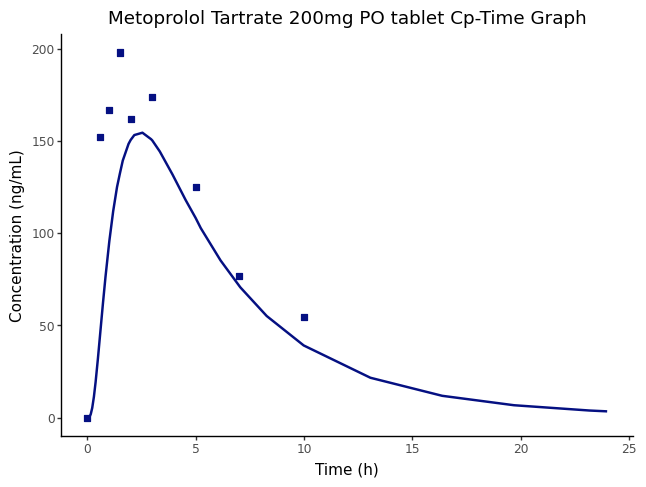
The output from the batch simulation run is then used to create a Cp-time plot.
To customize your study with this script for a different simulation / project / variables, please make changes to the ‘Setup Input Information’ section.
Load required libraries
import gastroplus_api as gp
import pandas as pd
from pprint import pprint
import os
Start the GastroPlus service
start_service() starts the GastroPlus service and stores the port the service is listening on. Alternatively, you can start the service externally and set the port variable below.
try:
    gastroplus_service = gp.start_service(verbose=False)
except Exception as e:
    print(f"Error starting GastroPlus service: {e}")
GastroPlus Service configured. Listening on port: 8700Configure and create the gastroplus client instance. The gastroplus object will used to interact with the GastroPlus Service.
If not using start_service() to start the GastroPlus service (i.e., starting externally from this script), adjust the port variable below to match the port of the GastroPlus Service instance
The port set here must match the listening port of the running GastroPlus Service.
#port=8700
port = gastroplus_service.port
host = f"http://localhost:{port}"
client = gp.ApiClient(gp.Configuration(host = host))
gastroplus = gp.GpxApiWrapper(client)
Setup Input Information
Make modification to the variables in this chunk to customize your workflow.
PROJECT_DIRECTORY: Location of the GastroPlus project
PROJECT_NAME: Name of the GastroPlus project
SIMULATION_NAME: Simulation name that will be included to the run
RUN_NAME: Name of the run that will be created
OBSERVED_DATA_GROUP_NAME & OBSERVED_DATA_SERIES_NAME: Observed data details to be used for plotting.
PROJECT_DIRECTORY = os.path.abspath("../../ProjectFiles")
PROJECT_NAME = "GPX Library"
# Combined the above to create the full project file path
PROJECT_FILE_NAME = os.path.join(PROJECT_DIRECTORY, PROJECT_NAME + ".gpproject")
SIMULATION_NAME = "Metoprolol Tartrate 200mg PO tablet"
RUN_NAME = "BatchSimRun"
OBSERVED_DATA_GROUP_NAME = "Metoprolol Tartrate PO Cp time"
OBSERVED_DATA_SERIES_NAME = "Metoprolol Tartrate Exposure Plasma"
Execute the Run
Based on the details defined in the previous code cell, the batch simulation run will be created, and the run executed.
gastroplus.open_project(PROJECT_FILE_NAME)
gastroplus.create_run(RUN_NAME, gp.RunType.BatchSimulation)
gastroplus.add_simulations(RUN_NAME, [SIMULATION_NAME])
gastroplus.execute_run(RUN_NAME)
Process Run Output
This section retrieves and processes the results from the batch simulation run, including:
Getting summary output with pharmacokinetic parameters
Identifying and retrieving the concentration-time series data
Retrieving observed data for comparison and plot the data
iteration_keys = gastroplus.available_simulation_iteration_keys(RUN_NAME).simulation_iteration_keys
simulation_iteration_keys = gp.SummaryOutputRequest(
    simulation_iteration_key_names=[key.simulation_iteration_key_name for key in iteration_keys if key.simulation_name == SIMULATION_NAME]
)
summary_output = gastroplus.summary_output(RUN_NAME, summary_output_request=simulation_iteration_keys)
summary_df = pd.json_normalize(summary_output.to_dict(), record_path='summary_output')
# Transpose the dataframe so that columns become rows, then reset index and rename columns
summary_df_t = summary_df.set_index('compound').transpose().reset_index()
summary_df_t.columns = ['parameter', 'Metoprolol Tartrate']
summary_df_t
parameter | Metoprolol Tartrate | |
|---|---|---|
0 | absorbed | 0.933385 |
1 | bioavailable | 0.650229 |
2 | portal_vein | 0.931027 |
3 | run_simulation_iteration_key | BatchSimRun - Metoprolol Tartrate 200mg PO tab... |
4 | simulation_iteration_key_name | Metoprolol Tartrate 200mg PO tablet 0 |
5 | simulation_iteration_key_name_2 | Metoprolol Tartrate 200mg PO tablet |
6 | iteration | 0 |
7 | clearance.value | 137.070639 |
8 | clearance.unit | L/h |
9 | cmax.value | 154.501889 |
10 | cmax.unit | ng/mL |
11 | infinite_exposure.value | 1139.266595 |
12 | infinite_exposure.unit | (ng/mL)*h |
13 | liver_cmax.value | 626.613073 |
14 | liver_cmax.unit | ng/mL |
15 | tmax.value | 2.54262 |
16 | tmax.unit | h |
17 | total_dose.value | 156.16 |
18 | total_dose.unit | mg |
19 | total_exposure.value | 1116.372593 |
20 | total_exposure.unit | (ng/mL)*h |
Get the list of all available concentration series
available_concentration_series = gastroplus.available_run_series_data(RUN_NAME, gp.ScalarType.Concentration, SIMULATION_NAME).state_descriptors
Get some of the simulation output data. First create the state descriptor strings by combining the compound name, state type, and compartment type. They will be used to retrieve the simulation results.
# Define the series descriptor for plasma concentration
separator = " - "
compound_name = summary_df.compound.iloc[0]
plasma_concentration_series_descriptor = separator.join((compound_name, gp.CompartmentType.SystemicCirculation, gp.StateType.ConcentrationPlasma))

# create the request body SummaryOutputRequest object using the simulation iteration keys for the run and simulation
available_iteration_keys = gastroplus.available_simulation_iteration_keys(RUN_NAME).simulation_iteration_keys
simulation_iteration_keys = [key.simulation_iteration_key_name for key in available_iteration_keys if key.run_name == RUN_NAME and key.simulation_name == SIMULATION_NAME]
request_body = gp.SummaryOutputRequest(simulation_iteration_key_names=simulation_iteration_keys)
# Get series data for a run and simulation iteration keys
series_data = gastroplus.run_series_data(
    RUN_NAME, plasma_concentration_series_descriptor, SIMULATION_NAME, request_body
)
Get the experimental data
# Get the list of series keys for all available observed data
available_observed_series = gastroplus.experimental_data_inventory().observed_series_keys
# Select the series key that corresponds 'Metroprolol' (the observed data group name we selected above)
obs_series_key = [series for series in available_observed_series if series.group_name == OBSERVED_DATA_GROUP_NAME and
                                                                    series.group_type == gp.ObservedDataGroupType.ExposureData and
                                                                    series.series_type == gp.ObservedDataSeriesType.UncertainConcentrationSeries][0]
obs_series_data = gastroplus.get_series_data(obs_series_key.group_name,
                                        obs_series_key.group_type,
                                        obs_series_key.series_name,
                                        obs_series_key.series_type).series_data.series_map[0].series_information
Plot the data using plotnine (ggplot)
from plotnine import ggplot, aes, geom_line, geom_point, labs, theme_classic

# Create dataframes from the retrieved simulation and observed data
simulation_df = pd.json_normalize(
    series_data.to_dict(),
    record_path=["series_data", "points"],
    meta=[["series_data", "independent_unit"], ["series_data", "dependent_unit"]],
)

observed_df = pd.json_normalize(
    obs_series_data.to_dict(),
    record_path="series",
    meta=["independent_unit", "dependent_unit"],
)

plot = (
    ggplot()
    + geom_line(
        simulation_df,
        aes(
            x="independent",
            y="dependent"
        ),
        color="#051082",
        size=1
    )
    + geom_point(
        observed_df,
        aes(
            x="independent",
            y="dependent",
        ),
        shape='s',
        color="#051082",
        size=2
    )
    + labs(
        title=f"{SIMULATION_NAME} Cp-Time Graph",
        x=f"Time ({simulation_df['series_data.independent_unit'].iloc[0]})",
        y=f"Concentration ({simulation_df['series_data.dependent_unit'].iloc[0]})"
    )
    + theme_classic()
)
plot.draw()