Tutorial: Controlled Release (CR)
With GPX™ it is possible to simulate the behavior of different dosage forms, including iv bolus, iv infusion, tablet, capsule, solution, suspension, and several forms of controlled release. We use the term controlled release to include similar terms used in the industry such as modified release (MR), delayed release (DR), and time release (TR).
This example shows how to design the controlled release profile to match the therapeutic window.
Step 1 = Run a single simulation with a controlled release profile
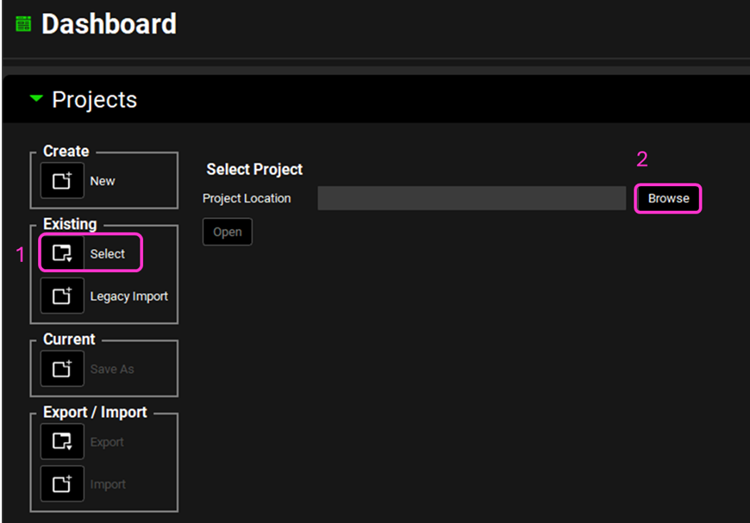
Open GPX™ and, in the Dashboard view, click on the icon next to Select to open an Existing project.
Click Browse and navigate to the C:\Users\<user>\AppData\Local\Simulations Plus, Inc\GastroPlus\10.2\Tutorials\Propranolol folder and select the project file Propranolol.gpproject by clicking on it and clicking Open.
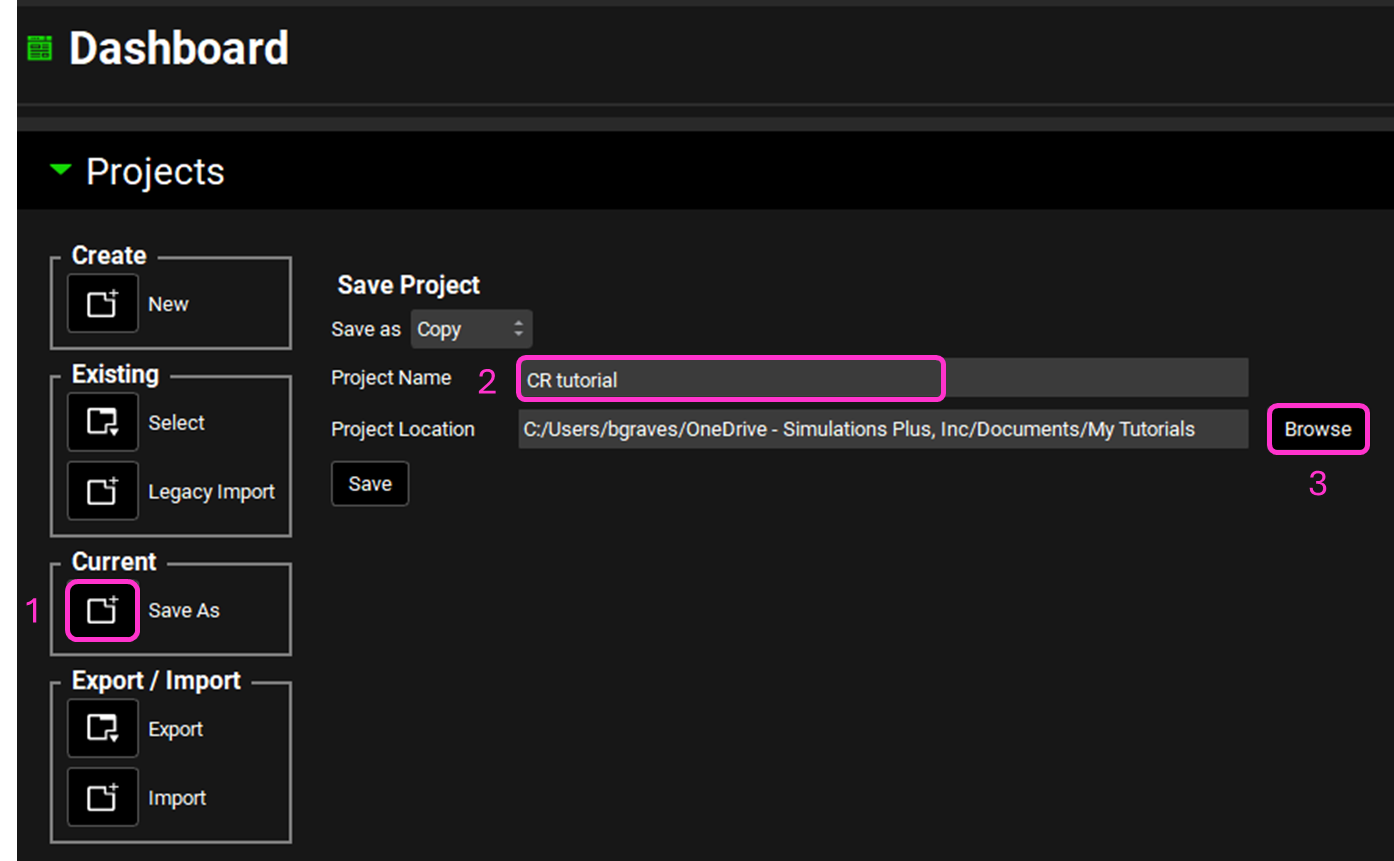
Now we will save a copy of the project to keep the original project unaltered. In the Dashboard view, click on the icon next to Save As under the Current frame. From the Save as drop-down, select Copy. Type “CR tutorial” as the Project name and click Browse to navigate to/add a folder to Save the project in. Click Save - you will see an information message in the Messages Center indicating that the project has been successfully copied. This message will disappear once you click 'Yes' on the pop-up window that also appears.
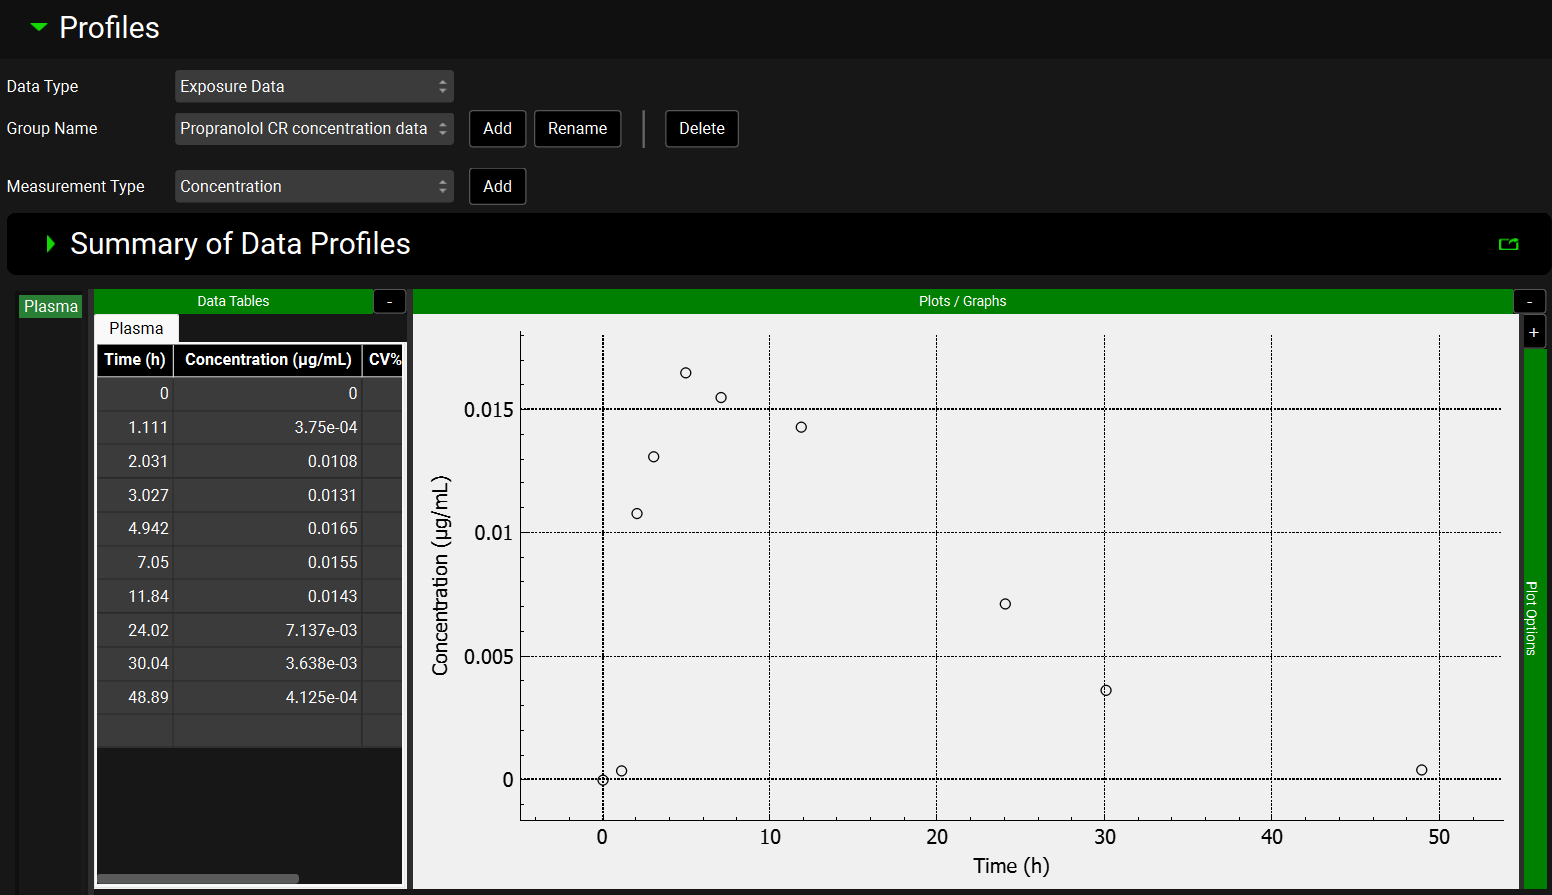
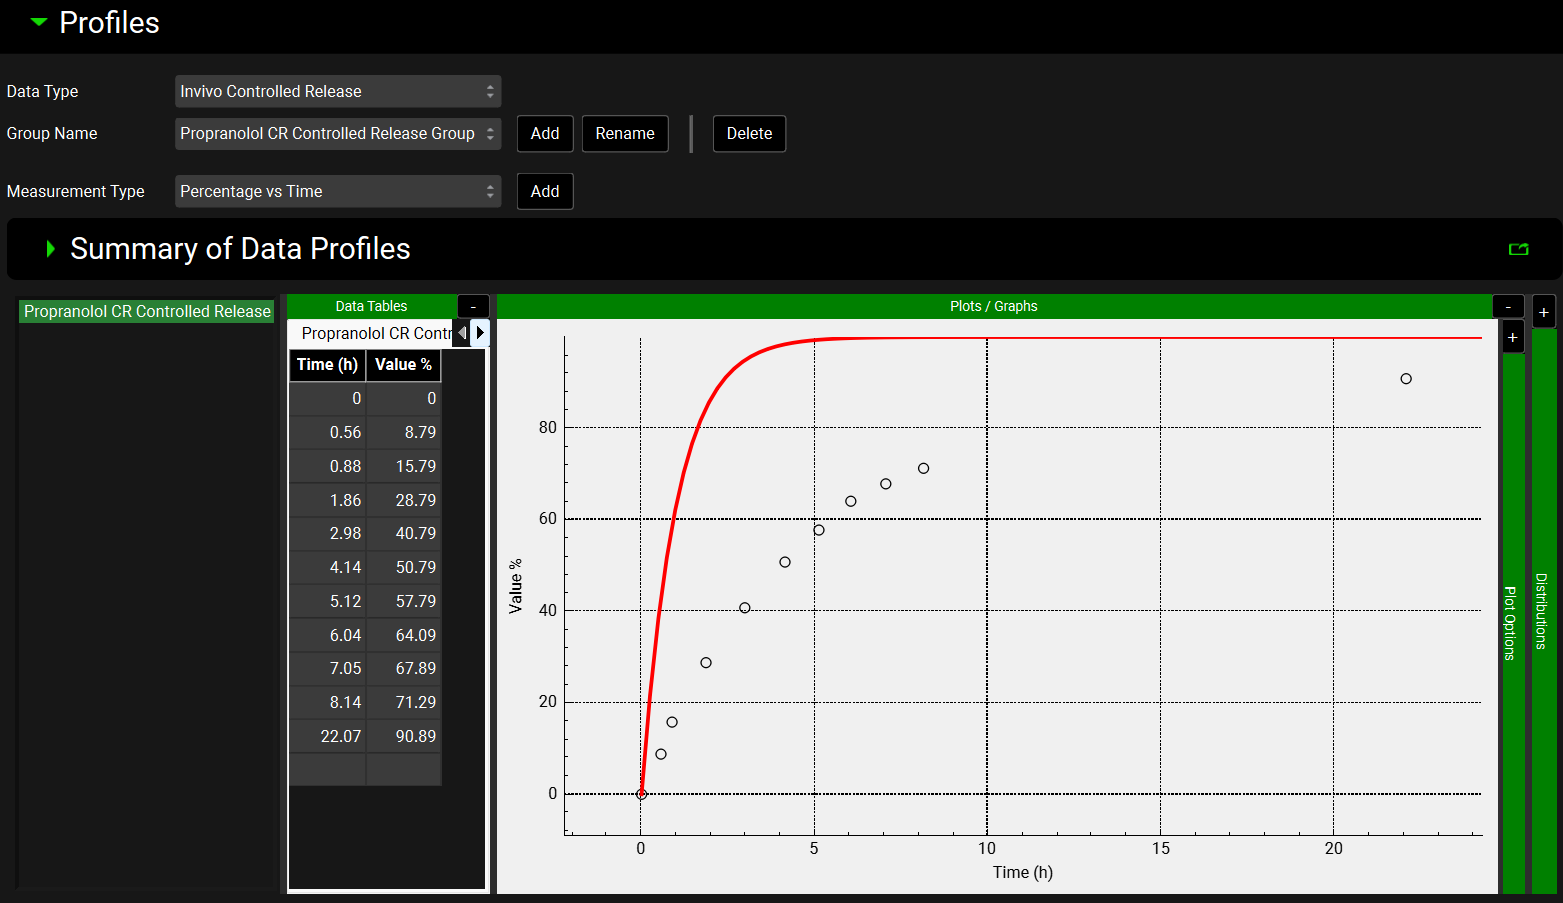
Click on the Observed Data View in the Navigation Pane and then review the Exposure Data and Controlled Release Data. This project contains the in vivo controlled release profile and the plasma concentration versus time profile.
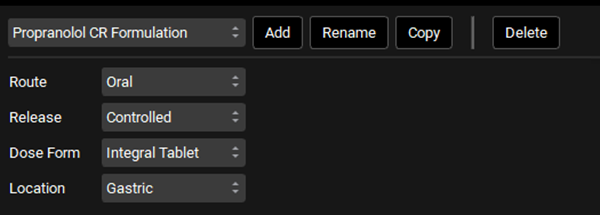
Click on the Dosing view in the navigation pane and review the Formulations panel. Ensure that the Dose Form is set to Integral Tablet and Release to Controlled. For Integral Tablet, all remaining unreleased material stays together and transits as a single unit through the compartments, releasing drug as it transits.
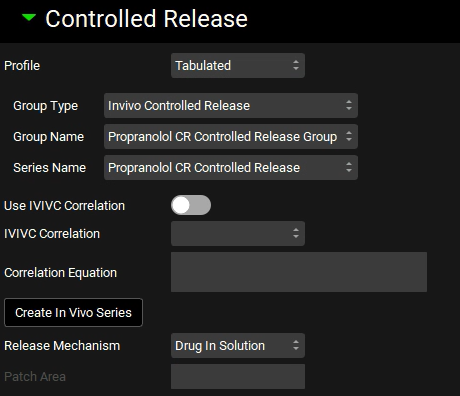
Open the Controlled Release panel, and set the Profile to Tabulated, Group Type to In Vivo Controlled Release, Group Name to Propranolol CR Controlled Release Group, Series Name to Propranolol CR Controlled Release, and Release Mechanism to Drug in Solution.
Click on the Physiologies view in the navigation pane and confirm that the Physiology has been set to Human-30YO-82Kg.
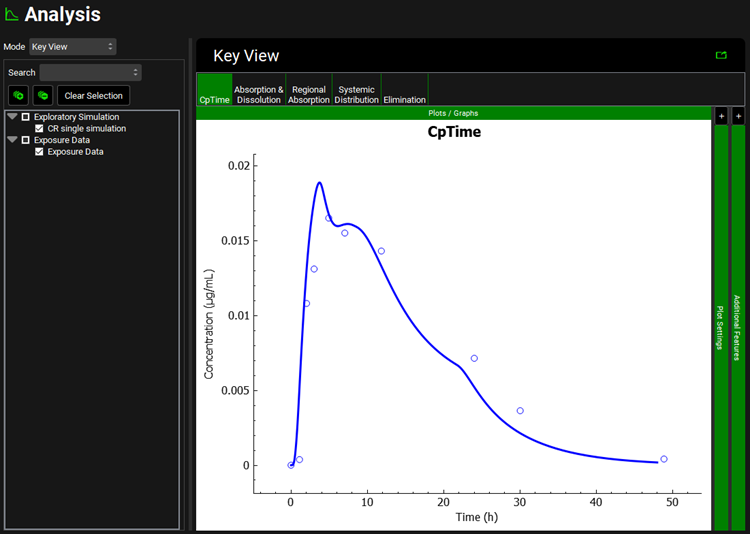
Click on the Simulations view in the navigation pane to confirm that the CR single simulation is selected. Click on Check Warnings and then Run Simulation to run a 48h simulation. When the simulation ends, the Cp-Time profile of Key View will be shown in the Analysis view.
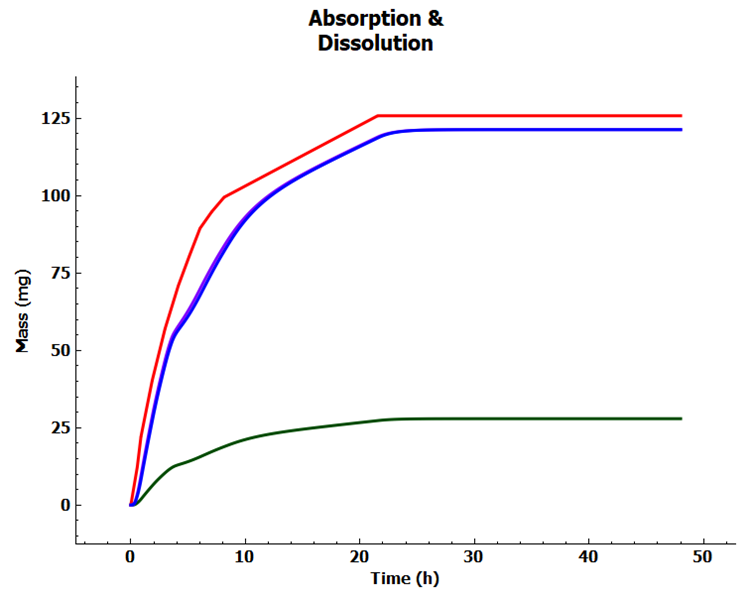
Now click on the Absorption & Dissolution plot in the Key View ribbon. The red line represents the in vivo dissolution profile.
Step 2 = Set up Multiple-dosing Simulation
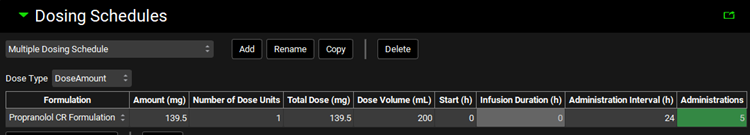
Go back to the Dosing view and expand the Dosing Schedules panel. Click Add to create a dosing schedule and name it “Multiple Dosing Schedule”. Set Amount to 139.5 mg, Dose Volume to 200 mL, Administration Interval to 24 h, and Administrations to 5.
Note: Since we have only one Formulation in this project, it will be automatically selected.
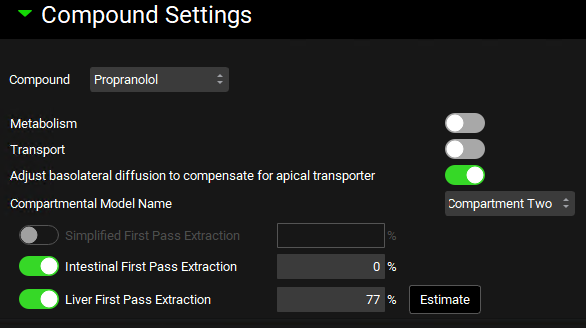
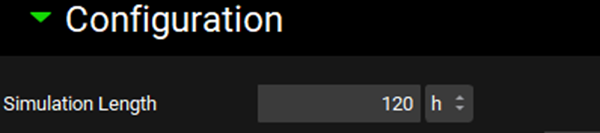
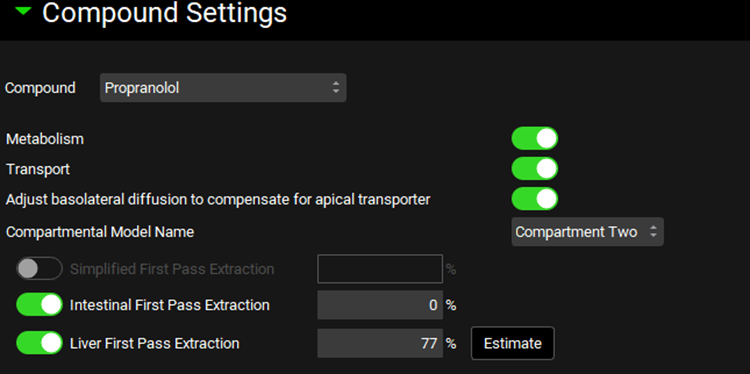
Navigate to the Simulations view and click Add to create a new simulation and name it “Multiple dosing simulation”. In the Drug Administration panel, set the Dose Schedule to Multiple Dosing Schedule. Expand the Compound Settings panel and set the Liver First Pass Extraction to 77%. Expand the Configuration panel and set the Simulation Length to 120 h.
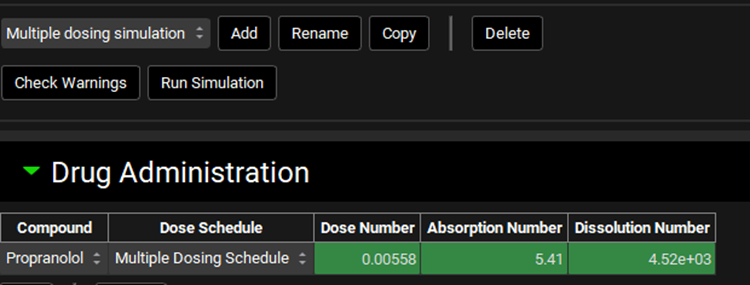
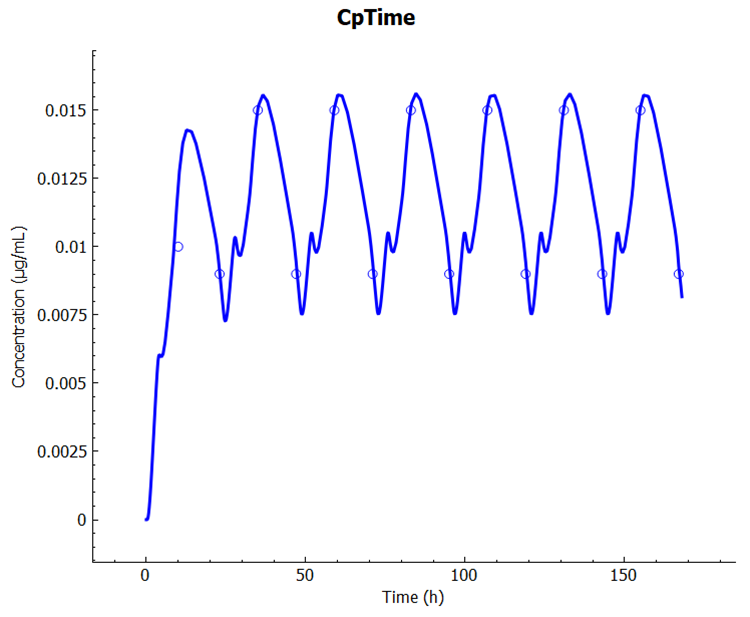
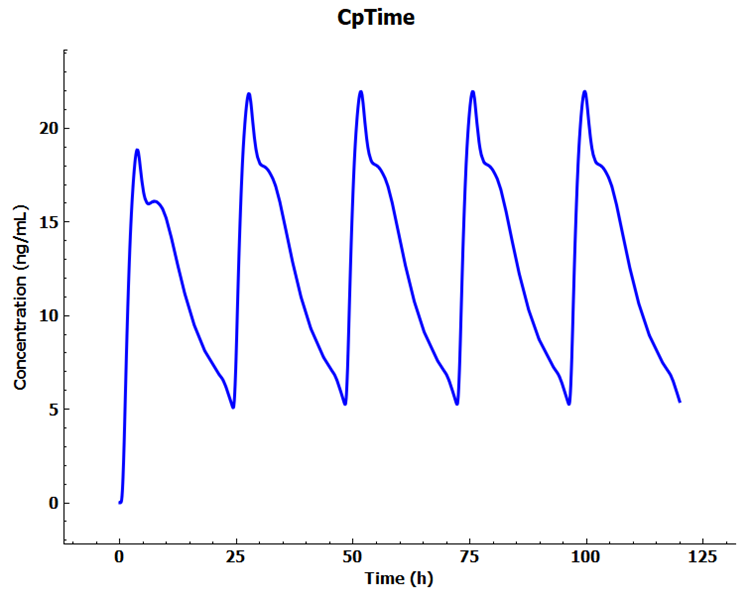
Click Check Warnings and then Run Simulation. When the simulation ends, examine the Cp-Time profile in the Cp-Time plot in the Analysis view. Note that we have achieved the “Steady-state”.
Step 3 = Design a controlled release profile to match the therapeutic window
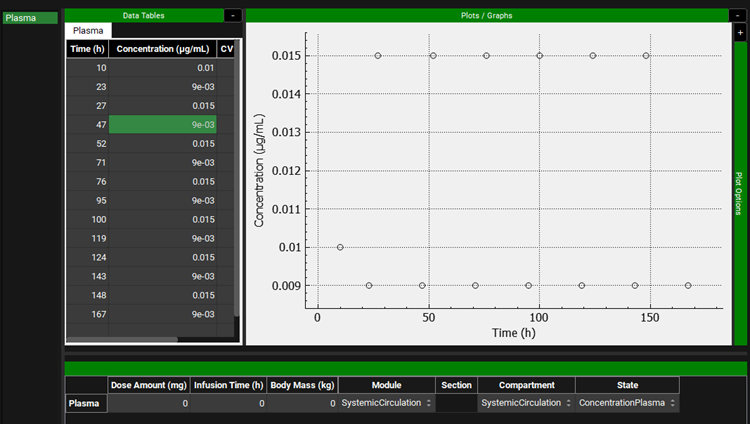
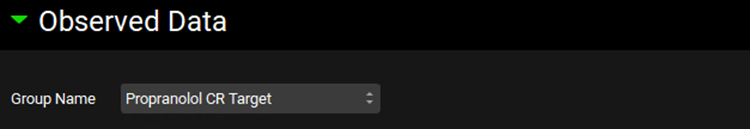
At this step, a new controlled formulation will be designed that can produce a mean plasma concentration of ~ 12 ng/mL with a lower peak to trough ratio. Go to the Observed Data view and select Exposure Data from the Data Type drop-down. Click Add to create the target Cp-Time profile as Exposure Data. Set Group Name to Propranolol CR Target and click OK (or press Enter). Select Concentration from the Measurement Type drop-down and click Add. Name as Series Plasma and click OK (or press Enter). These are artificial data points created to give the program a desired set of concentrations to use for optimizing the in vivo release rate.
Set the Concentration unit to ug/mL by clicking on the Concentration header and choosing the correct unit from the drop-down. You can copy the data from the excel file Target Concentration data.xlsx.
Scroll to the bottom of the graph and select SystemicCirculation from both the Module drop-down and Compartment drop-down.
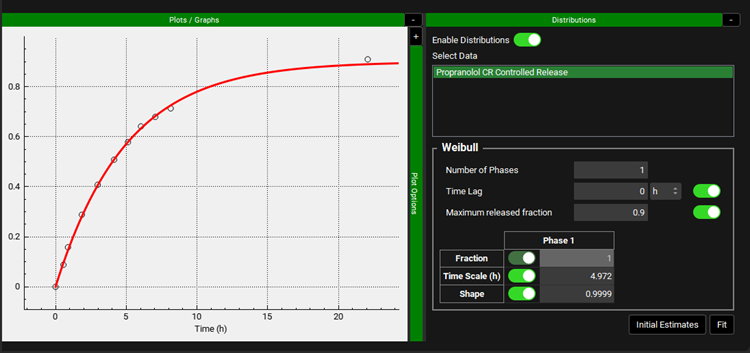
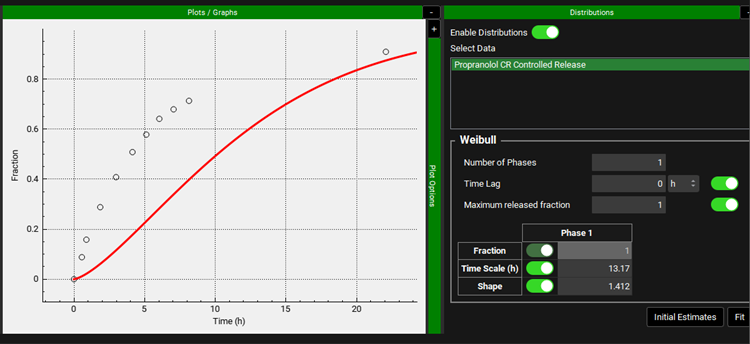
A Weibull function will be used to define the release rate. In the Observed Data view select In Vivo Controlled Release from the Data Type drop-down. The Propranolol CR Controlled Release Group will be automatically selected. Expand the Distributions panel by clicking on the “+” at the top of the bar. Make sure Propranolol CR Controlled Release is selected from the Select Data frame and click on Initial Estimates. Notice the values of Time Lag, Maximum released fraction, Time Scale, and shape change to create a curve that is closer to the observed in vitro dissolution profile. The program will optimize the Weibull parameters to match the target therapeutic window.
Click on the Dosing view in the navigation pane and in the Formulations panel click on Copy to create a new formulation “Propranolol CR Target”. Make sure the Release is set to Controlled and Dose Form to Integral Tablet.
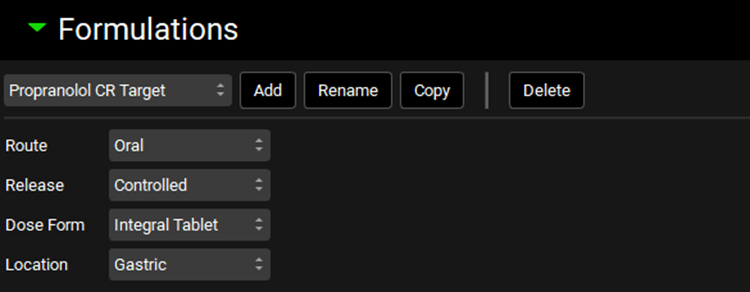
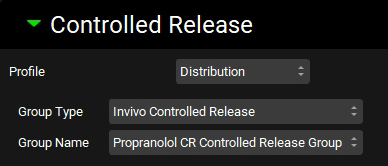
Open the Controlled Release sub-panel and make sure the Profile is set to Distribution.
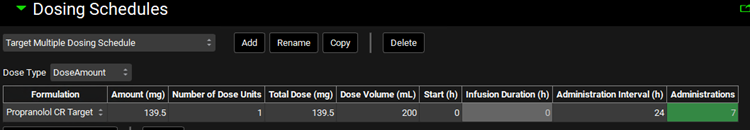
Scroll down to the Dosing Schedules panel, Copy the Multiple Dosing Schedule and name it “Target Multiple Dosing”. Set Formulation to Propranolol CR Target and ensure that Amount is 139.5 mg, Volume is 200 mL, and Administration Interval is 24 h. Then set Administrations to 7.
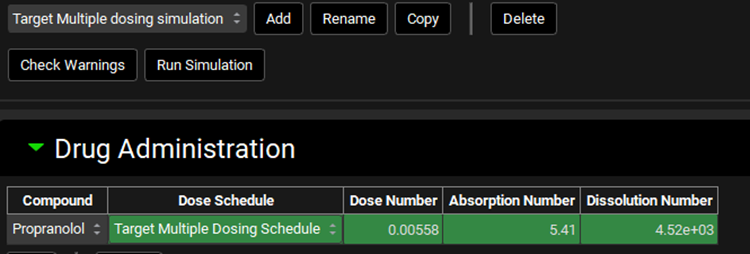
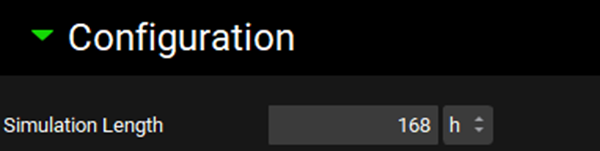
Navigate to the Simulations view and click Add to create a new a simulation and name it “Target Multiple dosing simulation”. In the Drug Administration panel, set the Dose Schedule to Target Multiple Dosing Schedule. Expand the Compound Settings panel and set the Liver First Pass Extraction as 77%. Scroll to the Observed Data sub-panel and set the Group Name to Propranolol CR Target. Expand the Configuration panel and set Simulation Length to 168 h.
If you have unlocked the optional module for Optimization, follow the directions in step 22, otherwise finish up this tutorial by following the directions in step 32.
Save the project and click OK.
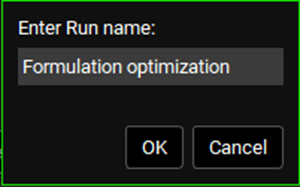
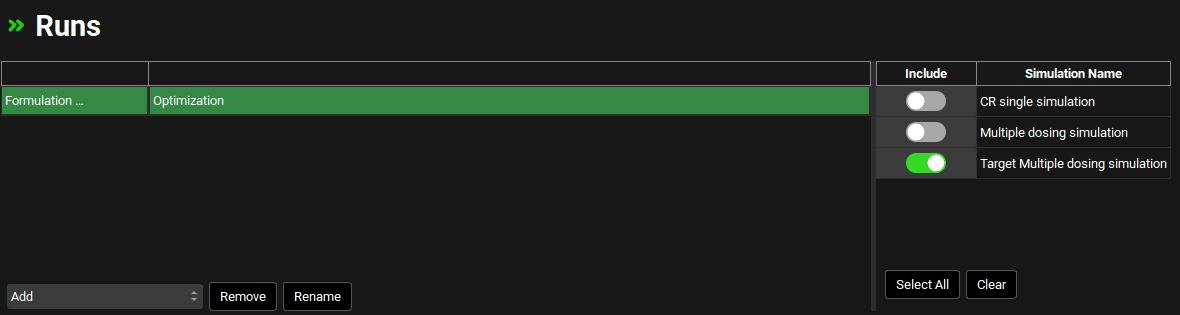
Click on the Runs view in the navigation pane and click on the Add drop-down. Select Optimization and name the Run Formulation optimization then click OK or press Enter.
Select the Optimization Run and click on the Include toggle next to the Target Multiple dosing simulation.
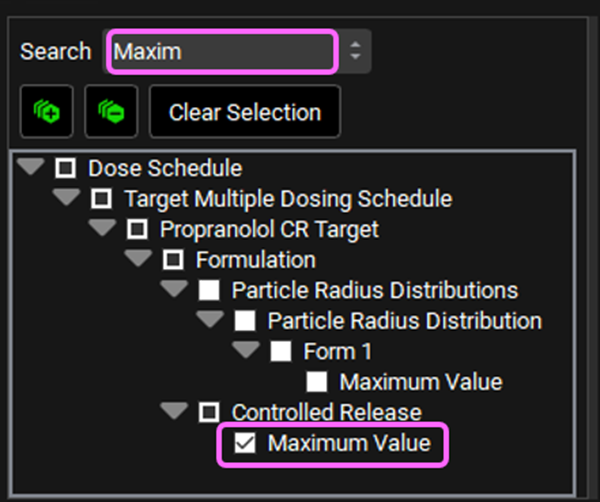
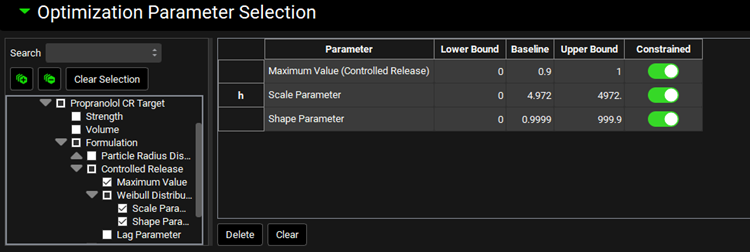
In the Optimization Parameter Selection sub-panel, type “Maxim” in the Search box and press Enter. Click on the checkbox next to Maximum Value under the Controlled Release Series.
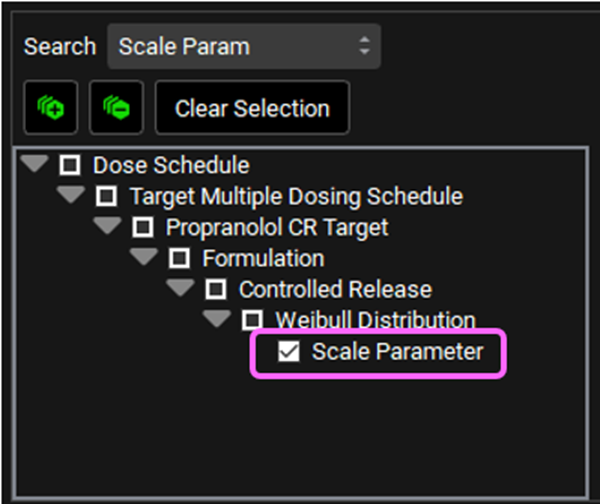
Delete the text in the Search box and type “Scale Param” and press Enter. Click on the checkbox next to Scale Parameter under Weibull Distribution.
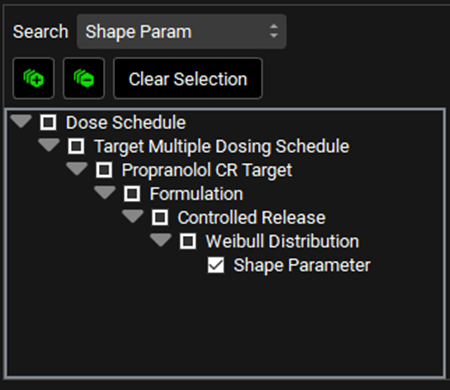
Delete the text in the Search box and type “Shape Param” and press Enter. Click on the checkbox next to Shape Parameter under Weibull Distribution.
The variables will appear in the Optimization Parameter Selection table.
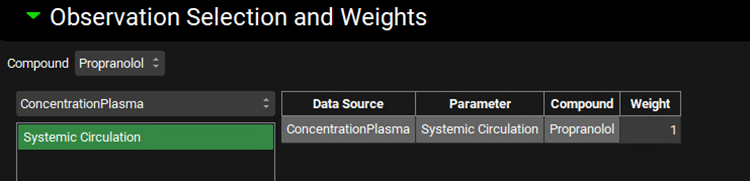
In the Observation Selection and Weights sub-panel, click on Systemic Circulation.
Then go to the Run Controls panel and click on Start. In the Run Controls pop-up window, watch the overall Rsq changes as the Weibull release parameters are adjusted to achieve the “Target” Cp-Time profile. This optimization will take a few minutes. You can stop the optimization when the step size is ~ 10-3.
The Optimization View will show the optimized values of each parameter. And the Series Optimization Results section will show the simulated Cp-Time profile compared to the target profile. Your result may be different depending on when you stopped the optimization and the solution the optimizer found.
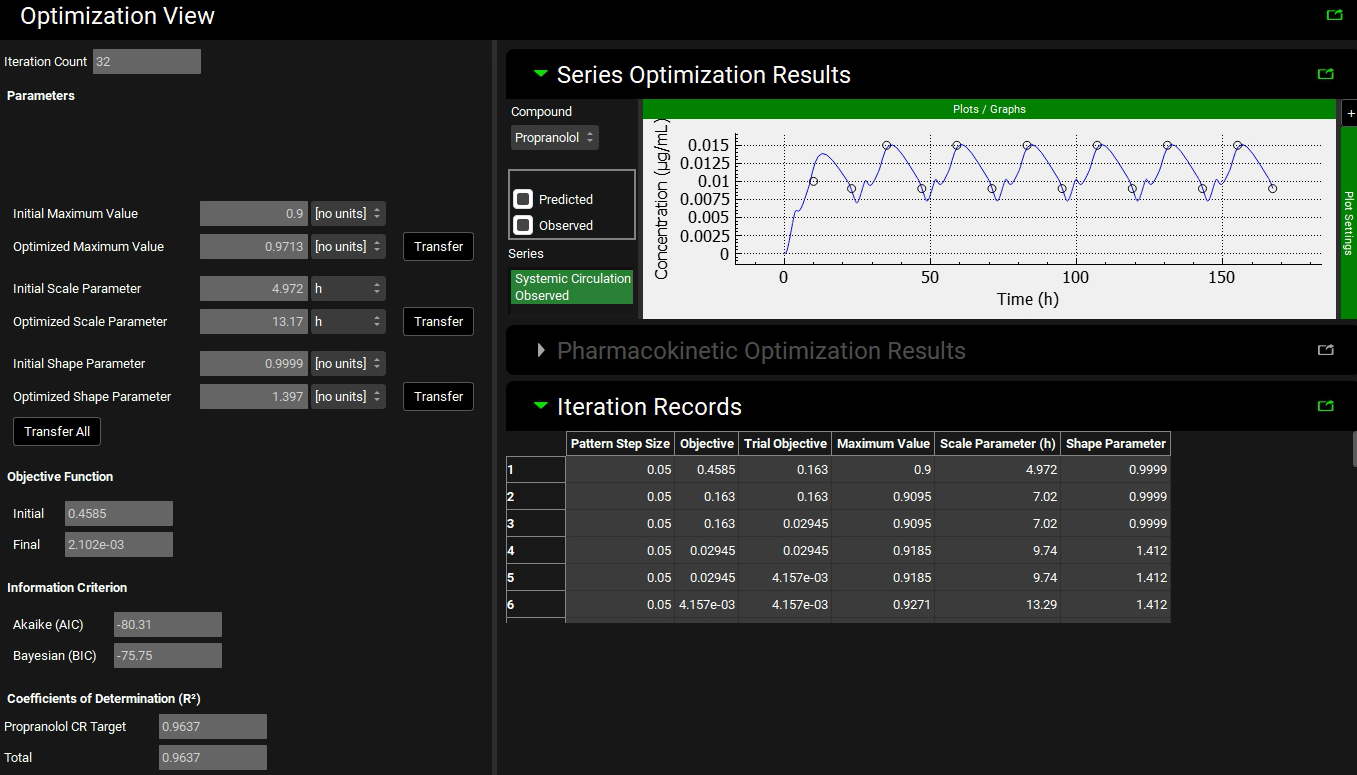
If you are happy with the results of the simulation, you can click on Transfer button for each parameter of the optimized release profile. Click Done to clear the message in the Message center.
If you don’t have the optimization license, you can go to the Observed Data view and set the Weibull function for the in vivo controlled released profile to the optimized values (Maximum Release Fraction to 1, Time Scale to 13.17 h, and Shape to 1.412).
Then go to the Simulations view and run a simulation for the Target Multiple dosing simulation. After the simulation finishes, Key View in the Analysis view will show the simulated Cp-Time profile with the release profile defined in the Weibull function.