
Tutorial: Enterohepatic Circulation (EHC)
In many cases, enterohepatic cycling of a compound has a significant influence on the drug’s kinetics. GastroPlus® provides a model for enterohepatic circulation (EHC) to better illustrate drug disposition after either oral or iv treatments. The model, when activated, extends the current gastrointestinal tract description through the addition of a gallbladder compartment.
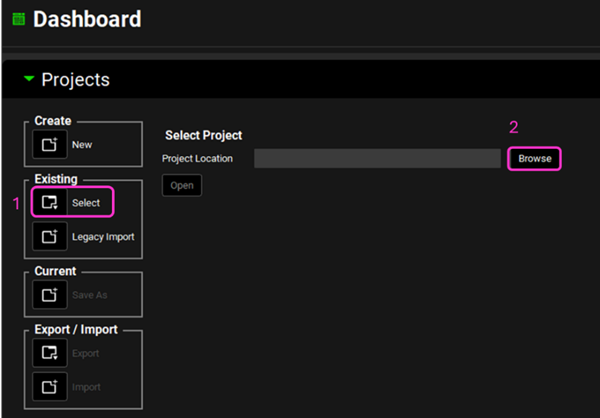
Open GPX™ and, in the Dashboard view, click on the icon next to Select to open an Existing project.
Click Browse and navigate to the C:\Users\<user>\AppData\Local\Simulations Plus, Inc\GastroPlus\10.2\Tutorials\GPX EHCSamples folder and select the project file GPX EHCSamples.gpproject by clicking on it and clicking Open.
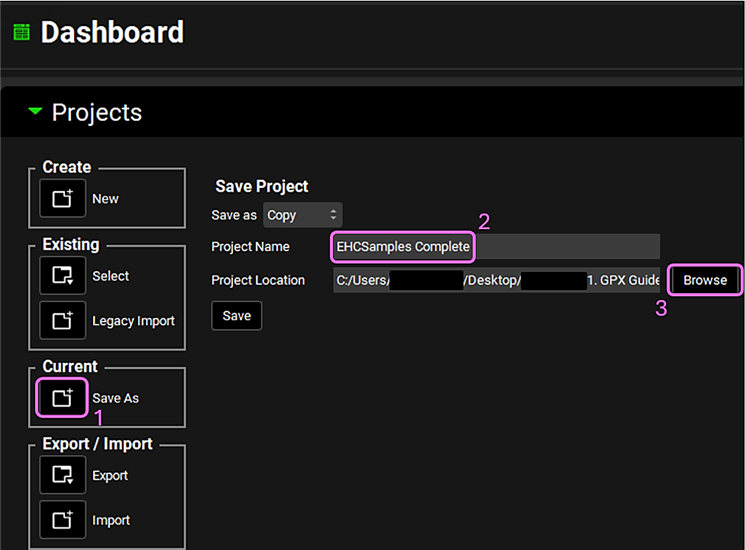
Save a copy of the project by clicking on the icon next to Save As, entering “EHCSamples Complete” as the Project Name and click Browse to navigate to/add a folder to Save the project in. Click Yes on the information window that appears and the message from the Messages Center indicating that the project has been successfully saved will disappear once clicking on Yes. Note that the name of the project visible in the top right corner of the interface is the one that has just been created.
Move through the views on the navigation pane from Observed Data to Simulations, observing the information that has been entered in this project. This project contains three compounds, and we will use the compound Ezetimibe in this tutorial example.
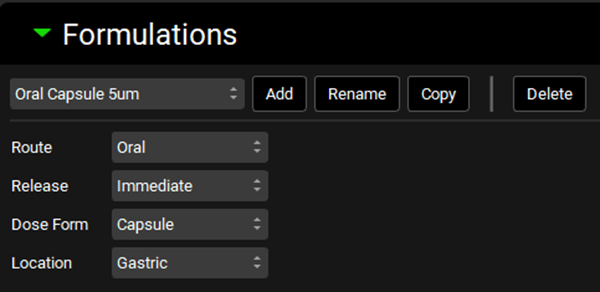
Go to the Dosing view and expand Formulations panel by double-clicking the panel header or clicking on the green arrow.
Select the Oral Capsule 5um and note how the Route is set to Oral and the Dose Form is set to Capsule.
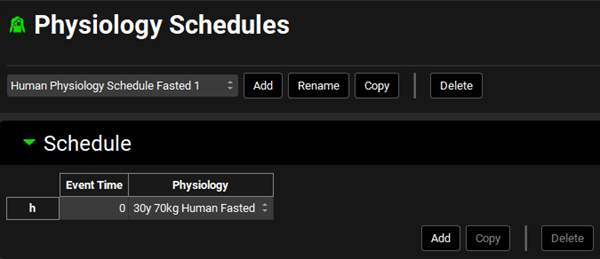
Navigate to the Physiology Schedules view. Select Human Physiology Schedule Fasted 1 from the Physiology Schedules drop-down. Notice how this physiology is linked to a single event with a fasted physiology.
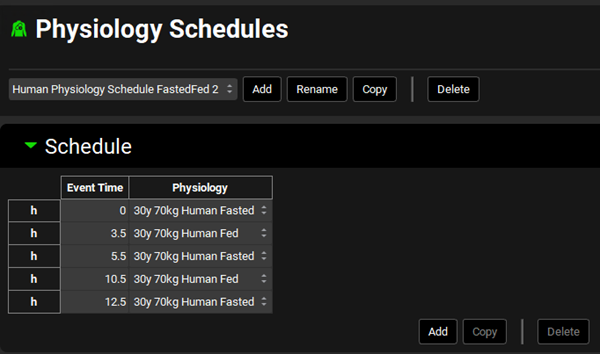
Now select the Human Physiology Schedule FastedFed 2 schedule from the drop-down. This physiology schedule is composed of 5 events switching between Fasted and Fed physiologies according to the mealtimes.
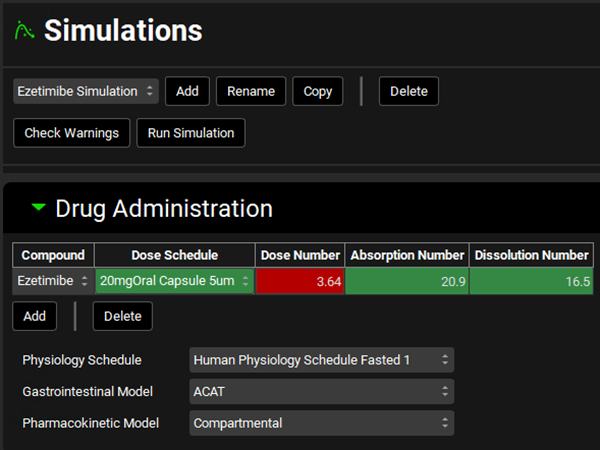
Navigate to the Simulations view and from the Simulations drop-down select the Ezetimibe Simulation if it is not already selected.
In the Drug Administration panel, you will see that the Human Physiology Schedule Fasted 1 Physiology Schedule is selected.
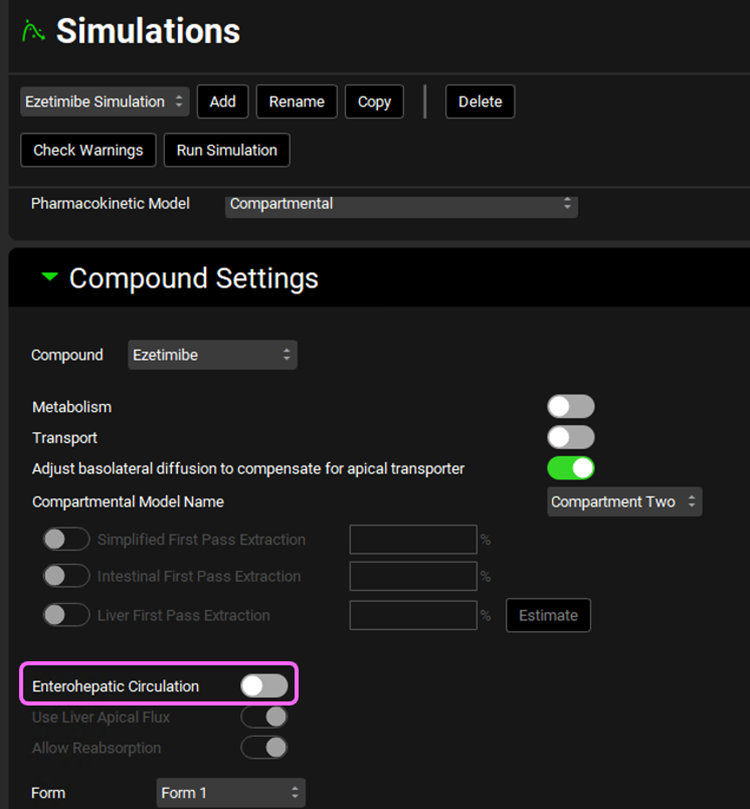
Expand the Compound Setting panel by double clicking on the panel header or clicking on the green arrow. Notice how the Enterohepatic Circulation is turned off.
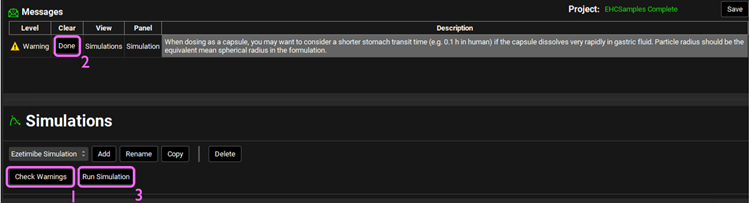
The Simulations Length for this simulation is 72h, which can be viewed in the Configuration panel. Click on Check Warnings at the top of the Simulations view. Click Done to dismiss the message about stomach transit time when dosing a capsule since we will not adjust the stomach transit time to 0.1h for this simulation. Then, click Run Simulation.
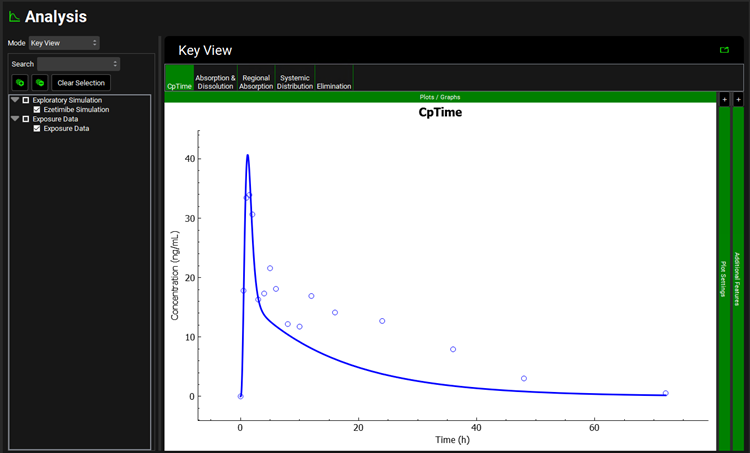
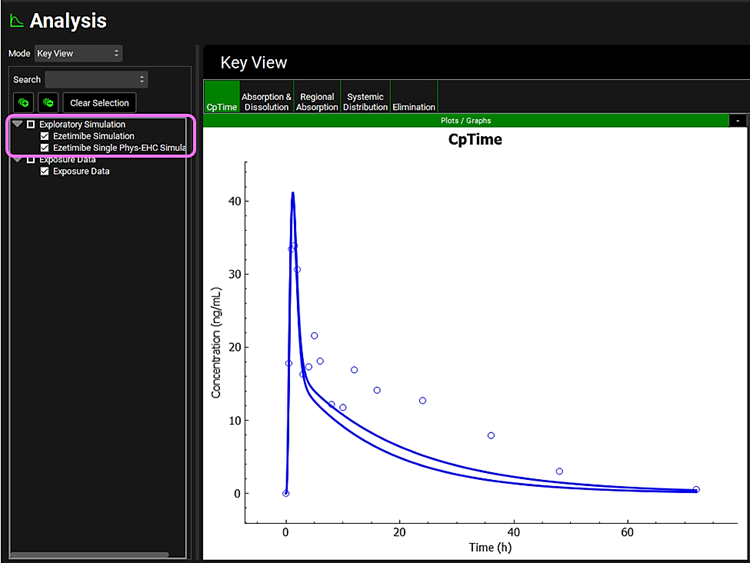
Once the simulation finishes, the program switches automatically to the Analysis view. The Cp-Time plot will be displayed in the Key View mode.
We will now incorporate EHC. Navigate to the Physiologies view and make sure that the Ezetimibe compound is selected. Select 30y 70kg Human Fasted from the Physiology drop-down. Expand the Bile (Enterohepatic Circulation) panel by double clicking the panel header or clicking on the green arrow. Set the Biliary Clearance Fraction to 0.85.
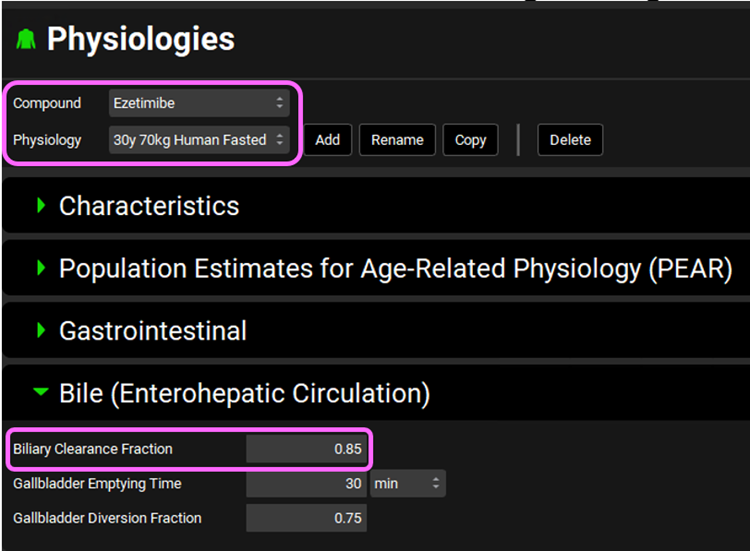
The Biliary Clearance Fraction corresponds to the fraction of drug removed by general clearance that is excreted into the bile.
Gallbladder Emptying Time refers to the time required for 90% of the gallbladder contents to empty into the duodenum after a meal (default value = 30 minutes).
The Gallbladder diversion fraction is the fraction of drug in the bile that is stored by the gallbladder (default value = 0.75).
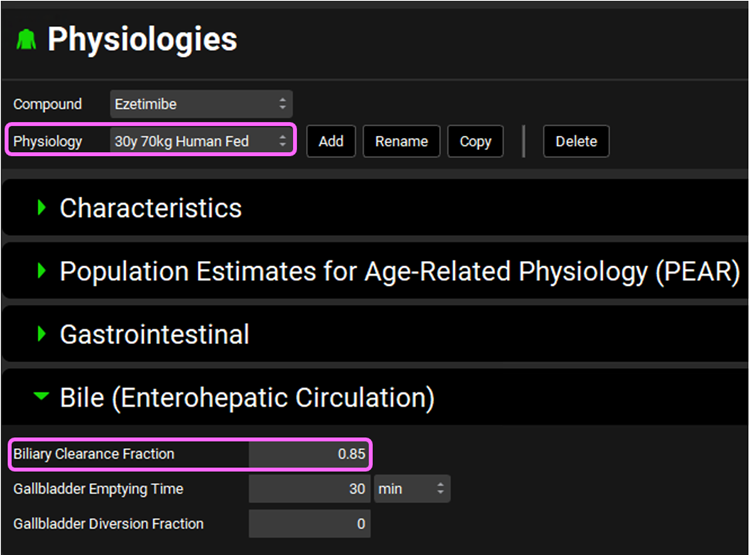
We also need to change it for fed physiology. To do that, change the Physiology to 30y 70kg Human Fed and set Biliary Clearance Fraction to 0.85.
Save the project and click OK.
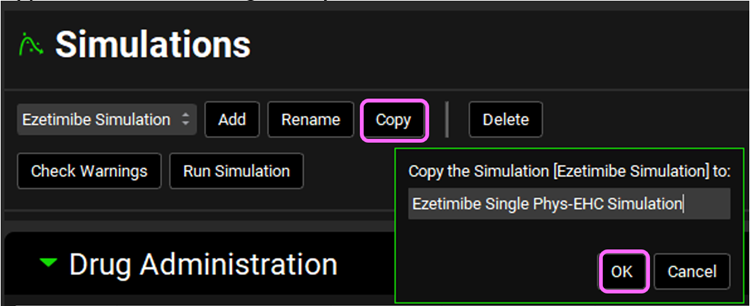
Navigate to the Simulations view. Select the Ezetimibe Simulation if not already selected and click Copy. Type “Ezetimibe Single Phys-EHC Simulation” in the dialog box and click OK or press Enter.
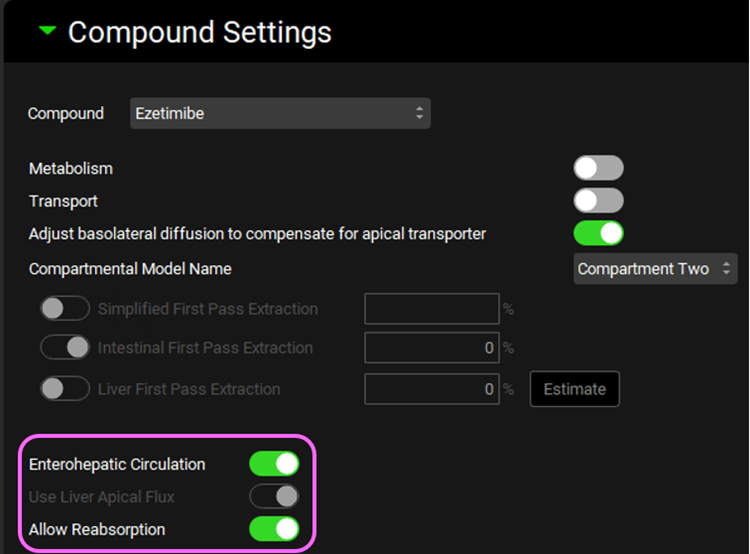
Expand Compound Settings panel and select the Enterohepatic Circulation toggle. This will automatically turn on Allow Reabsorption which we will keep selected.
Click on Check Warnings at the top of the Simulations view. Click Done to dismiss the message about stomach transit time when dosing a capsule. Then, click Run Simulation.
Once the simulation finishes, the program switches automatically to the Analysis view. The Cp-Time plot will be displayed in the Key View mode. On the left-hand side, select the Ezetimibe Simulation to compare both simulations.
Expand the Plot Settings panel on right-hand side of the plot by clicking on the “+” at the top of the bar. Select one of the simulated profiles on the plot to highlight it on the legend. Hover over the Plot Name in the Plot Setting panel to display the full name.
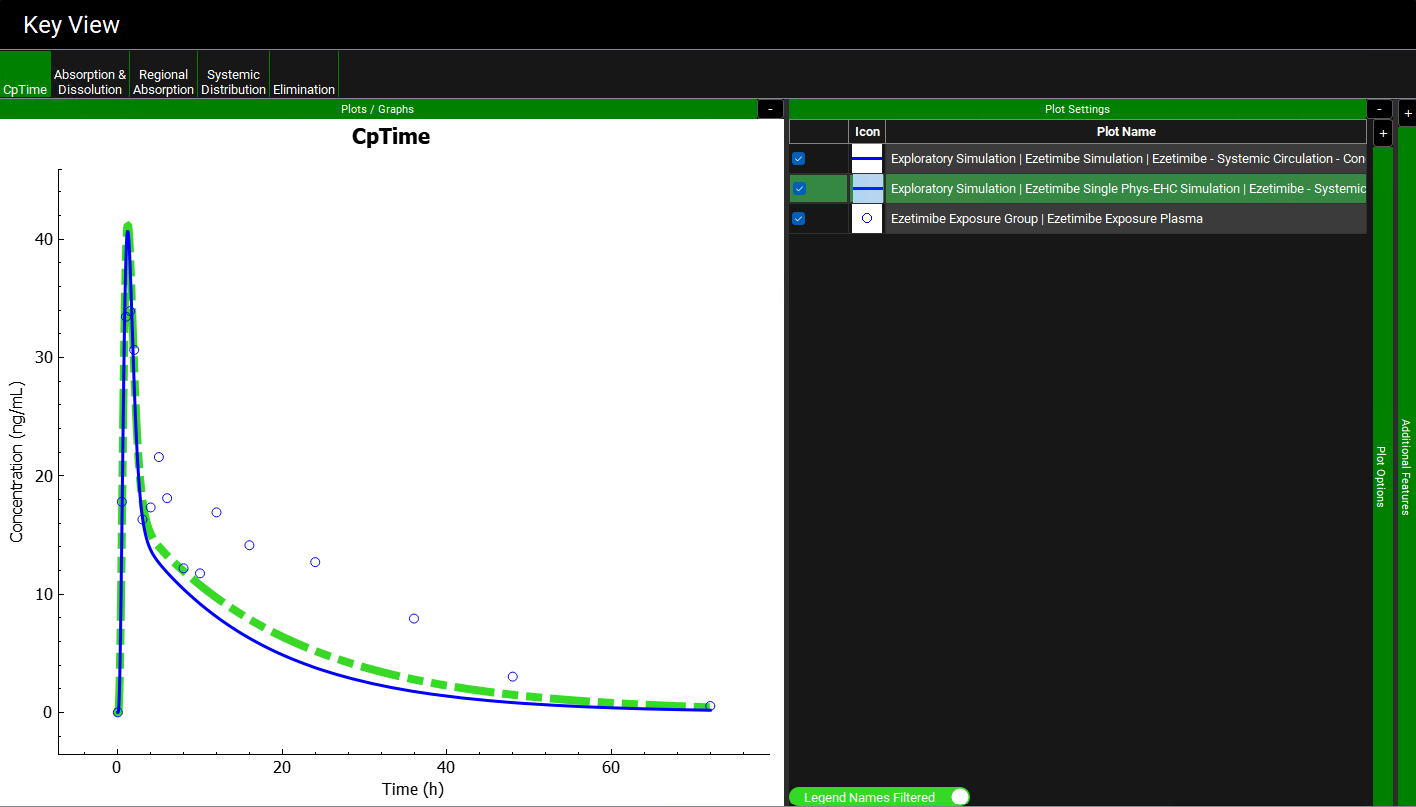
Notice on the Cp-Time profile with EHC on is higher than before (dashed green), but that it fails to capture the observed secondary peaks occurring at 5 and 12 hours. This is due to lack of release of the drug stored in the gallbladder that would normally be released with consumption of a meal.
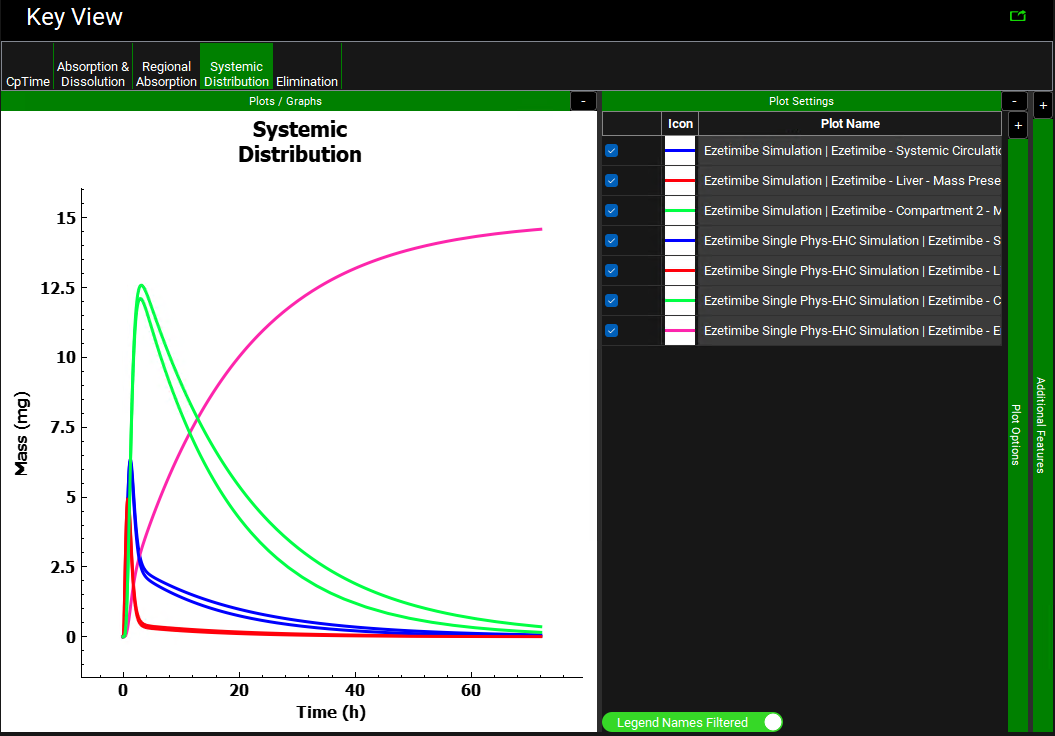
Click on the Systemic Distribution plot in the Key View ribbon. Notice how the amount of drug in the gallbladder versus time (pink curve) is displayed only for the Ezetimibe Single Phys-EHC Simulation (with EHC on). As the simulation proceeds, the gallbladder continually stores more drug from the bile, but it does not release the drug.
Unselect the Ezetimibe Simulation from the simulations list on the left-hand side of the Analysis view and click on the Regional Absorption plot from the Key View ribbon.
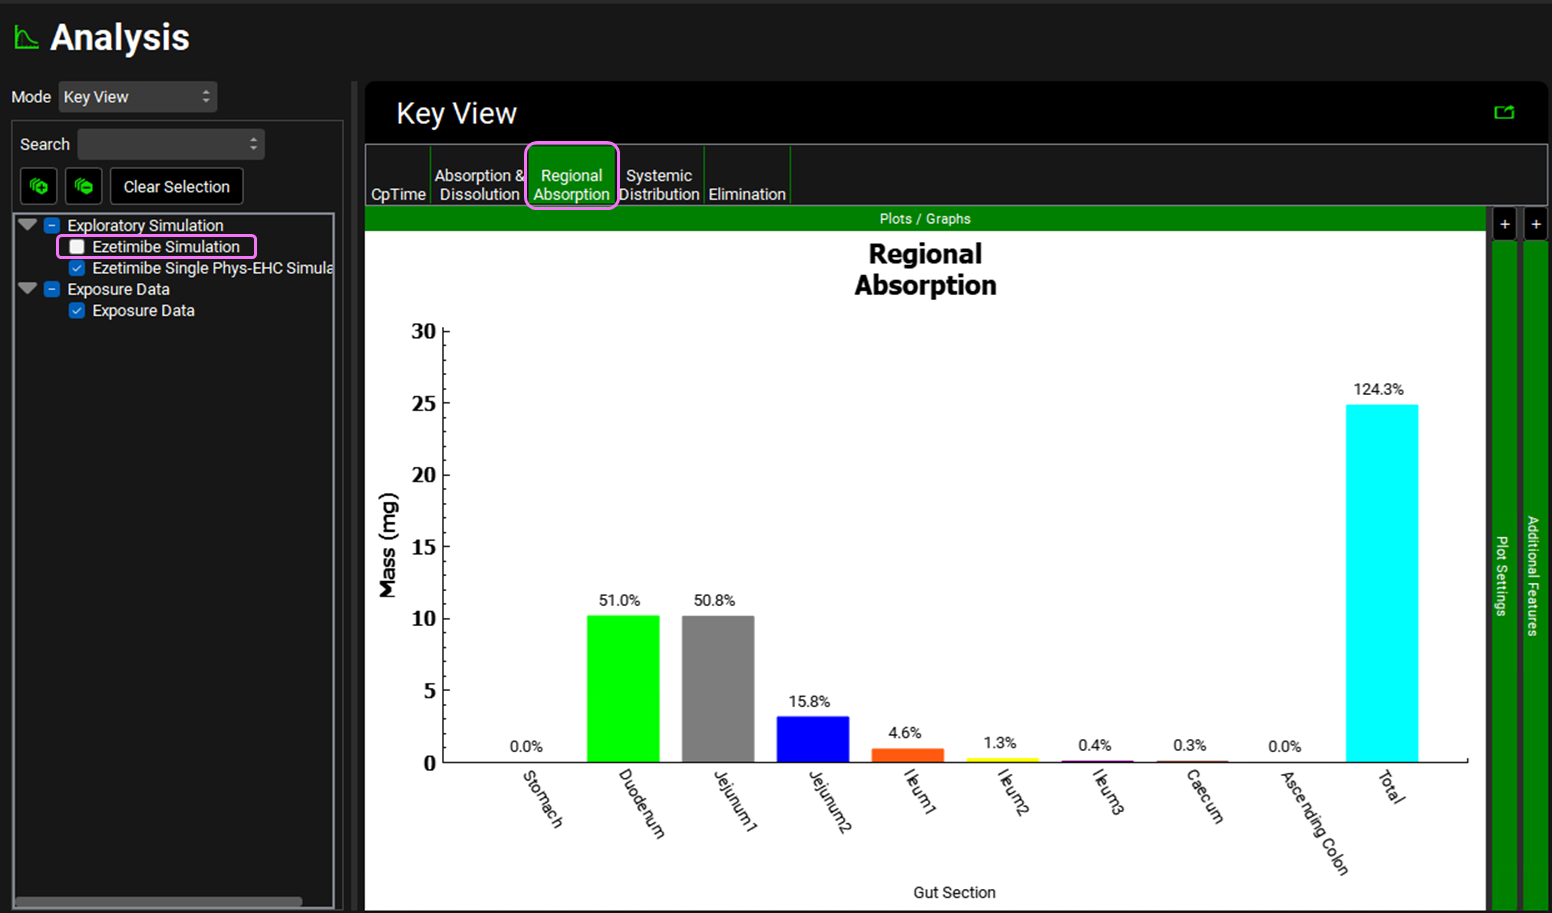
Notice that the Total % Absorbed is ~ 124%. This value reflects absorption, biliary clearance, and reabsorption of drug (due to EHC) over the simulation period and can therefore be > 100% (some of the drug is absorbed more than once).
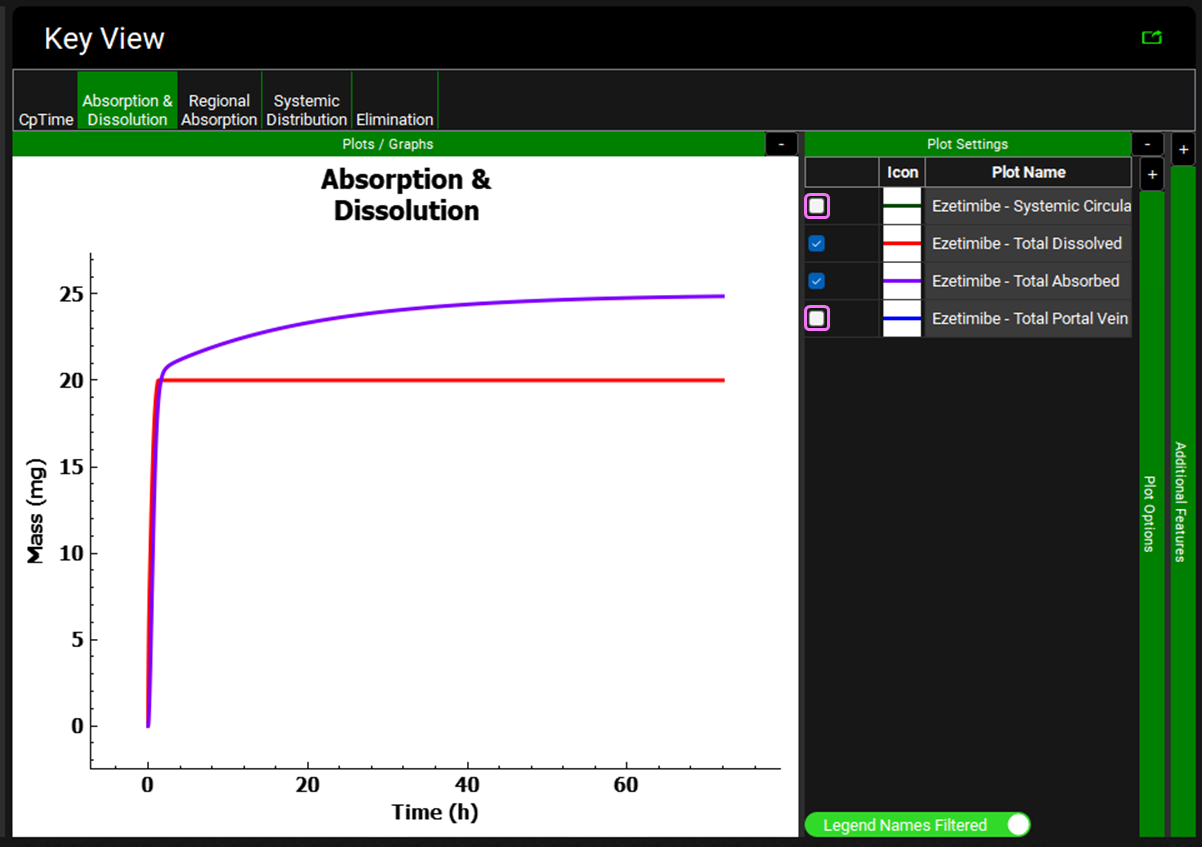
Click on the Absorption & Dissolution plot. On the right-hand side, unselect the Systemic Circulation – Mass Entered (green) and Total Portal Vein (blue) plots so that only the Total Absorbed (purple) and Total Dissolved (red) plots are displayed. Notice that the dissolution reaches 20 mg (total dose) and is then flat, indicating that the entire 20 mg dose is in solution. But the absorption plot goes above 20 mg and continues to rise slowly all the way to 72 h. This is because EHC is causing a small part of the biliary clearance fraction to recirculate continuously while most of it is being stored in the gallbladder.
The multiple secondary peaks evident in the experimental data correspond to the approximate time of meals, suggesting that Ezetimibe is released with bile into the lumen of the gastrointestinal tract as a result of gallbladder emptying with food. To simulate a meal and activate the fed state physiological values, you must use physiology schedule that represent those states.
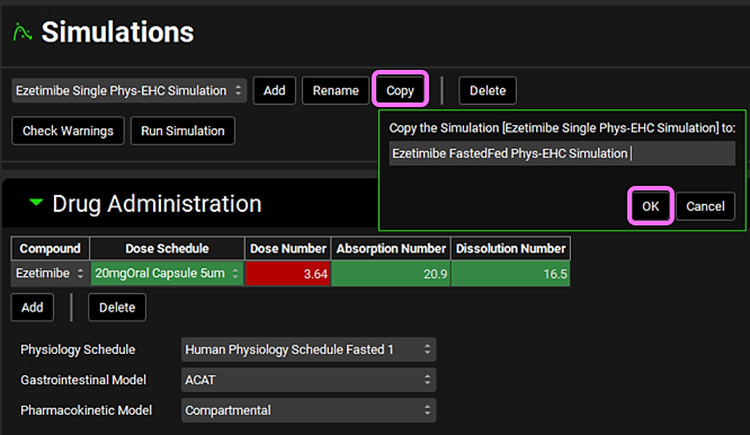
Navigate to the Simulations view and copy the Ezetimibe Single Phys-EHC Simulation. Name the simulation Ezetimibe FastedFed Phys-EHC Simulation and click OK.
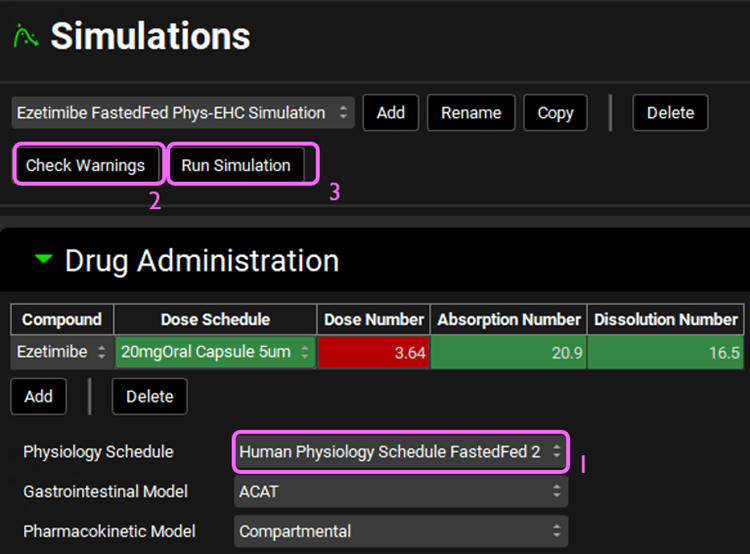
Expand the Drug Administration panel and set the Physiology Schedule to Human Physiology Schedule FastedFed2. Click on Check Warnings at the top of the Simulations view. Click Done to dismiss the message about stomach transit time when dosing a capsule. Then, click Run Simulation.
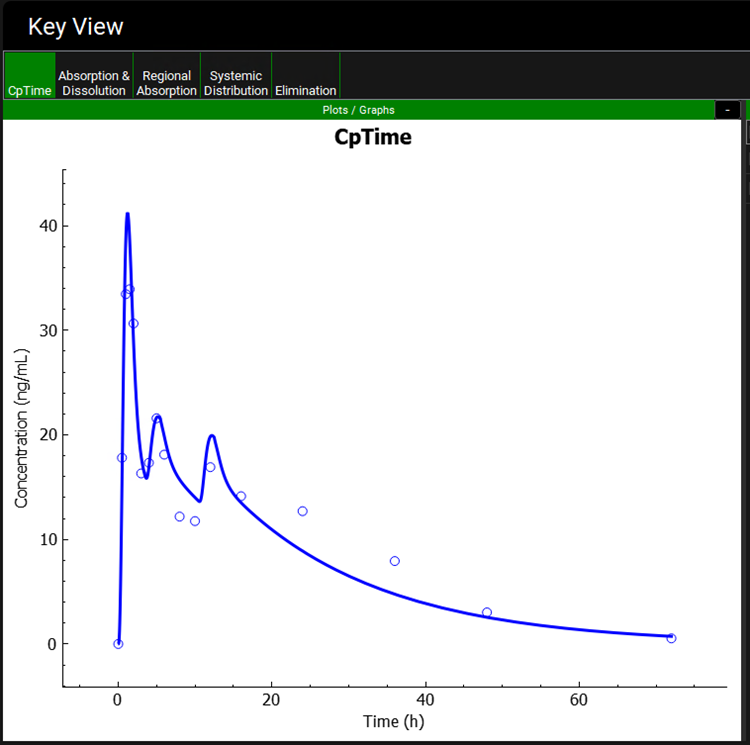
Once the simulation finishes, the program switches automatically to the Analysis view. Select the Cp-Time plot if not already selected. The Cp-Time plot now displays two secondary absorption peaks at 5 and 12 hours.
Click on the Regional Absorption plot and note the Total % Absorbed ~ 183%. This indicates that over 36 mg was absorbed, so that approximately 16 mg of the original 20 mg dose was recirculated and reabsorbed during 72 h. The later peaks correspond to the release of drug from the gallbladder into the duodenum (and subsequent reabsorption) at the two mealtimes specified in the physiology schedule.
Next click on the Systemic Distribution plot and expand the Plot Settings panel if not already expanded. Uncheck Liver – Mass Present (red) and Compartment 2 – Mass Present (green) (hover over the Plot Name to see the full name).
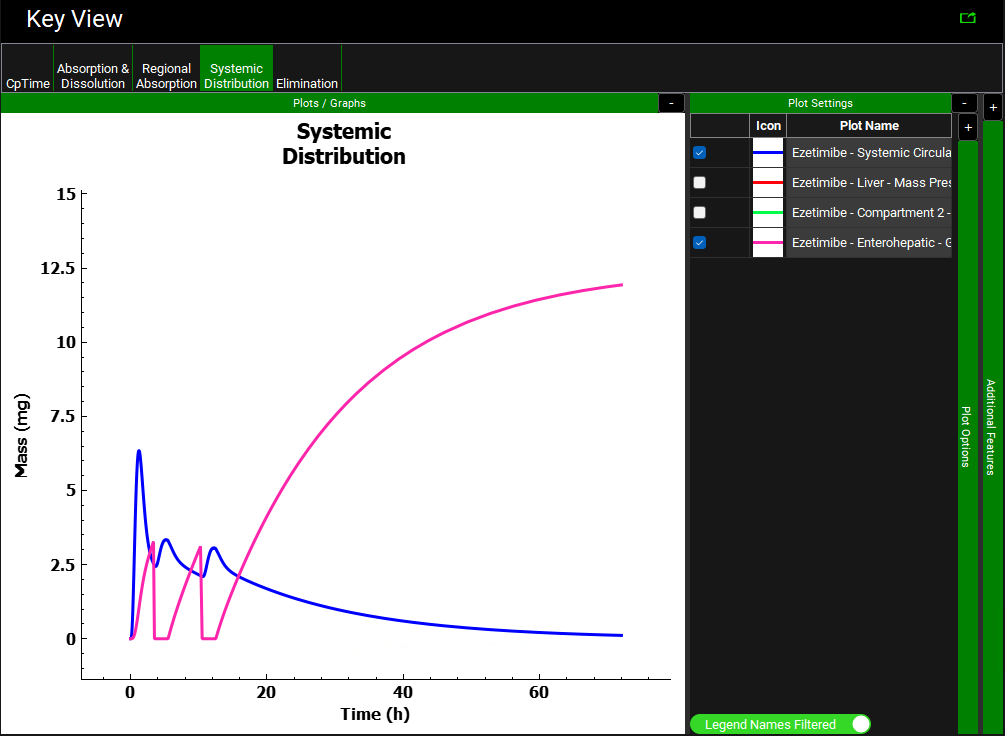
Notice the gallbladder drug content increases from the onset of the simulation, and then decreases starting around 3.5 hours. The gallbladder drug content remains low during the fed-state period (2 hours), and then increases once the subject returns to the fasted state (indicated in the Ezetimibe Physiology Schedule FastedFed). This pattern continues for as many meals as the user has included.