
Tutorial: Ionization Effects in GastroPlus®
If a compound has one or more ionizable groups, both the permeability and the solubility of the compound vary with pH (in general, solubility increases with ionization while passive diffusion permeability decreases). This significantly affects compound absorption from the GI tract, where the pH can vary from 1.3 or less in the stomach to 7.4 in the ascending colon. GastroPlus® has proprietary equations that calculate the solubility vs. pH and logD vs. pH profiles of your compound based on the solubility at a particular pH, the logD (or logP for the neutral species) at a particular pH, and the pKa(s) of the compound. In this tutorial the permeability, solubility, solubility factor, and pKa of miconazole will be changed to determine their effect on pharmacokinetic (PK) parameters. Assets containing these parameters will be created and the simulations will be compared side-by-side.
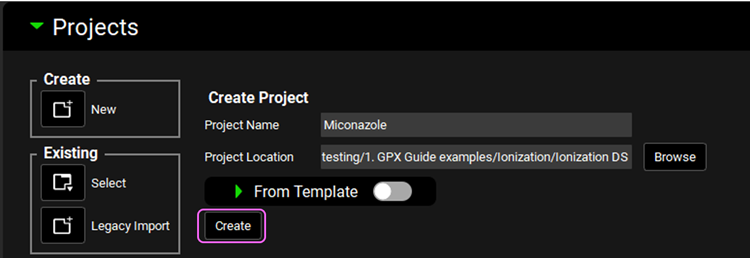
Open GPX™ and, in the Dashboard view, click on the icon next to New to Create a new project.
If you do not have access to the ADMET Predictor® module then click the Select button in the Dashboard View, click the Browse button and navigate to the C:\Users\<user>\AppData\Local\Simulations Plus, Inc\GastroPlus\10.2\Tutorials\Ionization Effects folder and select the “Miconazole.gpproject”. Skip to Step 21 below, for Step 22, the correct solubility has already been entered in this project.
Enter Miconazole for the Project Name and then click Browse and navigate to the folder in which you wish to save the project, click on Select folder.
Click the “Create” button in the Dashboard.
The formulation, dose, and physiology need to be created before a compound can be imported.
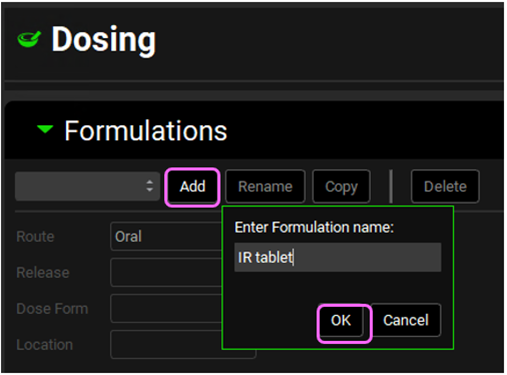
Navigate to the Dosing view in the navigation pane and expand the Formulations panel by either clicking on the green arrow or double clicking in the panel header bar. Click the Add button, the Enter Formulation name dialog box will appear. Enter “IR Tablet” for the formulation name and then click OK or press Enter.
Expand the Dosing Schedules Panel and click the Add button.
Enter “IR Tablet 500mg” for the Dosing Schedule name and click OK.
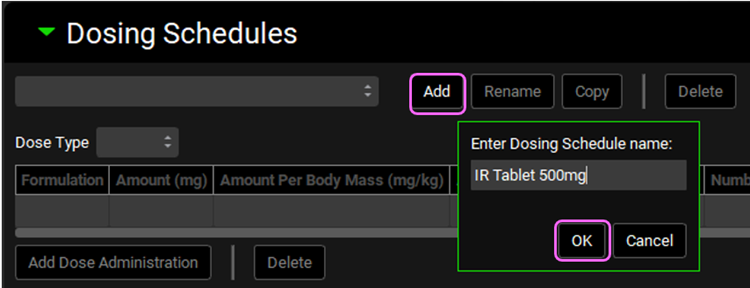
An entry will be created in the Dosing Schedules table. Change the Amount (mg) from the default value of 100 to 500.

Navigate to the Physiologies view in the navigation pane.
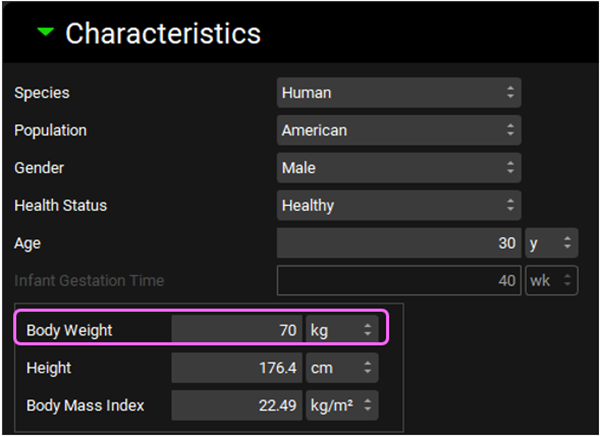
Click on the Add button. The Enter Physiology name dialog box will appear, type “Human Male 30YO 70kg” and ensure the Human is selected as Species, then click OK or press Enter.
Change the “Body Weight” to 70 kg.
Save the project then click OK.
The structure of miconazole will be imported into GPX™ using the ADMET Predictor® module. Machine learning models are used to predict parameters e.g., solubility, pKa, logD, that are used in the PK simulations.
Click on Compounds view in the navigation pane.
Click on the AP Import button next to Add to access the ADMET Predictor® module.
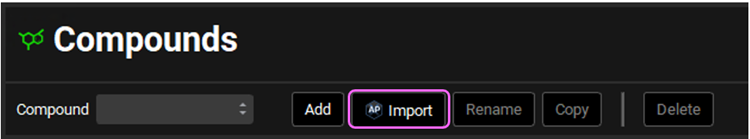
An alternate way to access ADMET Predictor® is to click on “ADMET Predictor®” in the Modules pane on the right-hand side of the interface.
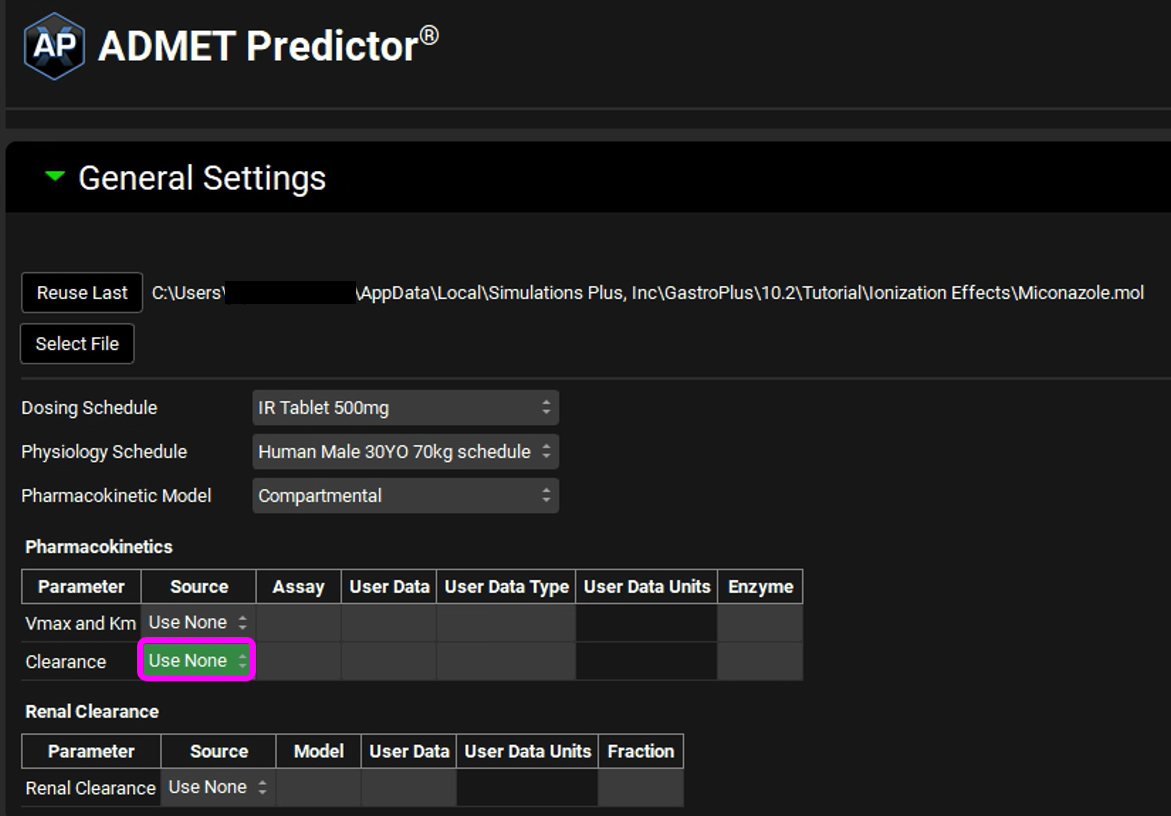
On the ADMET Predictor® view, click on the Select File button under General Settings. Navigate to Miconazole.mol file in the “Ionization Effects” tutorial folder and click Open.
In this example we will not be using the feature available in the ADMET Predictor® module that predicts Clearance.
In the Pharmacokinetics table, click on the Clearance Source drop-down and select Use None.
We will now import miconazole into GPX™.
Scroll down to the Import panel and click on Start Import.
Information on the import step is displayed underneath the Start Import button. This information is saved in the Lab Book in the “ADMET Predictor®” module.
The project now includes a compound, a formulation, a dosing schedule, a compartmental physiology, and a physiology schedule.
Save the project and click OK.
We will now examine pH dependent properties.
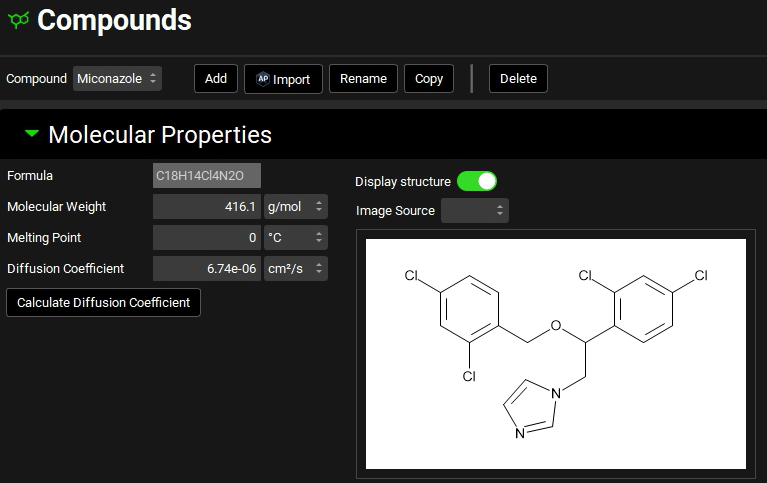
Navigate to the Compounds view and expand the Molecular Properties panel.
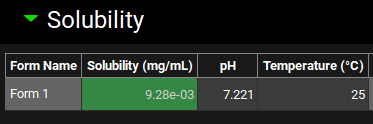
Expand the Solubility panel, change solubility to 9.28e-03 mg/mL.
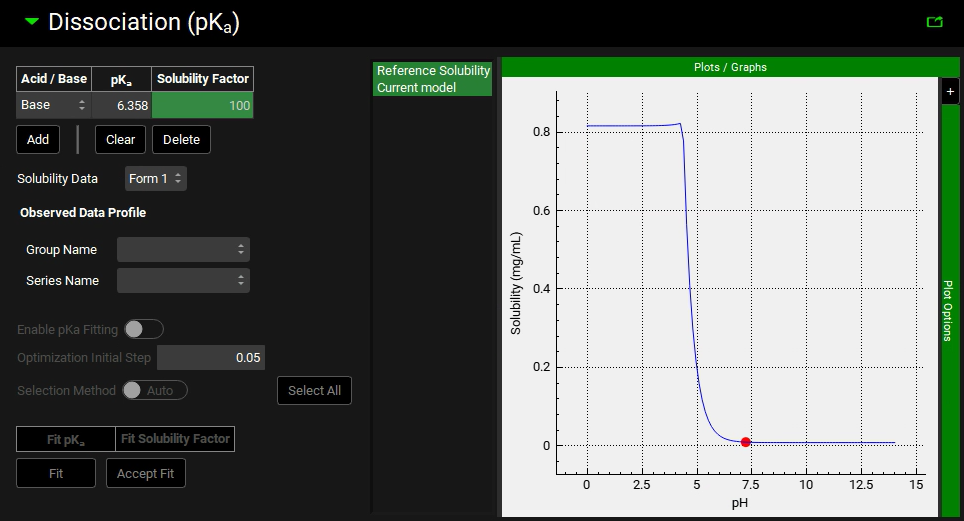
Scroll down and expand the Dissociation (pKa) panel.
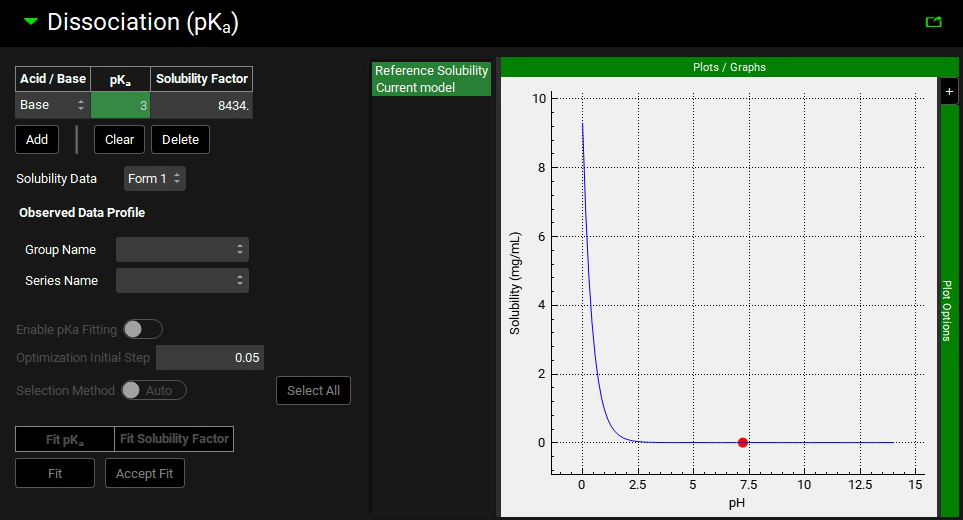
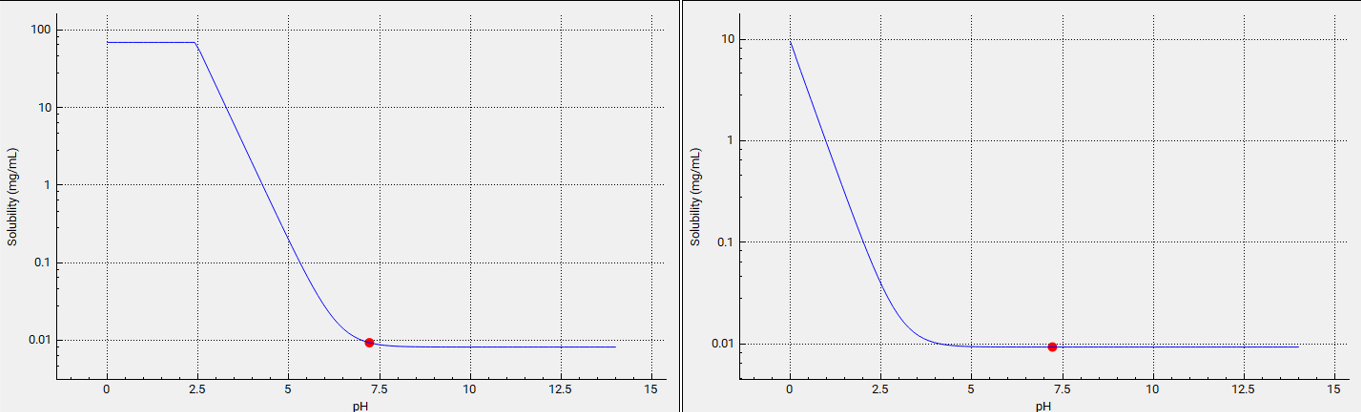
Because the pKa is close to the Small Intestinal pH, the solubility and logD in distinct regions of the GI tract are significantly different for this compound. Examine the solubility versus pH plot in semi-log scale:
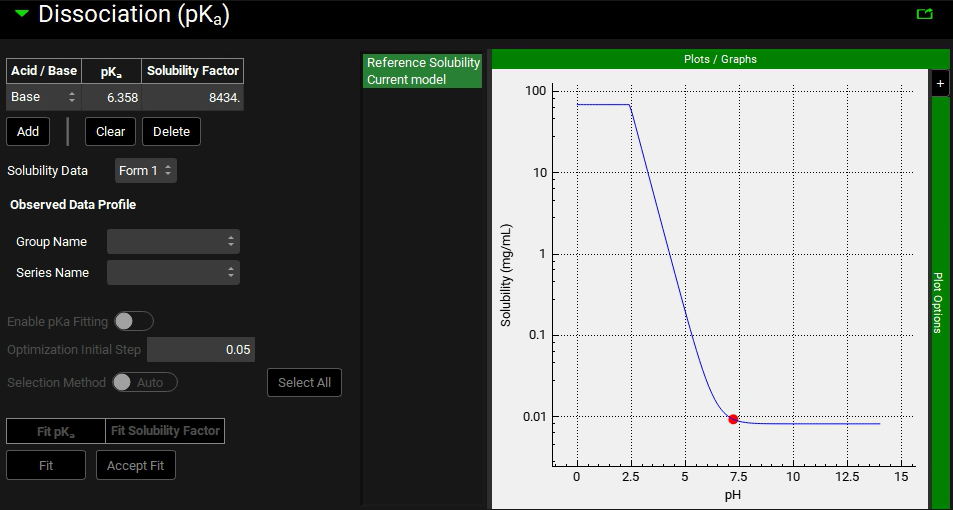
The pKa entry estimated by ADMET Predictor® (pKa = 6.358) is close to the experimental value of 6.12 1 . For the moment, we will keep using the ADMET Predictor® value of 6.358. The Solubility Factor is the ratio of the solubility of the completely ionized form of an ionizable group to the completely unionized form. In this case the Solubility Factor estimated by ADMET Predictor® is 8434. This value represents the large change in solubility going from the neutral form to the cationic form of miconazole.
If the solubility factor is not known for a particular ionizable group, a simple rule for estimating solubility factor is to divide the number 20 by the intrinsic (un-ionized) solubility in mg/mL:
SF = 20/(intrinsic solubility in mg/mL)
If the solubility of miconazole at 2 different pH’s is known (one at least two pH units above and one at least two pH units below the pKa), the solubility factor can be determined by dividing the highest solubility by the lowest.
NOTE: The ADMET Predictor® module will automatically calculate the solubility factor and is recommended as the best estimate when experimental data is not available.
Note that for miconazole, the solubility in the pH range 3.5 – 7 decreases monotonically.
Now, let’s examine the logD versus pH profile.
Expand the Octanol/Water Distribution Coefficient (logD & logP) panel.
Examine the logD versus pH plot and note that the logD increases from pH 3.5 to pH 7. The logD-pH profile is used in calculating the absorption scale factors (ASFs) in the absorption model.
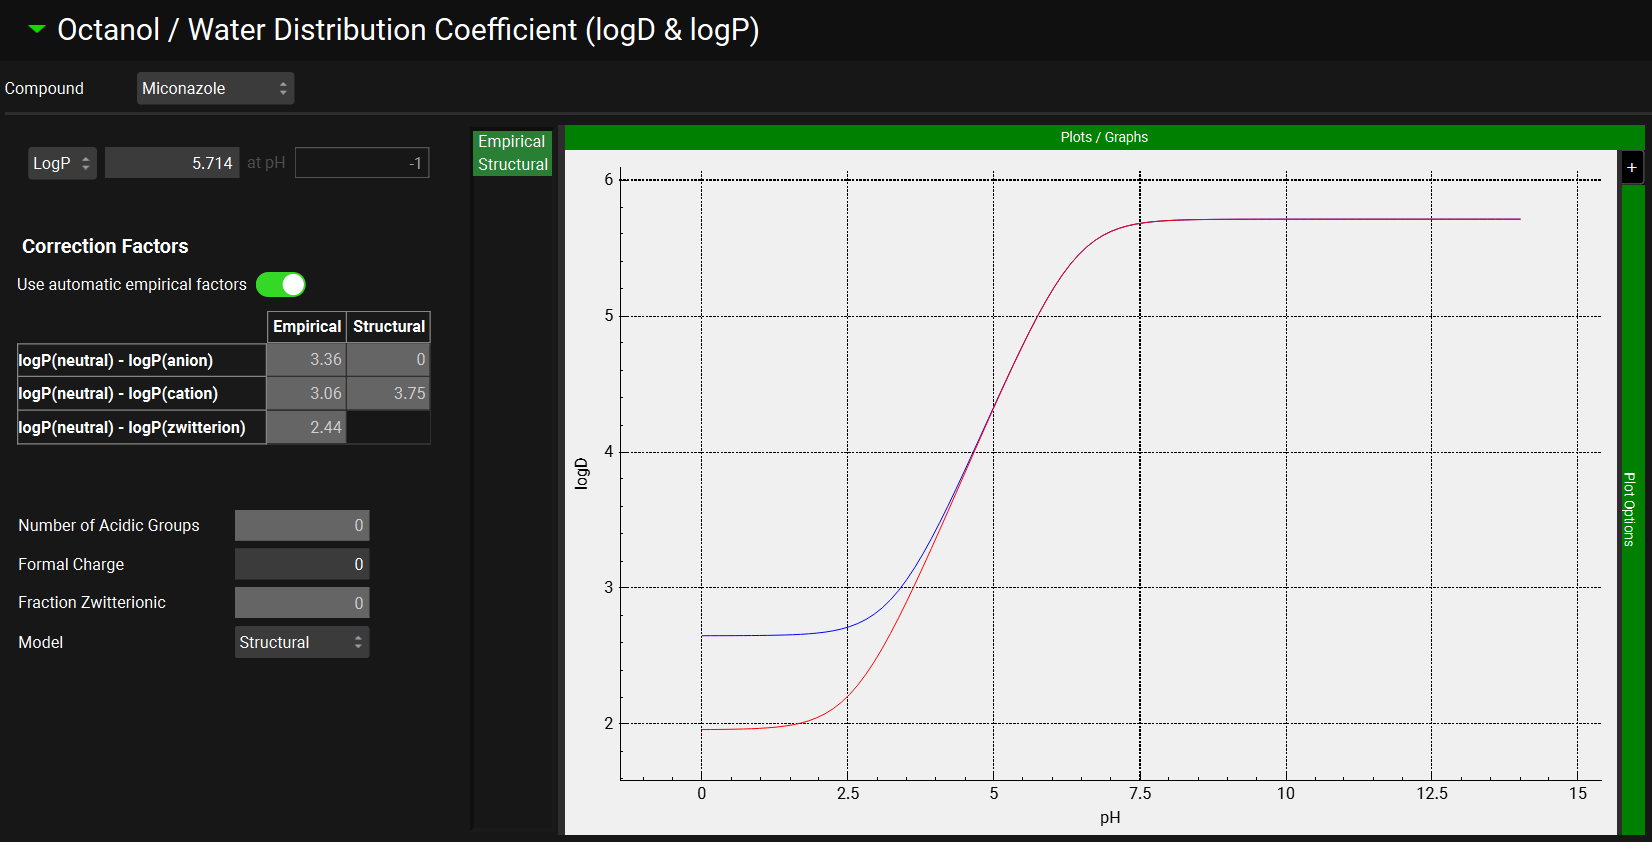
There will be two curves/ models in the logD & logP plot when the structure is imported via ADMET Predictor® (Empirical and Structural). In this case, the Structural model is selected by default. If the structure has not been imported, then the structural model will not be available and the Empirical model will be used.
Expand the Permeability panel and examine the Input Permeability (representing effective jejunal permeability) and Paracellular parameters for each method.
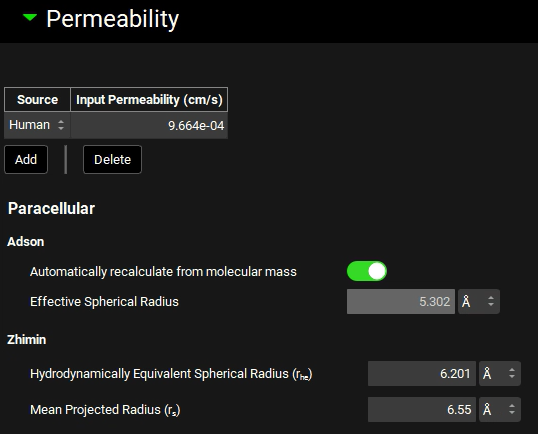
Passive absorption is assumed to be a first order process with a time-dependent rate that is proportional to Peff x ASFcompt and the concentration difference between the lumen and enterocytes in each compartment at each point in time. Using the logD-pH profile to calculate the ASFs allows a single Peff to be inputted, which is used in all intestinal compartments, but the ionisation effects are compensated for by adjusting the ASFs instead of the Peff.
The absorption scale factors will now be examined. Navigate to the Physiologies panel and expand the Gastrointestinal panel.
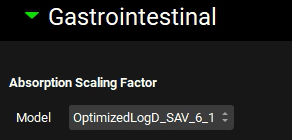
GastroPlus® provides multiple models for ASF. The most advanced model is OptimizedLogD_SAV_6_1 which is selected by default. Based on the selected model, the ASFs in the ACAT table will be recalculated. The selection made here is for informational purposes only. The final ASF model selection should be made in the Simulations view, under the Compound Settings panel and the ACAT Model subpanel.
Scroll down further to examine the ACAT table:
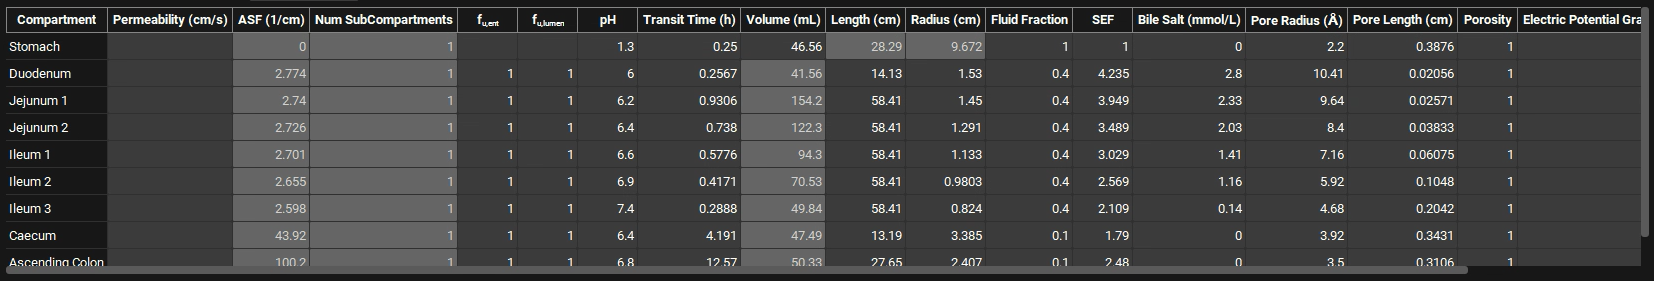
Note that the ASFs in the small intestine are not all equal. Depending on the logD in each compartment of the GI tract, the ASFs have been automatically scaled by the logD-based ASF model (using the coefficients C1-C4). Notice that the ASFs are slightly decreasing along the small intestine compartments. As the pH increases, the logD should increase (remember the plot of logD vs. pH that shows increasing logD with increasing pH), and we would expect the ASFs to be increasing. However, the logD is not the only parameter taken into consideration when calculating ASF. Other physiological changes, mainly decreasing density of villi and microvilli down the small intestine (represented by the SEF parameter) are causing the ASFs to be highest in the duodenum.
SimulationsPlus has optimized the ASF scaling (i.e., the values of C1-C4) in the “Opt logD Model SA/V 6.1” to provide the best compromise model for a variety of drugs. This model is often adequate, but it may need to be modified for drugs that are substrates for influx or efflux transporters.
Navigate to the Pharmacokinetics view and expand the Compartmental panel. Change the General Clearance ((L/h)/kg) cell to the observed value of 0.65 (L/h)/kg and hit Enter.
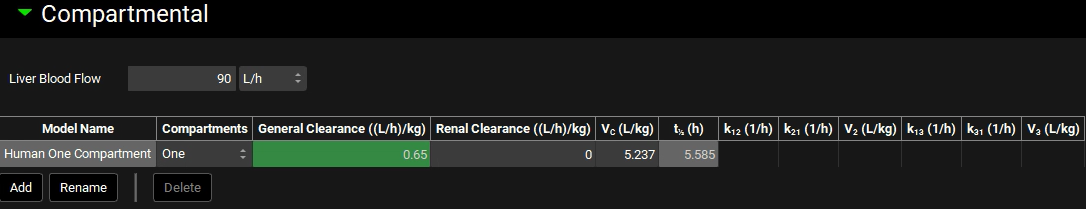
This will allow for the clearance of absorbed compound and give a good simulation of the sink effect in vivo.
To change the clearance unit to (L/h)/kg, click on the General Clearance heading and activate the option to use /kg by clicking in the white square. The square should then have a grey center.
Save the project and click OK.
Navigate to the Simulations view. If you have imported the compound via ADMET Predictor®, a simulation is automatically created. If you are using the project provided the Simulation has been created for you. Click on Check Warnings then Run Simulation. Both buttons are found under the Simulation name.
When the simulation finishes the view will be switched to Analysis view.
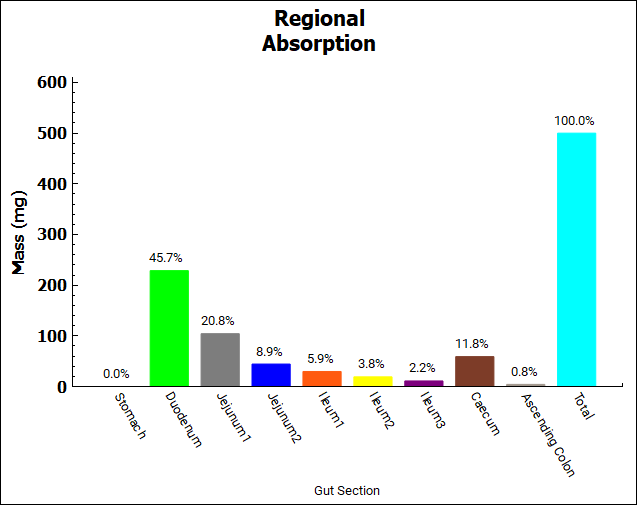
The Key View displays the Cp-Time plot by default. Select the Regional Absorption plot from the Key View ribbon, the majority of the absorption occurs in the small intestine.
Click on the Absorption & Dissolution plot to see a plot comparing the total cumulative amount of compound dissolved (red line) and the total cumulative amount of compound absorbed.
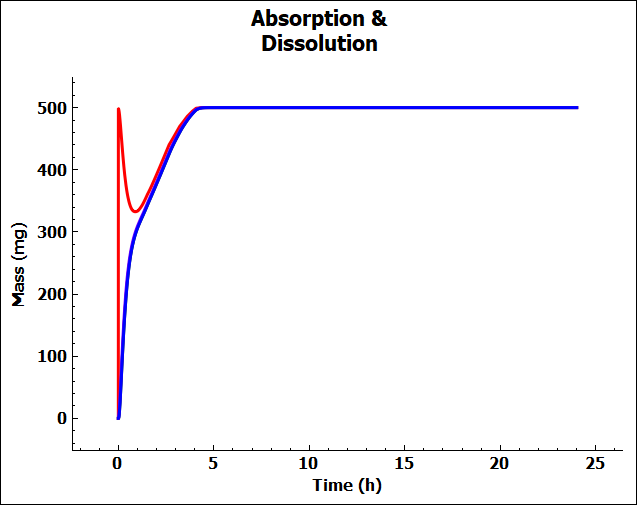
This is a classic profile for a low solubility weak base. There is rapid dissolution in the stomach followed by precipitation as the compound moves into the small intestine at pH = 6.0. You may see only a blue line because we have not included first pass extraction in the Gut or Liver so the blue (cumulative amount entering Portal Vein) and green (cumulative amount entering systemic circulation) lines are overlaid with the cumulative amount of compound absorbed (purple line).
To unselect these curves in the plot, expand the Plot Settings by clicking on the “+” on top of the bar in the upper right-hand corner of the plot. One can hover the cursor over a Plot Name to display the full name as a tooltip. One can also increase the width of the “Plot Settings” by moving the cursor to the line that divides the “Plots / Graphs” and the “Plot Settings” so that the cursor changes to a double arrow, then right click on the mouse and drag it to the left. Uncheck the boxes for “Miconazole – Systemic Circulation – Mass Entered” and “Miconazole – Total Portal Vein” in the legend to display only the lines for total dissolved (red) and absorbed (purple) amounts. Comparing these two curves will give you a good idea of whether dissolution or permeability is rate-limiting. When these two curves are parallel, as they are for this example, dissolution is generally more rate-limiting. When they are diverging, permeability is generally more rate-limiting.
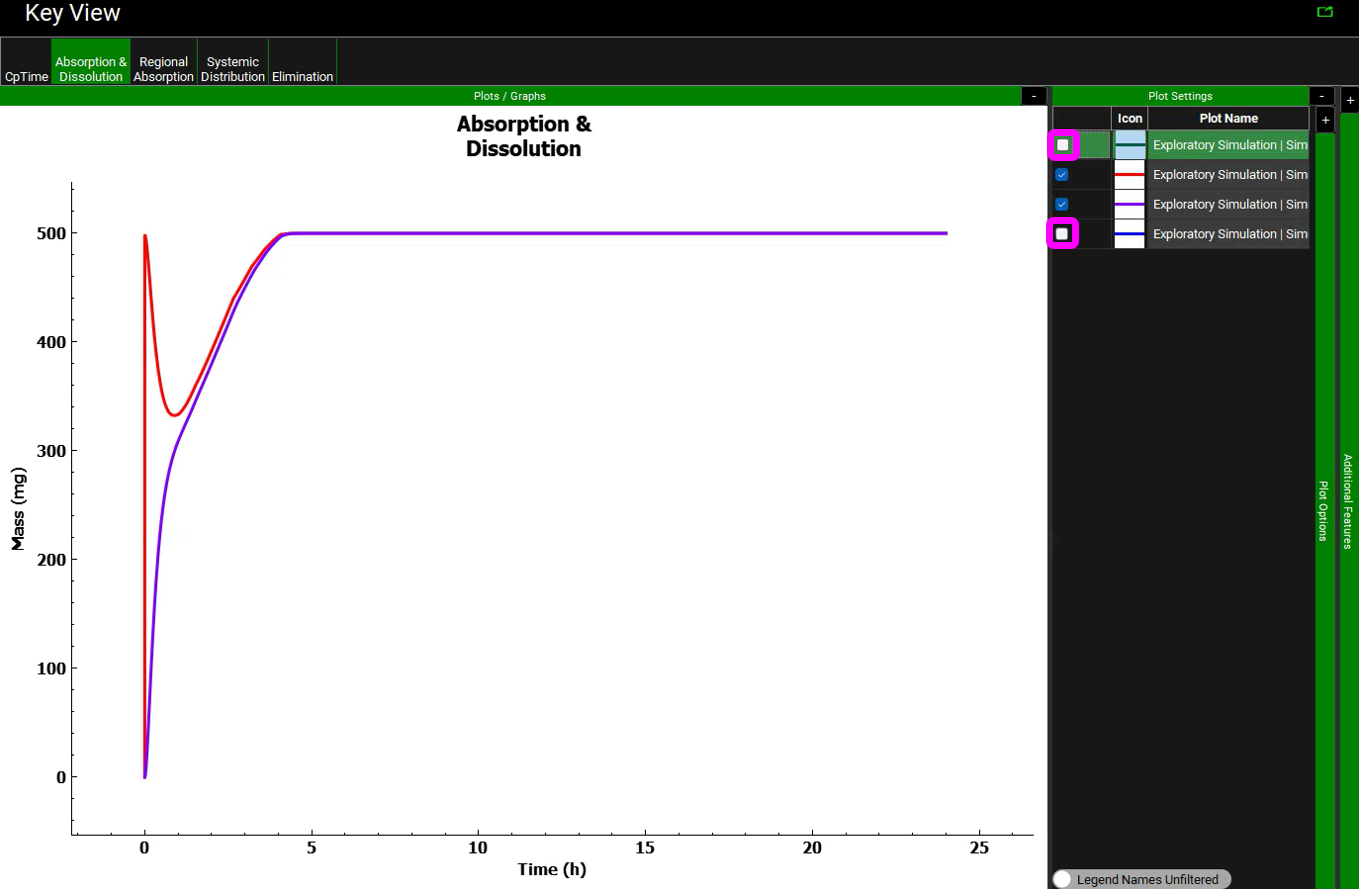
Observe that approximately 500 mg of the 500 mg dose (i.e., about 100%) was dissolved after about 5 h. Note that the initial slope of the total dissolved curve is steep, it peaks very quickly, and the dissolved amount is decreasing for about an hour. As the compound transits from stomach to duodenum, the solubility of the compound decreases due to the higher pH in the duodenum, resulting in precipitation of some of the amount that dissolved in the stomach. As the compound is absorbed, the “sink effect” allows more of the compound to dissolve. Since miconazole has predicted high permeability, the sink effect is considerable.
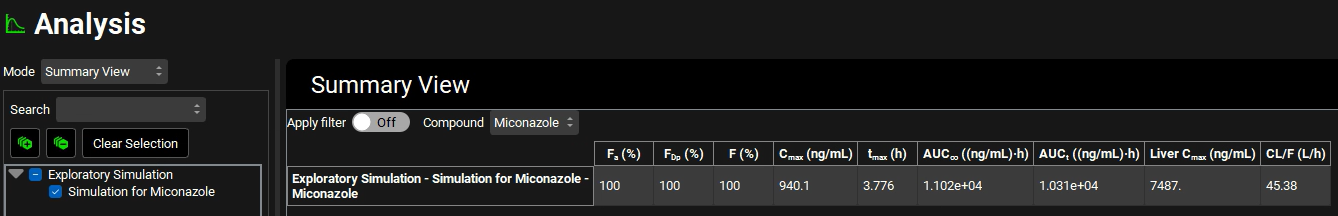
Change the Mode to “Summary View” and examine Fa (%), FDp (%), and F (%). Remove the columns for observed data by clicking the Observed data on toggle, the toggle should change from green to grey.
Several assets will now be created to compare how different parameter values and physiology affect the simulation. The table below summarizes the simulations that will be set up in this tutorial. The dose is 500 mg, the general clearance is 0.65 (L/h)/kg clearance, and a 70kg male will be used for all simulations. First, we will change a parameter and then create a simulation using that parameter. The simulations will be performed two at a time, in the Runs View, and the results will be compared. The table below contains the simulations that will be created.
Simulation Name | Compound | Comment |
Simulation for Miconazole | Miconazole | original simulation |
Simulation for Perm 1 | Miconazole | 2nd Peff entry - lowered Peff from 9.8E-04 to 1.0E-04 cm/s |
Simulation for Perm 1 Sol 0.0928 | Sol 0.0928 | 2nd Peff entry - lowered Peff from 9.8E-04 to 1.0E-04 cm/s and increased solubility from 0.00928 to 0.0928 mg/ml |
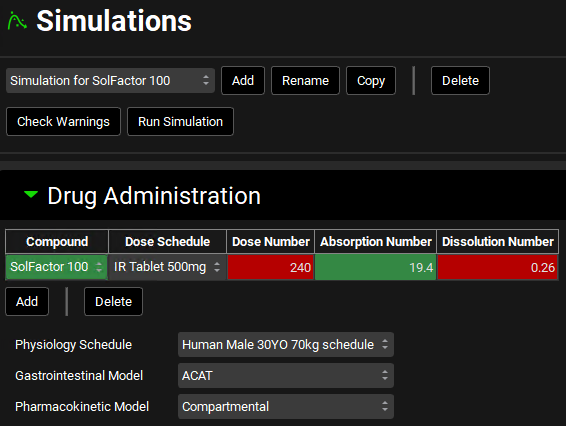
Simulation for SolFactor 100 | SolFactor 100 | Solubility factor was reduced from 1213 to 100 |
Simulation for pKa 3 | pKa 3 | Decreased pKa from 6.4 to 3 |
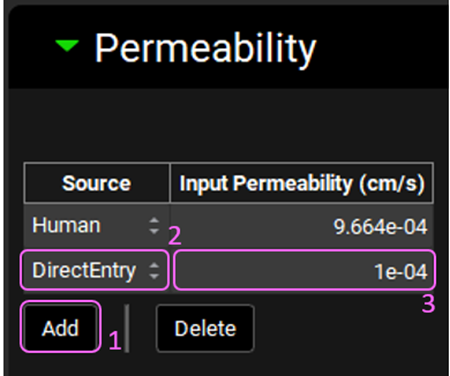
First, another permeability entry will be created for the Miconazole compound, which will be reduced to 1.0E-04 cm/s.
Navigate to the Compounds view in the navigation pane.
In the Compounds view, expand the Permeability panel. Click on the Add button below the permeability table to create another permeability entry. Select DirectEntry from the Source drop-down in the second row. Change the Input Permeability (cm/s) to 1.0e-04 by typing in the value and pressing Enter.
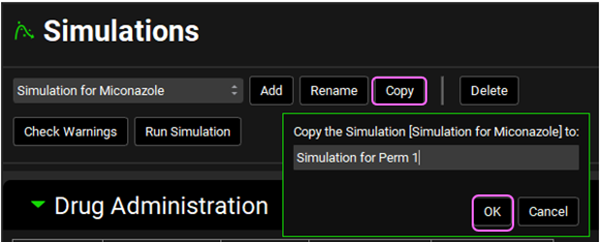
Navigate to the Simulations view in the navigation pane.
Click the Copy button to copy the Simulation for Miconazole. Enter “Simulation for Perm 1” into the dialog box and click OK.
Open the Compound Settings panel and scroll down to the Permeability sub-panel. From the Effective Permeability Source drop-down select DirectEntry, you will see the value in the table below is 1.0e-4 cm/s.
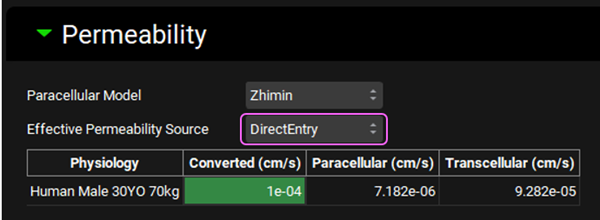
Changing the Effective Permeability Source will trigger a re-calculation of the Absorption Number in the Drug Administration panel.
Save the project and click OK.
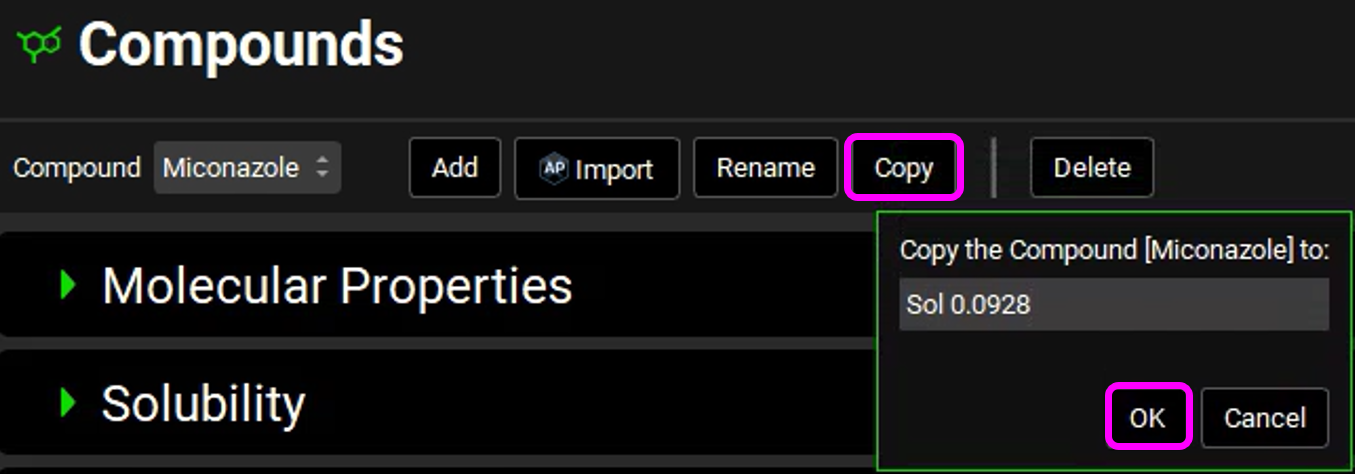
Navigate back to the Compounds view. We will now create a new compound asset that has a solubility of 0.0928 mg/ml instead of 0.00928, i.e., increased solubility.
Click on the Copy button and name the new compound “Sol 0.0928” and then click the OK button.
Open the Solubility panel and change “Solubility (mg/mL)” to 9.28E-02.
Save the project and click OK.
Navigate to the Simulations view in the navigation pane.
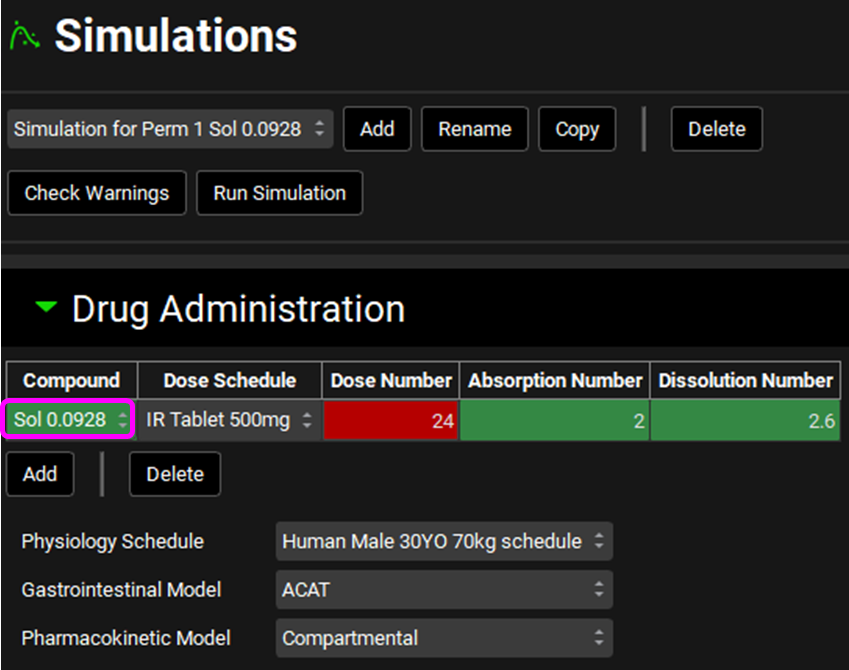
Click the Copy button to copy the Simulation for Perm 1 and enter “Simulation for Perm 1 Sol 0.0928” into the dialog box and click OK.
In the Drug Administration panel, change the compound to “Sol 0.0928”.
Scroll down to the Permeability sub-panel and make sure that DirectEntry is selected from the Effective Permeability Source drop-down.
Save the project and click OK.
Next, a simulation with a lower solubility factor will be created. This will reduce the solubility at lower pH values.
Navigate to the Compounds view in the navigation pane. Select Miconazole as the compound.
Click the Copy button and enter SolFactor 100 for the compound name.
Open the “Dissociation (pKa)” panel.
Change the “Solubility Factor” to 100 and hit Enter.
Navigate to the Simulations view in the navigation pane.
Click the Add button and enter “Simulation for SolFactor 100” for the simulation name.
Change the Compound in the Drug Administration table to SolFactor 100.
Save the project and click OK.
In the last simulation, the pKa of the compound will be changed to 3.
Navigate to the Compounds view and select Miconazole from the Compound drop-down.
Click the Copy button and enter “pKa 3” for the name.
Expand the “Dissociation (pKa)” panel.
Type 3 for the pKa and hit Enter.
Save the project and click OK.
Navigate to the Simulations view in the navigation pane.
Click the Add button and enter “Simulation for pKa 3” for the simulation name and click OK.
Change the Compound in the Drug Administration table to pKa 3.
Save the project and click OK.
Now, all the assets and simulations have been defined and we will now compare simulations with different permeability.
The original miconazole simulation will be compared to the one where the permeability was lowered.
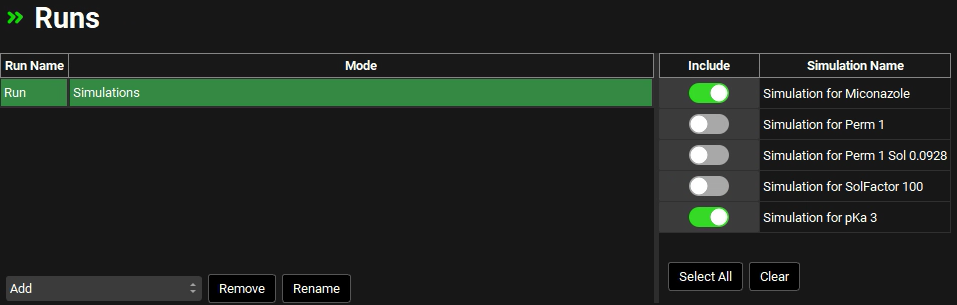
Navigate to the Runs view in the navigation pane.
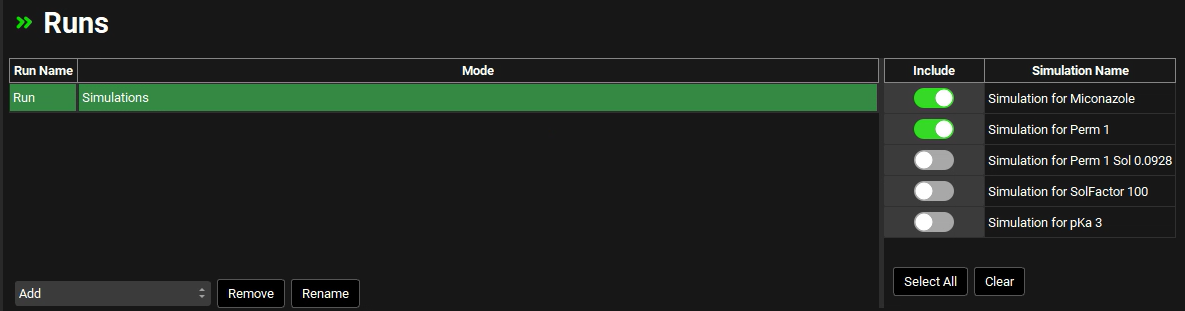
Click on the “Run” Run Name in the table to highlight it in green.
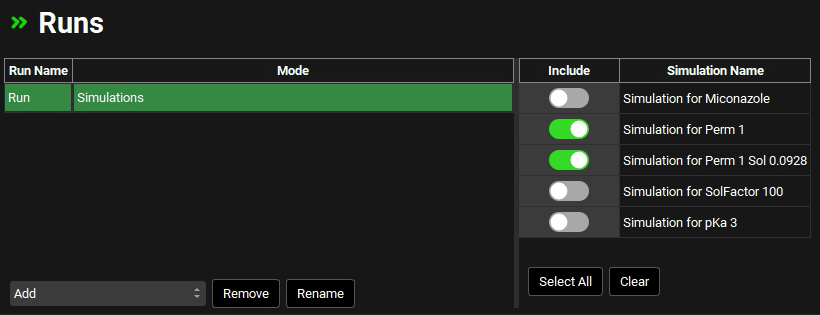
Select the Include toggle for the “Simulation for Miconazole” and “Simulation for Perm 1”.
Scroll down and click the Start button in Run Controls panel.
When the simulations are finished, the Analysis view will be displayed.
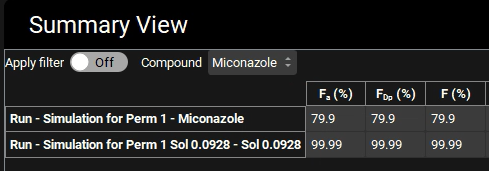
Switch the mode to “Summary View” in the Mode drop-down.
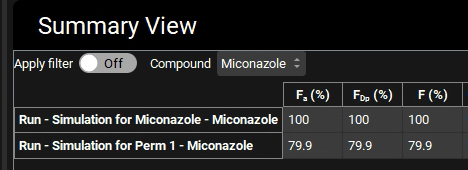
You will notice that Fa (%) has decreased to 79.9% because the dissolved material doesn’t leave the gut lumen as fast due to lower permeability.
Switch the mode to Key View in the Mode drop-down.
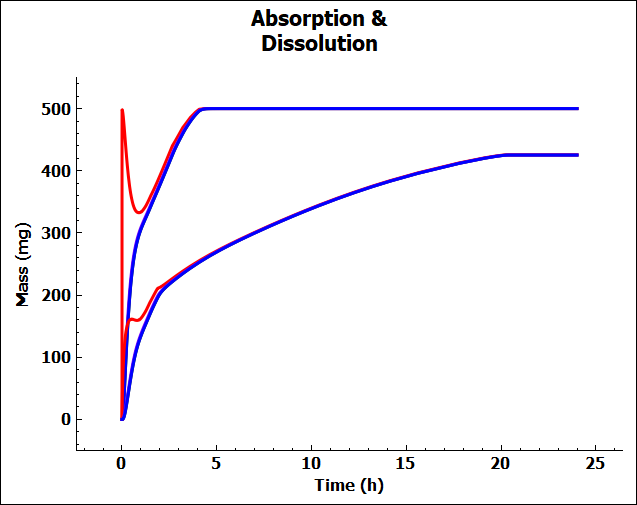
Click on the Absorption & Dissolution plot in the Key View ribbon.
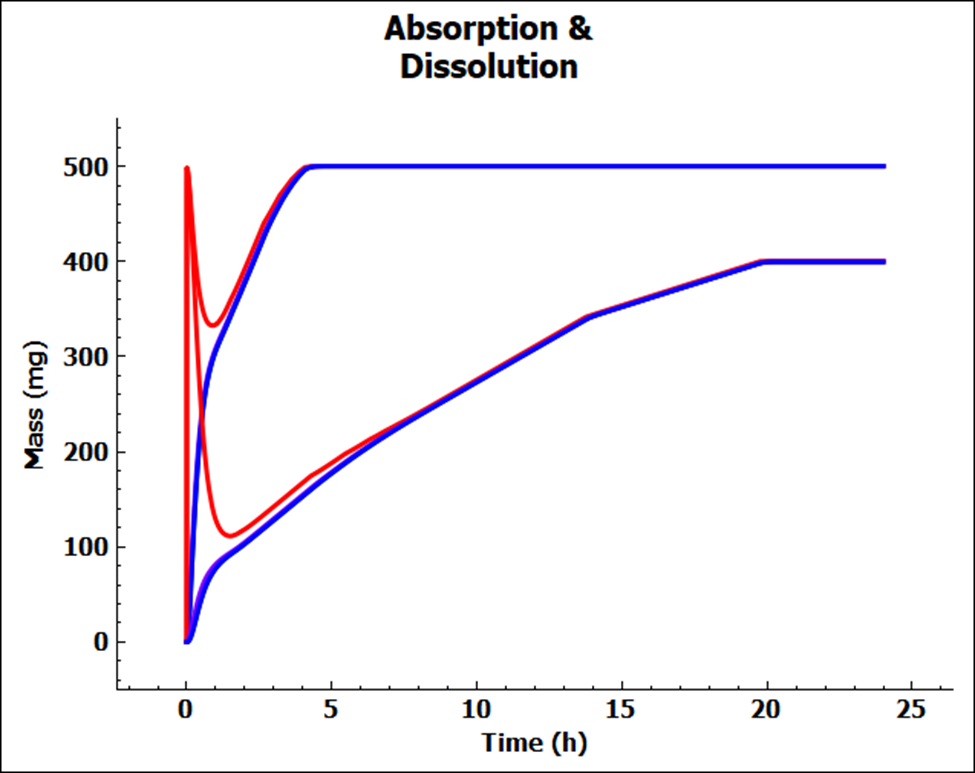
Notice that the lower red line has about 300 mg dissolved at 12 h. Lower permeability has resulted in lower dissolution, because of the lower sink effect. This strong interaction between absorption and dissolution is one of the more critical aspects of compound absorption that GastroPlus® allows you to see.
The “Systemic Circulation – Mass Entered” curves for both simulations have been unchecked from the above plot.
Next, we will do a comparison where the solubility has been increased in conjunction with lower permeability.
Navigate to the Runs view in the navigation pane.
Unselect the Include toggle for Simulation for Miconazole and select the Include toggle for “Simulation for Perm 1 Sol 0.0928” (keep the “Simulation for Perm 1” selected).
Click the Start button in Run Controls panel.
Switch the mode to “Summary View” in the Mode drop-down. Note how the Fa (%) has increased to nearly 100% even with the lower permeability.
Next, the effect of lowering the solubility factor on PK parameters will be examined.
Navigate to the Runs view on the navigation pane.
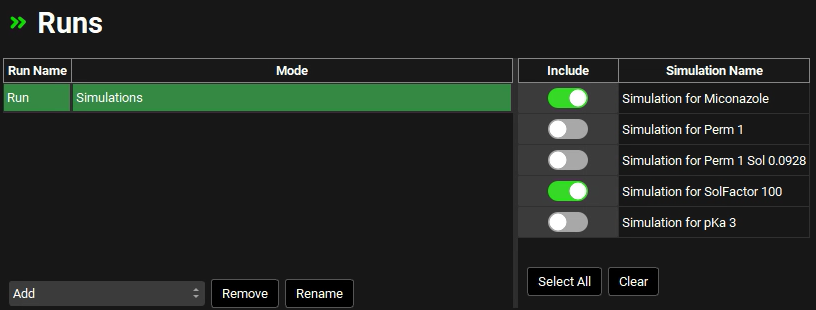
Select the Include toggle for “Simulation for Miconazole” and “Simulation for SolFactor 100” and unselect the other simulations.
Click the Start button in Run Controls panel.
Switch the mode to “Summary View” in the Mode drop-down.
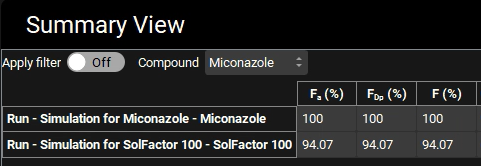
Note that Fa (%) is about 6% lower when the solubility factor is 100.
Switch to Key View and select the Absorption & Dissolution plot.
Expand the legend by clicking on the “+” sign on the Plot Settings bar. Unselect all plots except the two total dissolved curves (red curves).
Expand the Additional Features panel by clicking on “+” at the top of the bar on the right-hand side of the graph. Select Simulation from the drop-down and then click on the Color by button. (NB the colors you get may be different to the screenshot – repeatedly clicking the Color by: button cycles through different color options)
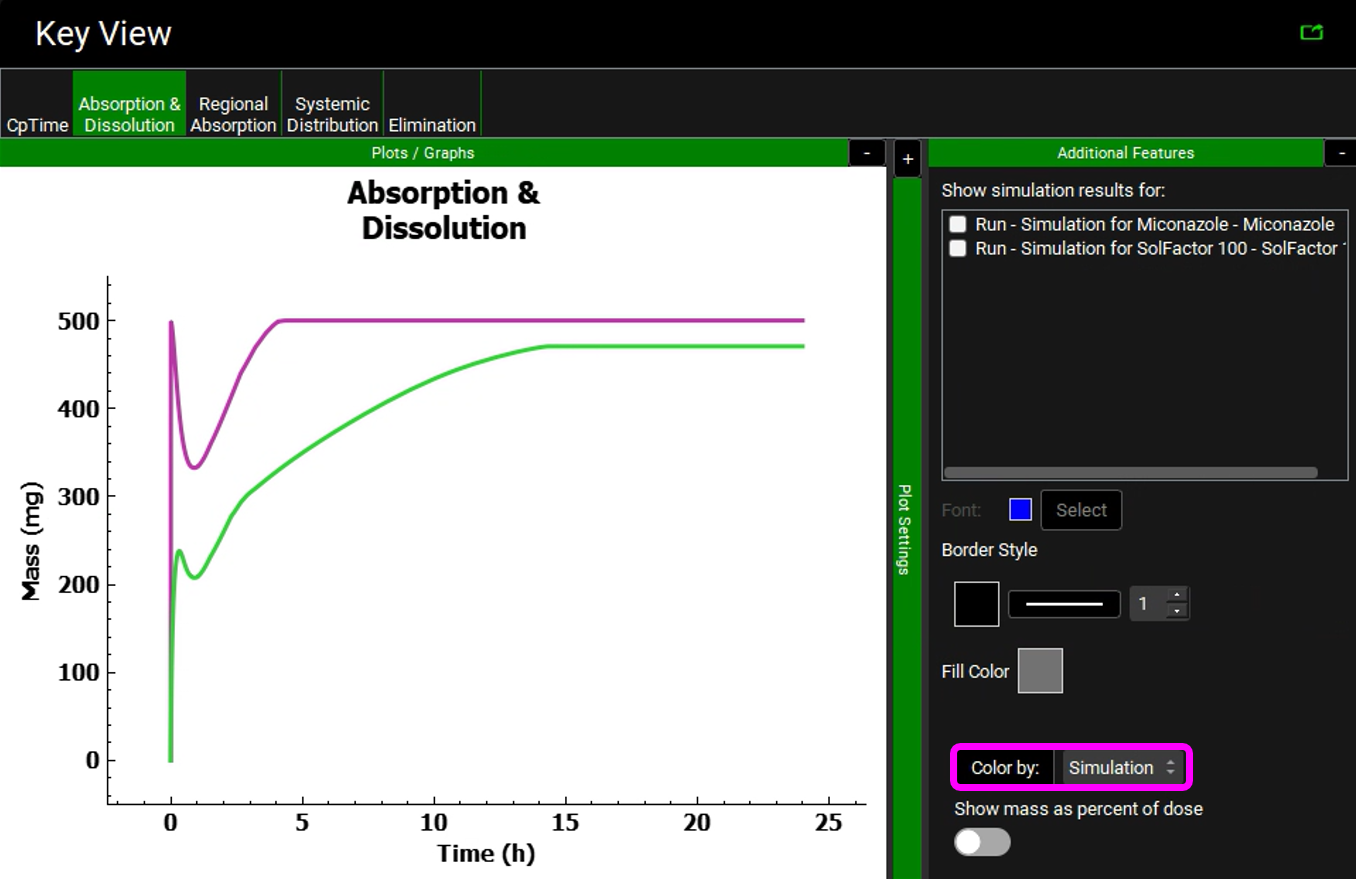
The reduction of the solubility factor greatly reduces the amount that is dissolved in the stomach. The compound then dissolves more slowly in the gastrointestinal tract.
The final simulations will compare pKa of 6.358 to 3. This results in lower solubility down to about pH=3.5 as shown in plots below (the left-hand plot is pKa =6.358 and the right-hand plot is pKa =3). These can be viewed in the interface by navigating to the Compounds view, expanding the Dissociation (pKa) panel, and switching the compound from Miconazole to pKa 3 (Plots presented in log scale in the screenshots below).
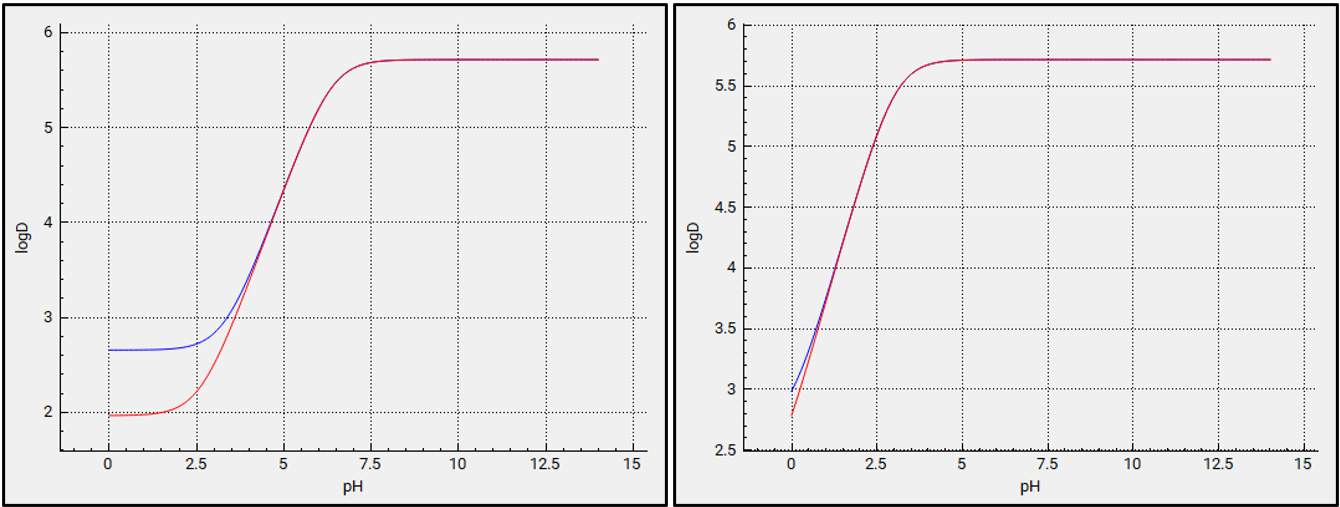
Lowering the pKa to 3 results in higher logD at pH values below 3 as shown in the plots below (the left-hand plot is pKa =6. 358 and the right-hand plot is pKa =3). These can be viewed in the interface by navigating to the Compounds view, expanding the Octanol / Water Distribution Coefficient (logD & logP) panel, and switching the compound from Miconazole to pKa 3.
Please evaluate how a lower pKa affects PK parameters.
Navigate to the Runs view and select the Include toggle for “Simulation for Miconazole” and “Simulation for pKa=3” and unselect the other simulations.
Click Start Run in the Run Controls panel.
The “Absorption & Dissolution” plots will be displayed in the Analysis View.
When the pKa is lowered to 3, the solubility is lower in the stomach, so much less of the compound dissolves. This results in a larger amount of undissolved compound in the gastrointestinal tract and a lower Fa (%).
- K. Balon, B. U. (1999). Drug liposome partitioning as a tool for the prediction of human passive intestinal absorption. Pharm Res., 882-888.