Tutorial: Lumen Metabolism
This tutorial explores the metabolism of a compound in the lumen of the gastrointestinal tract.
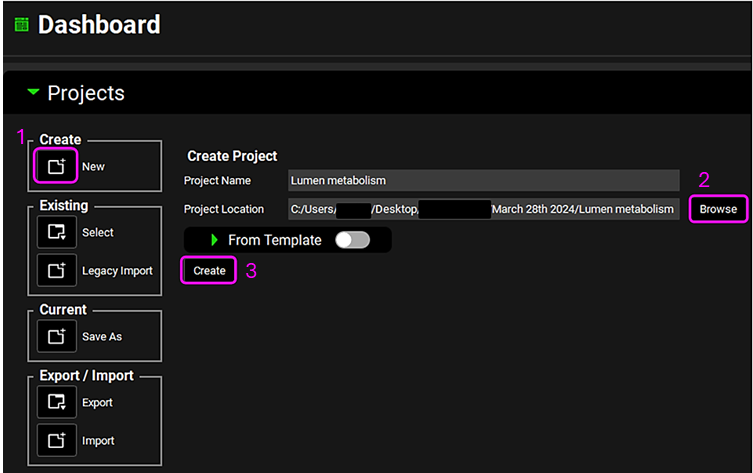
Open GPX™ and, in the Dashboard view, click on the icon next to New to create a new project.
Type in the Project Name “Lumen metabolism” and via Browse navigate to/add a folder to save the project.
Click on Create.
Click on the Compounds view.
Click on Add and type "Drug" then click on OK (or press Enter). Use all of the default compound properties.
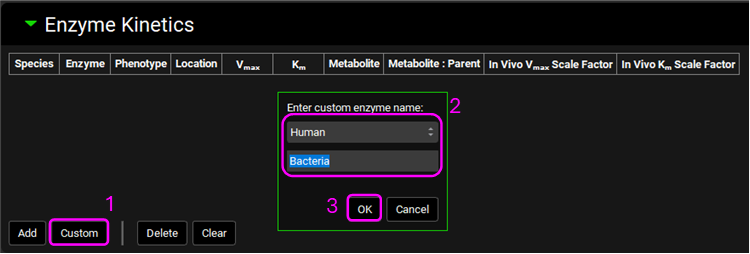
Expand the Enzyme Kinetics panel by clicking on the green arrow or double clicking on the panel header bar.
Click on Custom, select Human from the drop-down list, type “Bacteria” and click on OK (or press Enter).
Select the Location “Lumen Dissolved”.
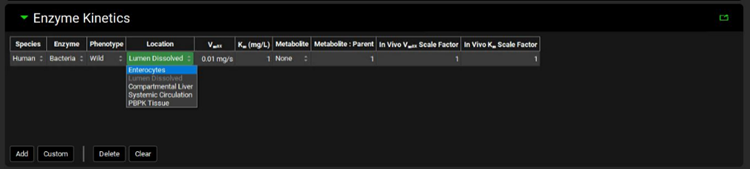
It is possible to include a metabolite for the compound by selecting another compound in the GPX™ project via the Metabolite drop-down list in the Enzyme Kinetics table. We will not explore this functionality in this tutorial.
Save the project and click on OK.
Click on the Dosing view.
Expand the Formulations panel.
Click on Add and type "Tablet" then click on OK (or press enter).
Expand the Dosing Schedules panel.
Click on Add, and type "100mg Tablet" then click on OK (or press Enter).
Click on the Physiologies view.
Click on Add, ensure that Human is selected as species, and type "Human" then click on OK (or press Enter).
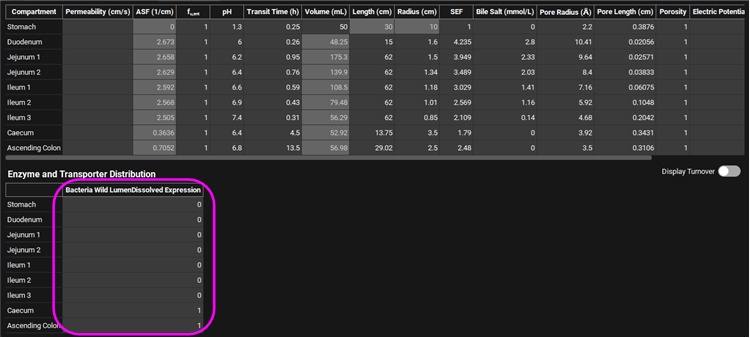
Expand the Gastrointestinal panel and scroll to the ACAT table. Update the Bacteria Wild LumenDissolved Expression as below due to the high bacteria load in large intestine.
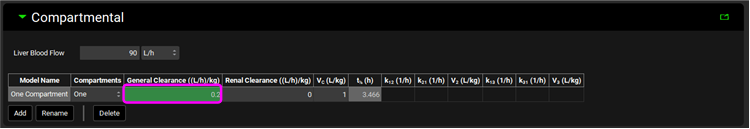
Click on the Pharmacokinetics view and expand the Compartmental panel and then decrease the General Clearance to 0.2 L/h/kg.
Click on the Simulations view.
Click on Add, and type "100mg Tablet Human" then click on OK (or press Enter).
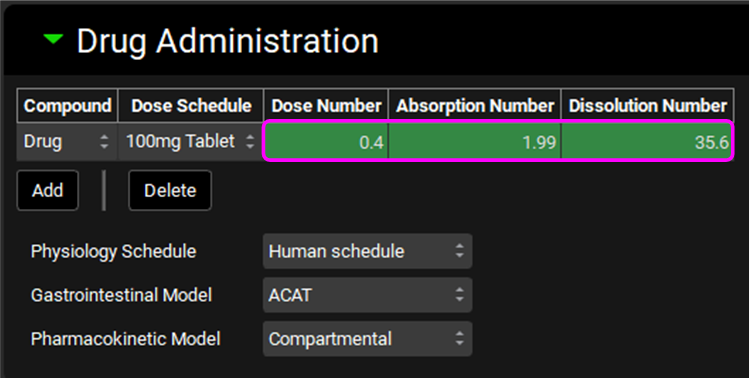
Expand the Drug Administration panel to assess the Dose Number, Absorption Number and Dissolution Number.
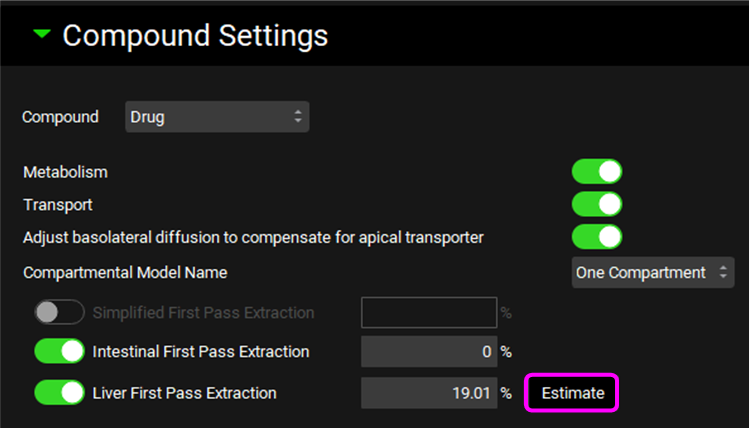
Expand the Compound Settings panel and click on Estimate to calculate the Liver First Pass Extraction.
Save the project and click on OK.
Click on Check Warnings and then Run Simulation.
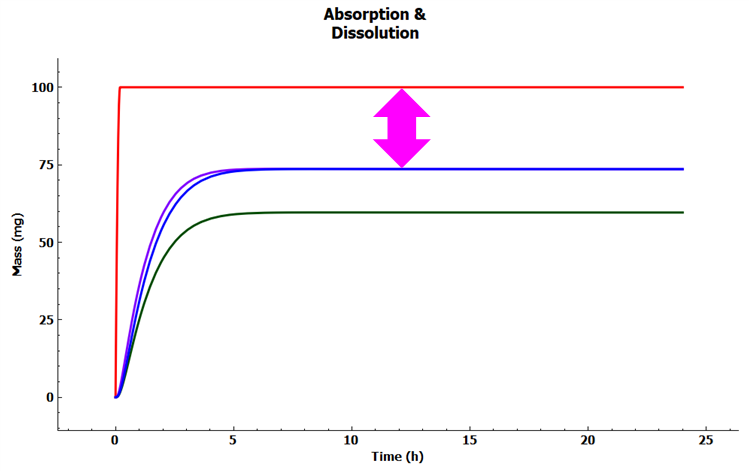
In the Analysis view click on the Absorption & Dissolution plot in the Key View ribbon. Note the amount of dissolved compound lost by lumen metabolism by the difference between the Total Dissolved (red curve) and the Total Absorbed (purple curve).
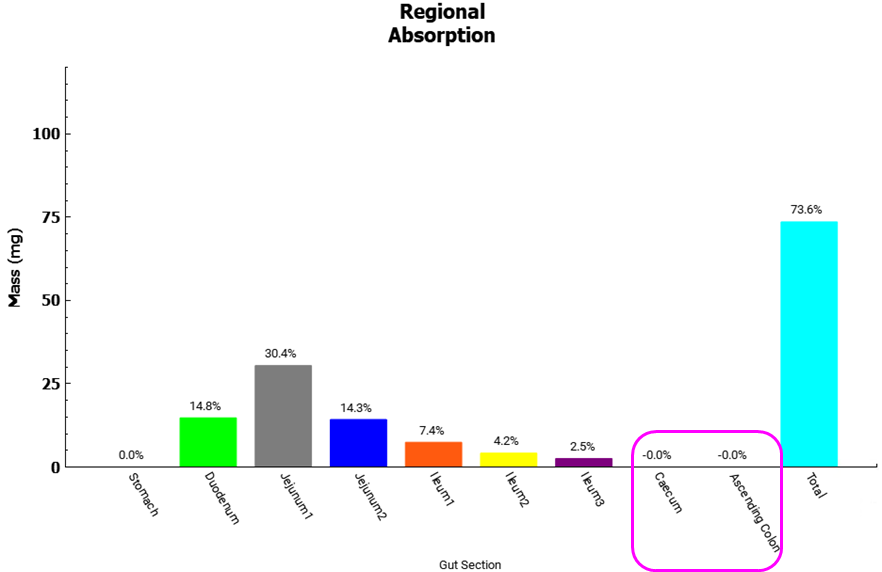
In the Analysis view click on the Regional Absorption plot in the Key View ribbon. Note that no compound is absorbed from the Caecum and Ascending Colon where bacteria is expressed.
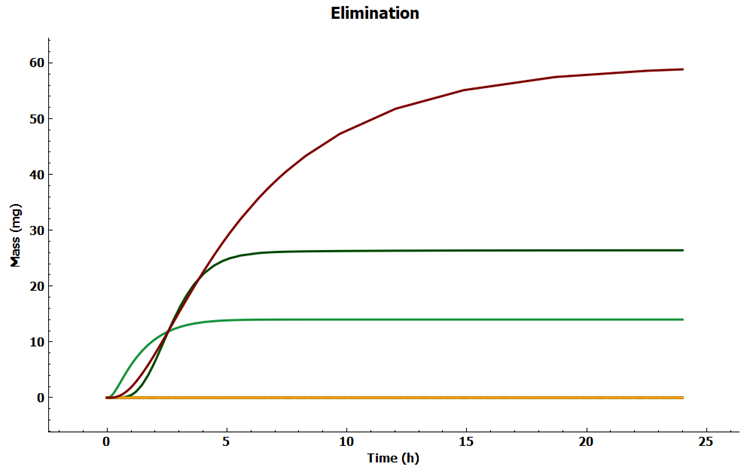
In the Analysis view click on the Elimination plot in the Key View ribbon. Note that compound is cleared by General Clearance (brown curve), Dissolved Metabolized (dark green curve) and Liver Clearance (green curve).
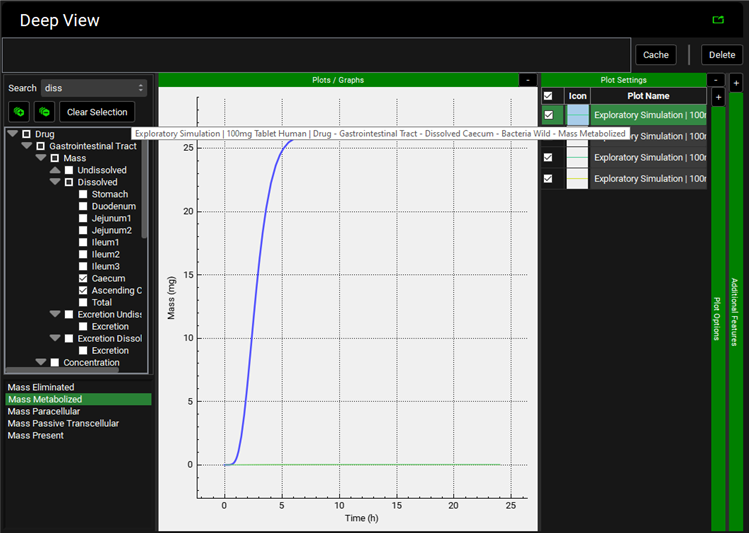
To explore the amount of compound cleared in the lumen of each segment, in the Deep View panel type "diss" into the Search box and press Enter, then select Caecum and Ascending Colon under Dissolved. Select Mass Metabolized under the tree.
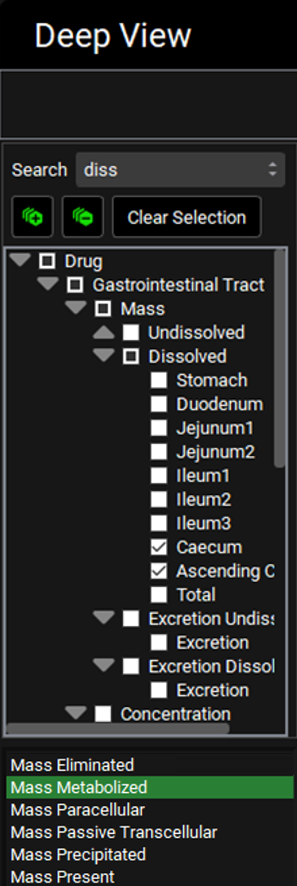
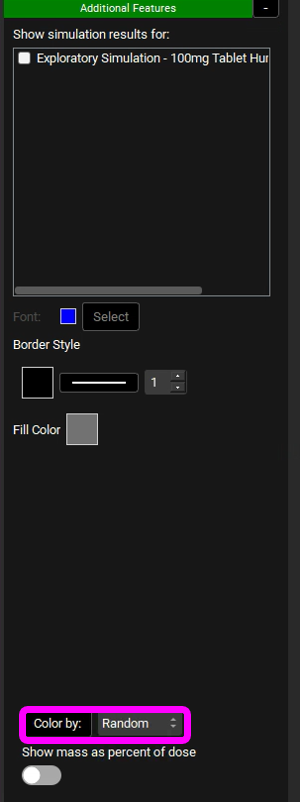
Expand Additional Features via “+”, change to Random in the drop-down list and then click on Color by.
Expand Plot Settings via “+”, click on the curve with the highest mass to reveal that all of the compound is metabolized in the Caecum.