
Tutorial: PDPlus™ Module
This tutorial is displayed in "Light mode" to showcase the difference in themes.
This example illustrates the use of the optional PDPlus™ module by fitting a PD model to observed PD data. Please note that the screenshots in this tutorial are taken while using the Light Theme.
Open GPX™ and, in the Dashboard view, click on the icon next to Select to open an Existing project.
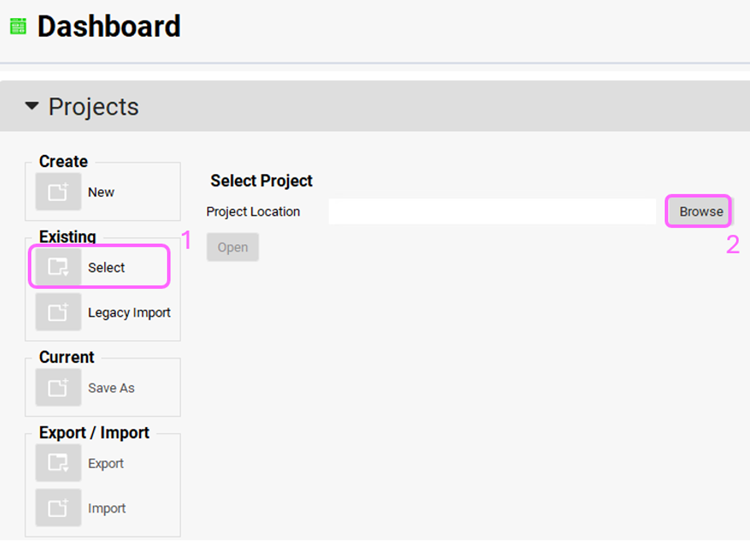
Click Browse and navigate to the C:\Users\<user>\AppData\Local\Simulations Plus, Inc\GastroPlus\10.2\Tutorials\PD tutorial folder and select the project file Pyridostigmine.gpproject by clicking on it and clicking Open.
Navigate to the Observed Data view and note the project already includes an observed Cp-Time profile from a 5 mg IV administration and the associated PD effect – the percent gain of muscular response.
Navigate to the Simulations view. The Pyridostigmine 5mg iv Simulation has been created. Click on the “Check Warnings” and then the “Run Simulation” button.
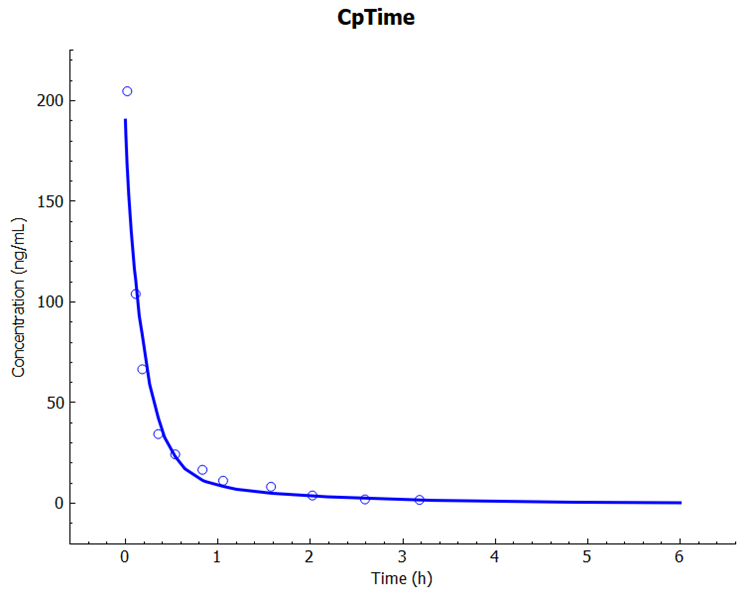
When the simulation completes, the program will automatically switch to the Analysis view and will display the Cp-Time Key View plot. Note the good agreement between simulated and observed profiles.
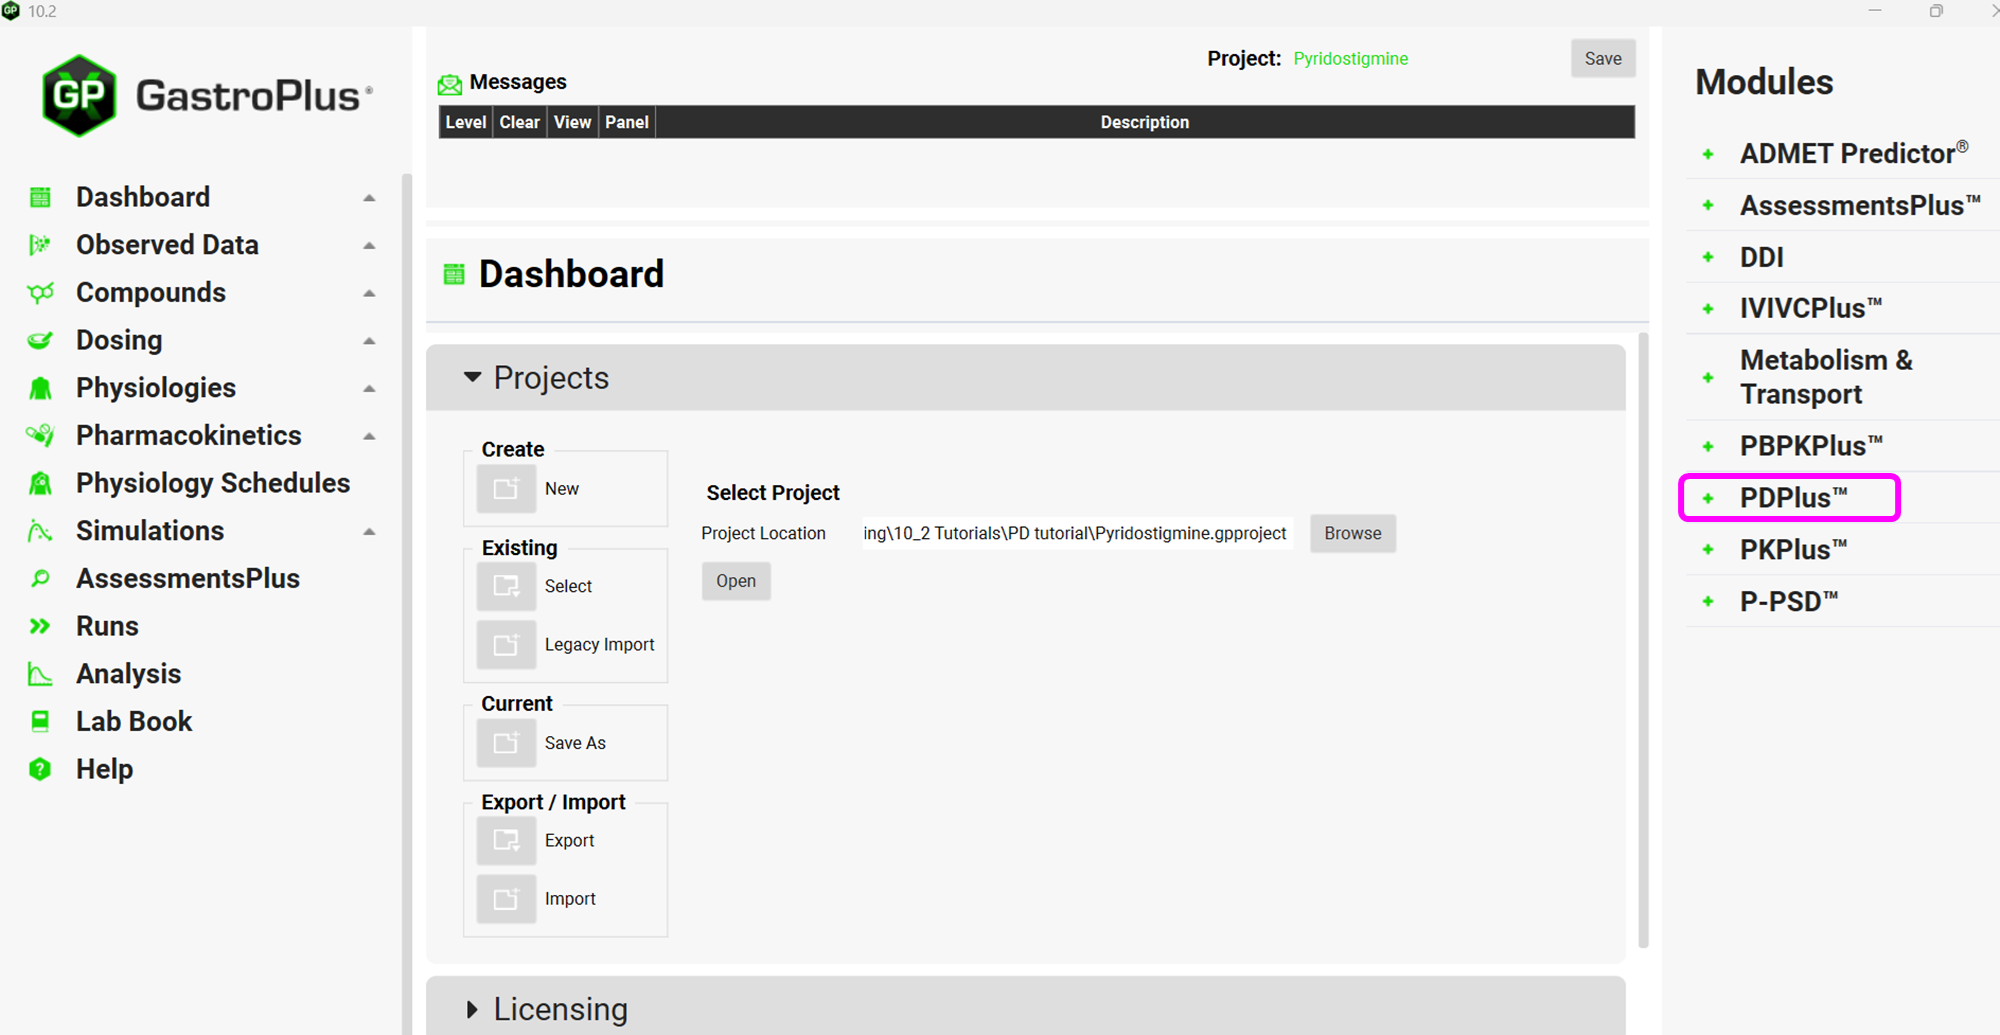
Click on PDPlus™ in the Modules Pane located on the right-hand side of the interface.
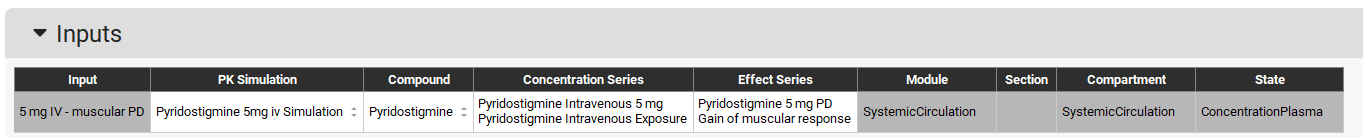
Now we need to setup the inputs for the PD model. Click on Add button of the Inputs Table and name it “5 mg IV - muscular PD” and click OK (or press Enter).
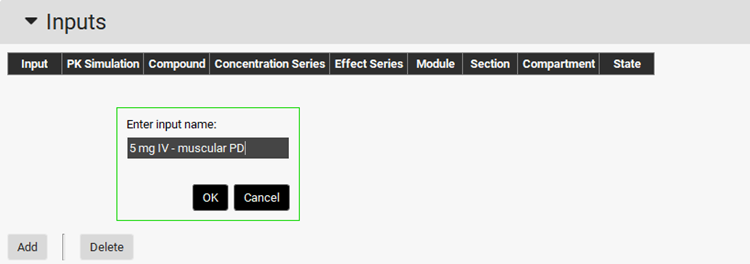
Make sure to select the measured Cp-Time profile as the Concentration Series and the measured PD effect as the Effect Series. Program will automatically set Module, Compartment, and State inputs based on the selected observed data.
Then create a run by clicking on Add button and name it “PD simulation” and click OK or press Enter.
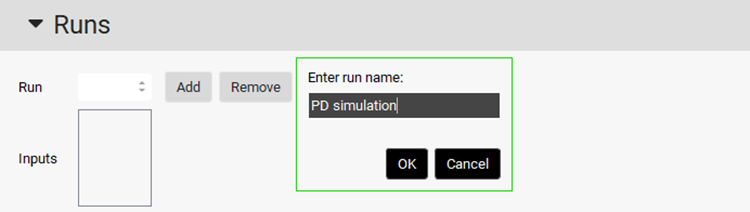
If it is not already selected, select 5 mg IV – muscular PD input for the PD simulation run by clicking on it.

Under the Model Parameters sub-panel, in the Model Selection drop-drown select IndirectClassII. This model corresponds to inhibition of dissipation of response – in other words, the drug itself inhibits the decrease of the pharmacodynamic response as the plasma concentration decreases, resulting in a longer response. Set initial values of the PD parameters as follows: Emax=1, EC50=1000 ng/mL, Kin=75 1/h, Kout=1 1/h and Fu=1.
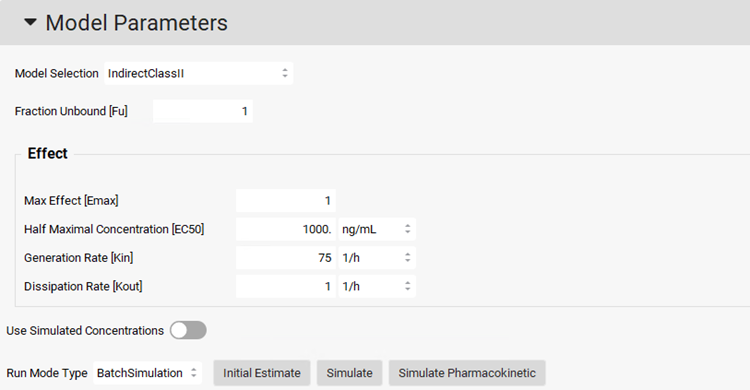
To use the simulated Cp-Time profile for the PD prediction, click on the Use Simulated Concentrations toggle (it will show green if it is on).
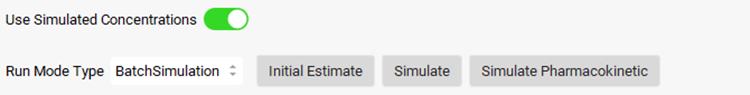
Click on Simulate Pharmacokinetic button, then click on Simulate button. Scrolling down to the Results panel, you can see the plot of the predicted PD response using the simulated concentration profile.
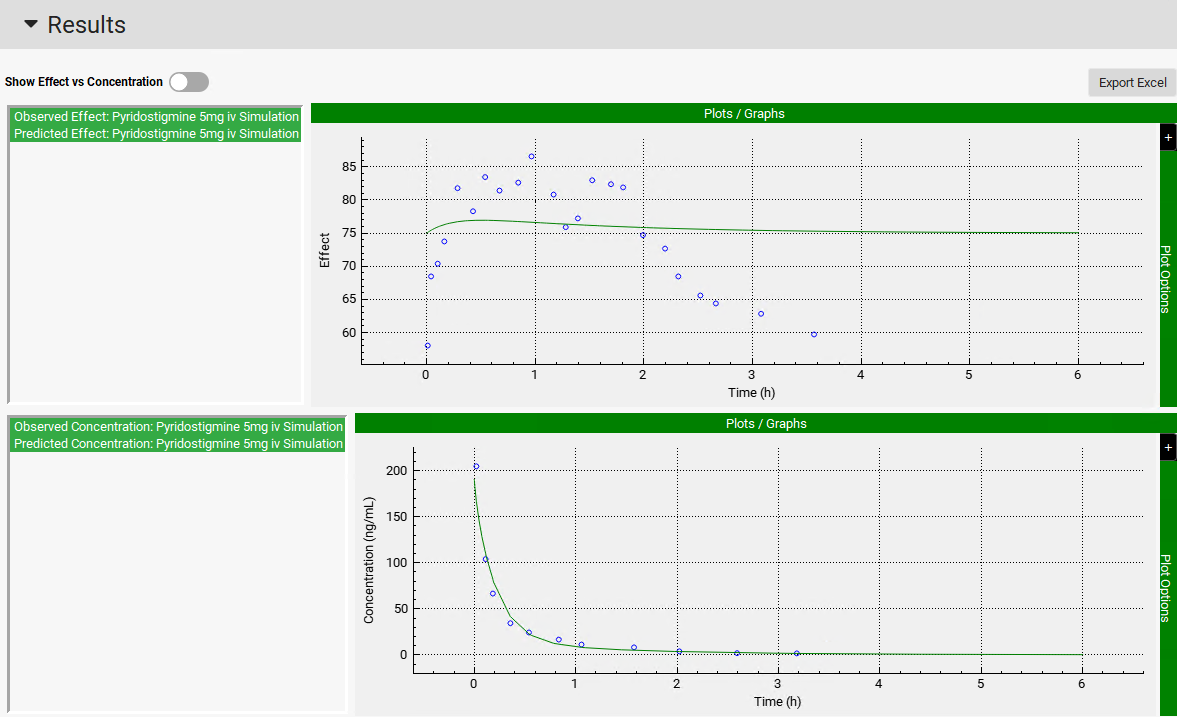
To make the predicted PD effect (green line) be close to the observed effect (blue circles), the PD model parameters should be optimized.
Change the Run Mode Type in the Model Parameters sub-panel from BatchSimulation to Optimization.

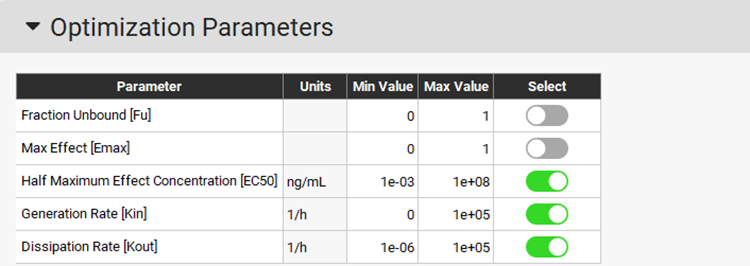
The Optimization Parameters sub-panel will be enabled. Choose EC50, Kin, and Kout as the PD parameters to be optimized by clicking on the toggle in the Select column next to the Parameter name (it will turn green if it is on).
Click on Optimize (the button is found next to the Run Mode Type, just above the Optimization Parameters sub-panel). The program proceeds to optimize the PD parameters to try to match the predicted and observed effect vs. time.
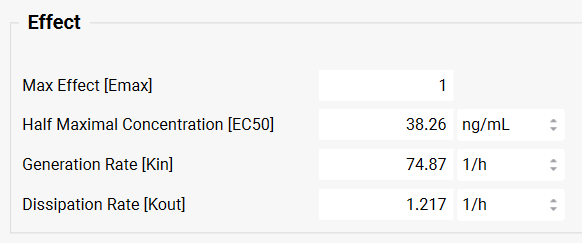
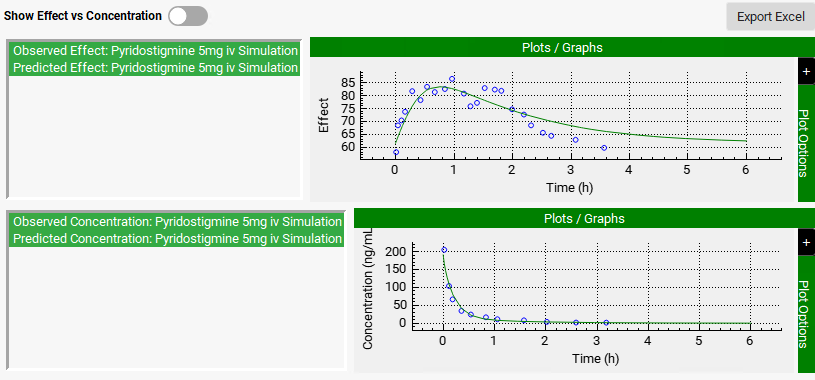
Once the PD parameters have been optimized, the fitted parameters are updated to the appropriate parameter input boxes in the Model Parameters sub-panel and a PD simulation is run. Note that predicted and observed PD profiles in the Results panel match well. The statistics of the PD fitting procedure are shown at the bottom of the Results panel.
To save the optimized PD model and parameters, click on Save button in the top right corner of the interface to save the project and press OK on the Save completed message.