Tutorial: User Defined Tissues
The PBPKPlus™ module, by default, contains 13 standard tissues, which are sufficient for most modeling purposes. However, for certain scenarios, additional tissues may be required to investigate drug accumulation in the respective tissue (e.g., tumor tissues for antineoplastic drugs). For these scenarios, GastroPlus® provides the ability to add custom tissues in the PBPKPlus™ module, enabling an accurate representation of the physiology of interest.
In this tutorial, a user-defined “Breast Carcinoma” tissue will be added to a female physiology. The necessary physiological parameters will be defined, and the accumulation of Tamoxifen in the tumor tissue (”Breast Carcinoma”) will be simulated.
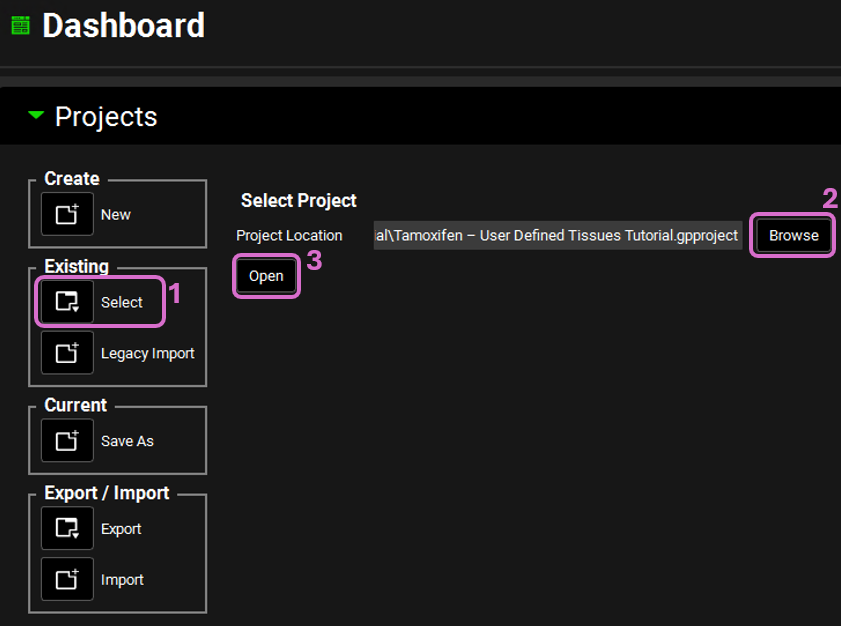
Open GPX™ and, in the Dashboard view, click on the icon next to Select to open an Existing project.
Click browse and navigate to the “C:\Users\<user>\AppData\Local\Simulations Plus, Inc\GastroPlus\10.2\Tutorials\User Defined Tissues” folder and select the project file “Tamoxifen - User Defined Tissues Tutorial.gpproject” by clicking on it and clicking Open.
Move through the views on the navigation pane from Compounds to Simulations, observing the information that has been entered in this project. It contains one compound called Tamoxifen, which was created with ADMET Predictor® import with slight changes in LogP and permeability. Dose was assigned as 90.23 mg single tablet administration. Physiology was set up as 61 years old female with moderate renal impairment. Intrinsic clearance of liver was set to 5183 L/h as tamoxifen mainly cleared by hepatic metabolism.
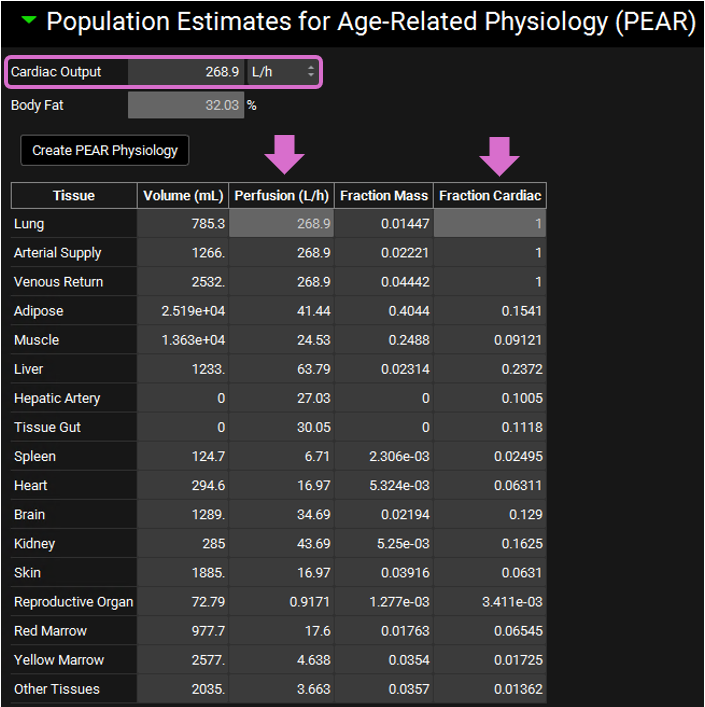
Click on the Physiologies view in the navigation pane and expand the PEAR panel (by double clicking the panel header or clicking on the green arrow.). Note that the total cardiac output is given at the top, and that the perfusion for each tissue is given in the table below. For each tissue, the fraction of blood flow that it receives (“Fraction Cardiac”) is also given, defined as the tissue perfusion divided by the cardiac output. Lung, Arterial Supply, and Venous Return all receive 100% of cardiac output by definition. The fractions of the remaining tissues should also sum up to 1. We will revisit this table after adding the user-defined tissue in the steps below.
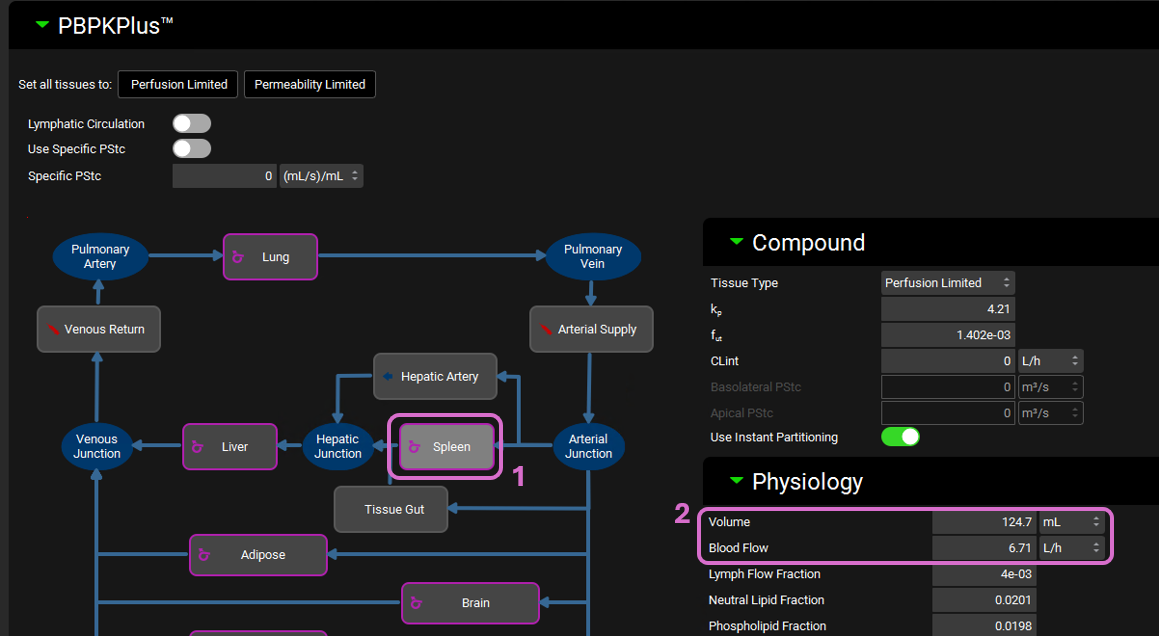
Click on the Pharmacokinetics view in the navigation pane and expand the PBPKPlus™ panel. Click on any tissue in PBPK and observe the parameters defining that tissue under Compound and Physiology subpanels.
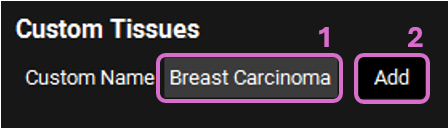
Scroll down to the Custom Tissues section below the PBPK diagram. Type “Breast Carcinoma” as the custom name and click the Add button.
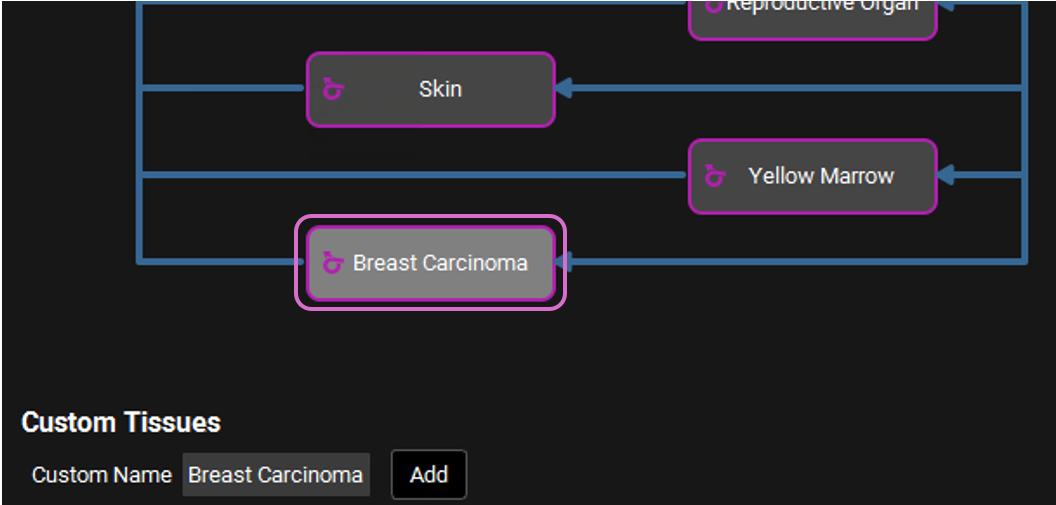
A new perfusion-limited tissue named as “Breast Carcinoma” should have been appended to the bottom of the PBPK diagram.
Click on the tissue to select it, and edit the tissue parameters in the Physiology subpanel, using the values in the table below. Leave all other tissue properties as the default values.
Parameter | Value |
Volume | 7.23 mL |
Blood Flow | 0.172 L/h |
Interstitial Volume Fraction | 0.23 |
User-defined tissues are treated the same as standard tissues in GastroPlus® PBPK models. As such, all features available for standard tissues (assigning an intrinsic clearance, adding enzyme or transporter expression, switching tissue model, etc.) can also be applied to user-defined tissues, depending on the project objectives.
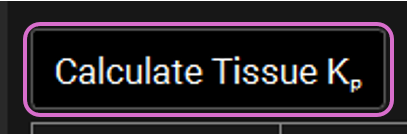
Click on Calculate Tissue Kp button to recalculate Kp values, including for the newly added “Breast Carcinoma” tissue.
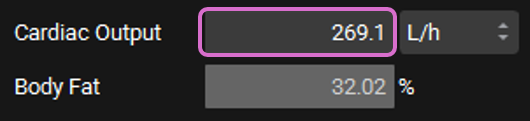
Click on the Physiologies view in the navigation pane and navigate back to PEAR. Observe that cardiac output is increased from 268.9 L/h to 269.1 L/h in order to compensate blood flow of the newly added Breast Carcinoma.
Cardiac Output is an editable parameter. Any changes to this parameter will rebalance of the tissue-specific perfusion values based on their respective cardiac fractions.
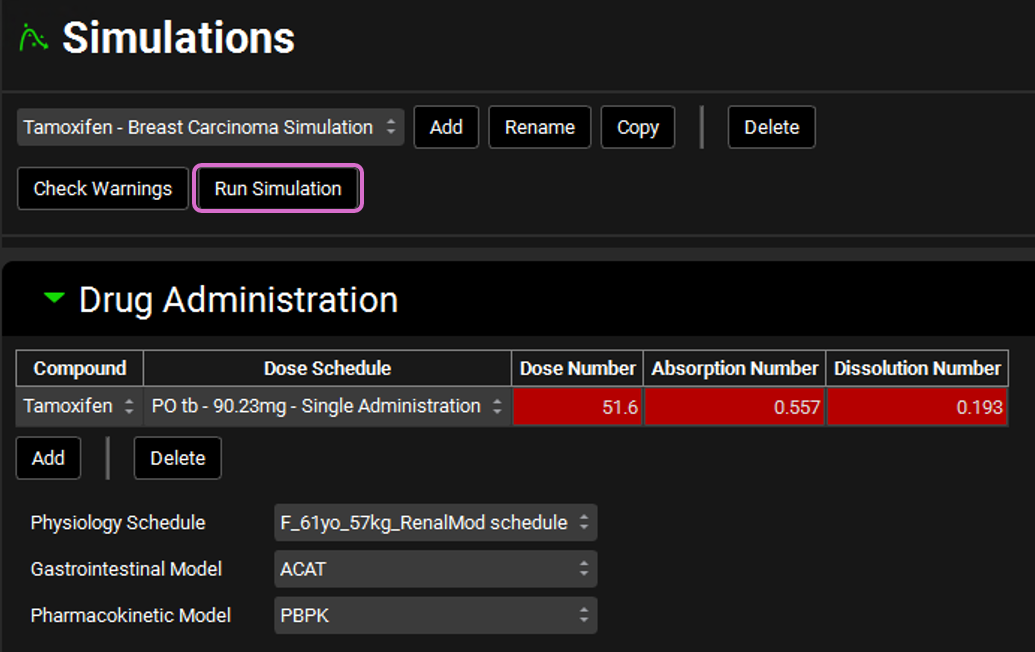
Click on the Simulations view in the navigation pane and run “Tamoxifen - Breast Carcinoma Simulation”.
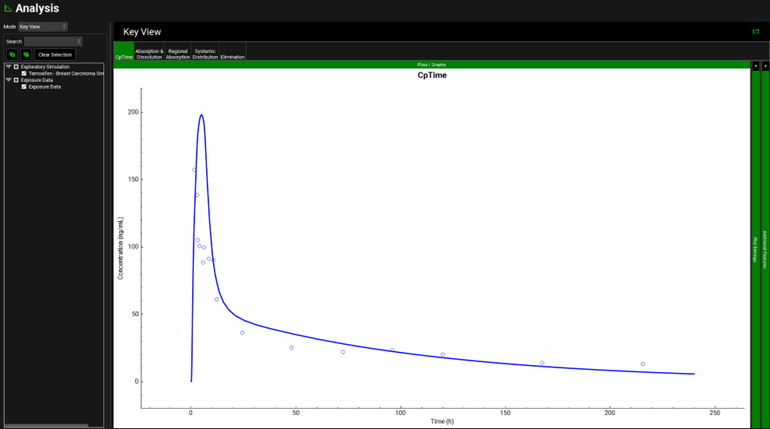
Once the simulation finishes, the program switches automatically to the Analysis view. The Cp-Time plot will be displayed in the Key View Mode.
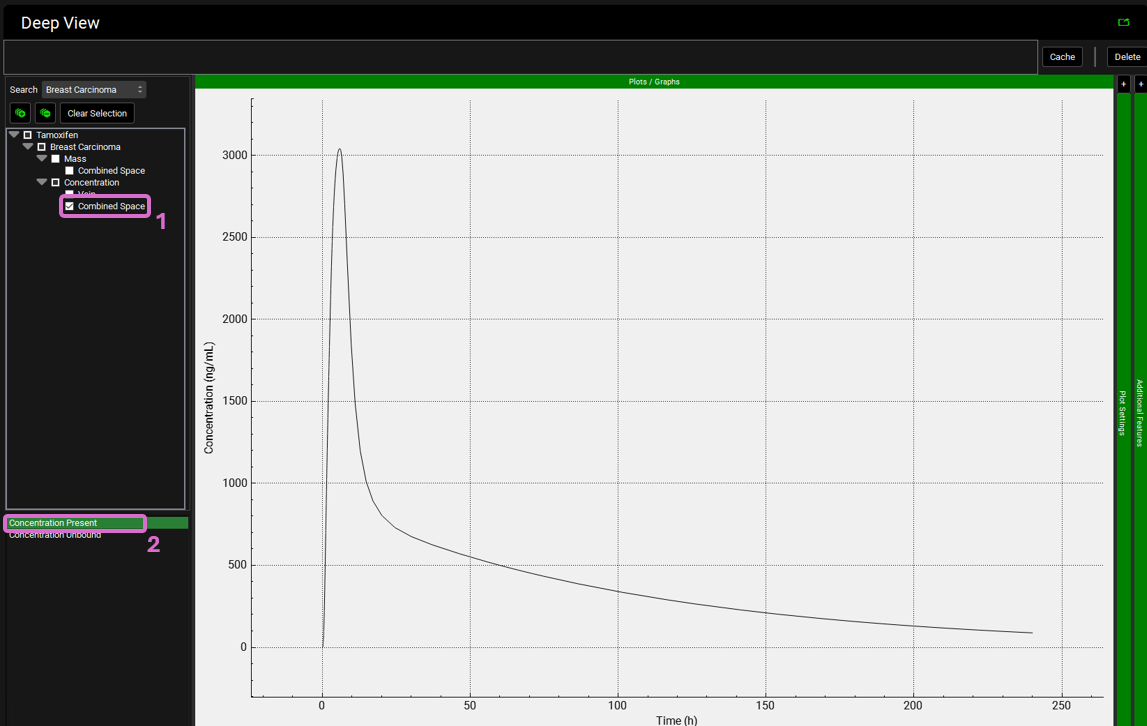
Select Deep View from the Mode drop-down list, type “Breast Carcinoma” into the Search box in Deep View panel and press Enter. This will bring all available plotting options for Breast Carcinoma tissue.
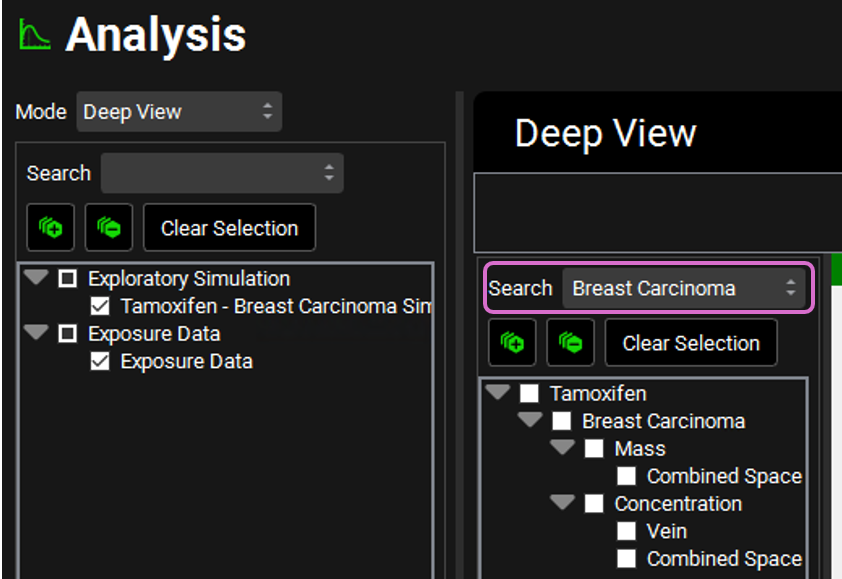
Expand Concentration in the series list tree by clicking on the gray arrow. Select Combined Space for Tamoxifen by clicking in the checkbox next to the series name. In the variables list at the bottom, select Concentration Present. This plot shows the predicted total concentration of Tamoxifen in breast cancer tissue, based on the physicochemical properties of the drug, and the custom tissue properties entered.