
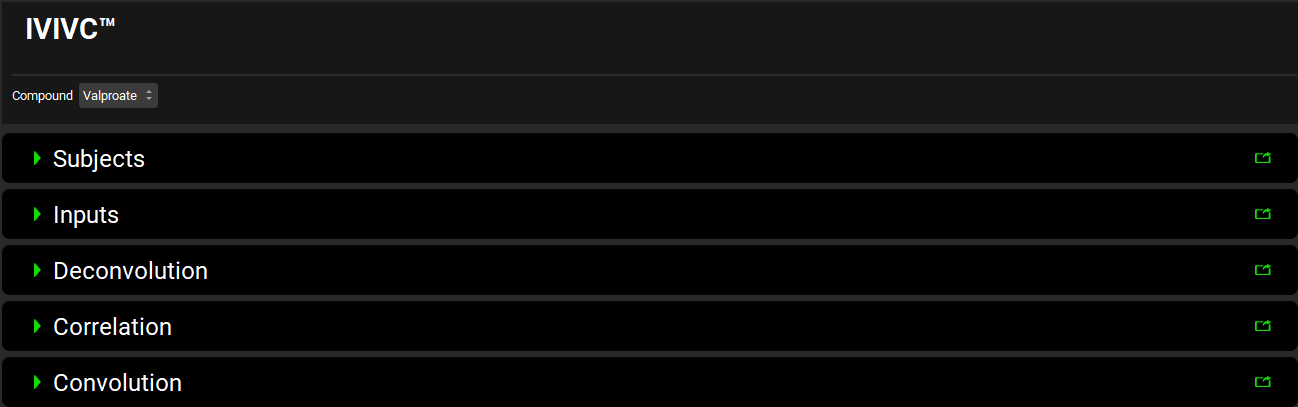
The IVIVCPlus™ view has five panels. All the inputs and options on these five panels (and where applicable, their sub-panels) are for building and validating IVIVC for the formulation. Before proceeding with building IVIVC, the baseline PK model for the compound needs to be set up, relevant observed data for target formulations (plasma concentration profiles and in vitro dissolution profiles) need to be entered, and baseline simulations need to be created.
See:
|
Input/Option |
Description |
|
Compound |
A drop-down. Selects the compound of interest. |
|
Subjects |
Specify subject physiologies. GastroPlus allows deconvolution of individual concentration profiles, and the physiologies may represent average subject physiology or physiologies for individual subjects for which the observed data was entered. |
|
Inputs |
Map in vitro and in vivo data for the formulations to be used to build and validate IVIVC, as well as in vitro data for new formulations for which the in vivo exposure will be predicted using IVIVC. |
|
Deconvolution |
Complete deconvolution (determine in vivo input rate) depending on the selected deconvolution method. |
|
Correlation |
Create correlation between the in vitro dissolution profile and the in vivo input profile. |
|
Convolution |
Complete convolution to either validate the correlation created in the Correlation panel or use the previously created correlation to predict exposure for a new formulation. |
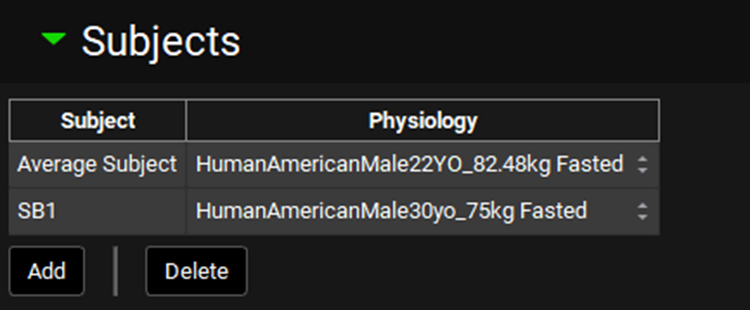
Subjects panel
In this panel, physiologies for subjects included in the analysis are assigned. The subjects may represent individual subjects included in the clinical study or an average/typical subject representing the population from the study. Physiologies need to be created in the Physiologies view before they can be assigned for use in the IVIVCPlus™ module.
|
Input/Option |
Description |
|
Table |
Table of subjects and their assigned physiologies. Add new entry into the table by clicking on the Add button below, specify a name for the subject and in the drop-down in the Physiology column select the physiology that represents that subject. |
|
Add/Delete |
Buttons to Add or Delete entries from the table. Note: To delete an entry, select the row using Ctrl + Click on one cell in the row of interest. |
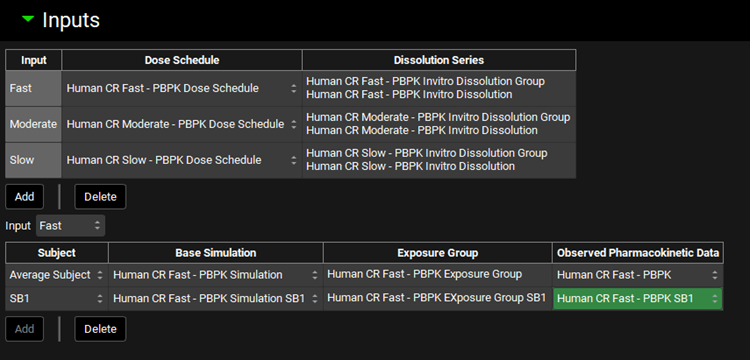
Inputs panel
In this panel, the in vitro and in vivo data for the formulations are assigned. Prior to making these assignments, the observed data need to be entered in the Observed Data view and baseline simulations need to be created for each subject (individual or average/typical) that will be included in the analysis.
|
Input/Option |
Description |
|
Top Table |
Use the top table to assign assets related to the formulations:
|
|
Input |
The drop-down is automatically populated by the Inputs (formulations) added to the Top Table. Select the Input to define corresponding in vivo data in the Bottom Table. |
|
Bottom Table |
In vivo information related to the Input selected in the drop-down above the table. The table has 4 columns:
|
|
Add/Delete |
Buttons to Add or Delete entries from the table located immediately above the buttons. Note: To delete an entry, select the row using Ctrl + Click on one cell in the row of interest. |
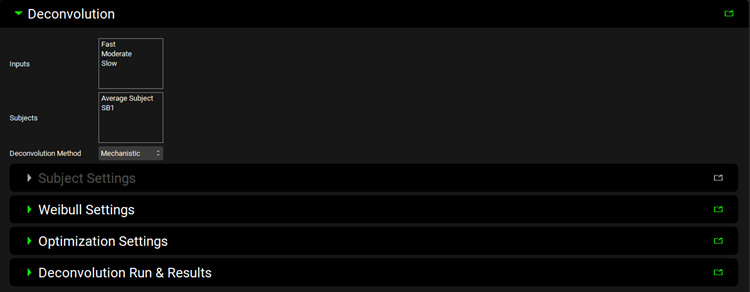
Deconvolution panel
Deconvolution step is defined and executed in this panel.
|
Input/Option |
Description |
|
Inputs |
Select Inputs (formulations) to use to generate IVIVC. This is populated according to the inputs added above. |
|
Subjects |
Select Subjects to use to generate IVIVC. This is populated according to the subjects added above. |
|
Deconvolution Method |
Select deconvolution method to obtain in vivo input rate for IVIVC. The following methods are available:
|
|
Subject Settings |
Sub-panel to estimate or define elimination rate constant or absorption rate constant and time lag (enabled only with WagnerNelson1 and Numerical Deconvolution Methods). |
|
Weibull Settings |
Sub-panel to select Weibull function type and define initial estimates (enabled only with Mechanistic and Numerical Deconvolution Methods). |
|
Optimization Settings |
Sub-panel to specify settings for optimization of the Weibull function (enabled only with Mechanistic and Numerical Deconvolution Methods). |
|
Deconvolution Run and Results |
Sub-panel to execute deconvolution step to obtain in vivo input rate and review the deconvolution results. |
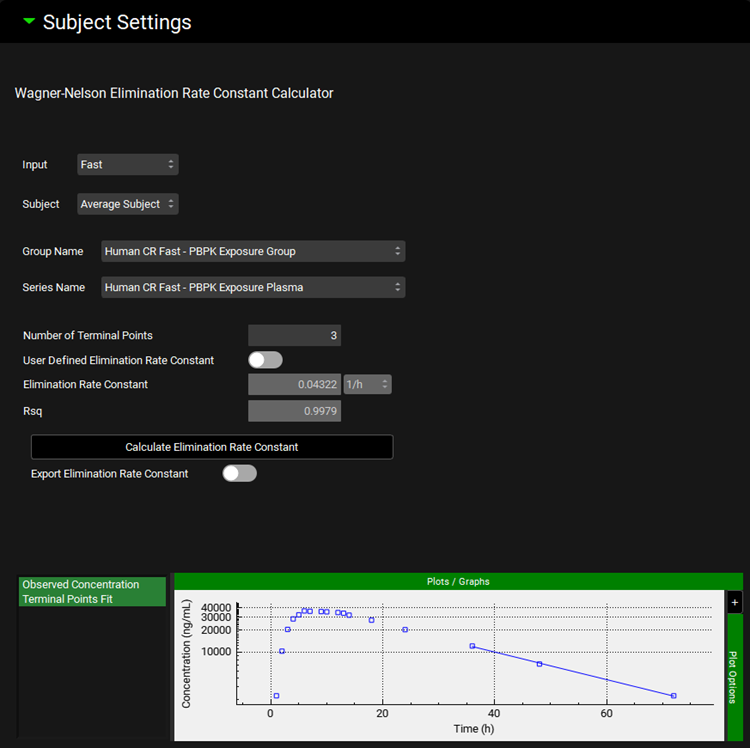
Subject Settings sub-panel
Sub-panel to estimate or define elimination rate constant or absorption rate constant and absorption time lag. The sub-panel is enabled only with WagnerNelson1 and Numerical Deconvolution methods and the view is dependent on the selected deconvolution method.
WagnerNelson1 Deconvolution Method
|
Input/Option |
Description |
|
Input |
Select Input (formulation) for which the calculated/defined elimination rate constant is applicable. Make sure to cycle through and define settings for all Inputs selected for the deconvolution step. |
|
Subject |
Select Subject for which the calculated/defined elimination rate constant is applicable. Make sure to cycle through and define settings for all Subjects selected for the deconvolution step. |
|
Group Name |
Select Observed Data Group containing Series from which the elimination rate constant will be calculated. This may be different than Observed Data Group representing in vivo data for the given Input (Formulation). |
|
Series Name |
Select Observed Data Series from which the elimination rate constant will be calculated. This may be different than Observed Data Series representing in vivo data for the given Input (Formulation). A series where terminal phase is impacted only by compound’s clearance/elimination should be used to estimate the elimination rate constant. |
|
Number of Terminal Points |
Specify number of terminal points from the selected Observed Data Series that will be used to calculate the elimination rate constant. |
|
User Defined Elimination Rate Constant |
A toggle. Turn the toggle ON to enter the Elimination Rate Constant manually. When the toggle is turned OFF the Elimination Rate Constant will be calculated from the selected Observed Data Series upon clicking Calculate Elimination Rate Constant button. |
|
Elimination Rate Constant |
Elimination rate constant calculated from the Observed Data Series after clicking Calculate Elimination Rate Constant button when User Defined Elimination Rate Constant toggle is turned OFF. Enter Elimination Rate Constant when the User Defined Elimination Rate Constant toggle is turned ON. |
|
Rsq |
Coefficient of determination representing the fit of the elimination rate constant (applicable only when Elimination Rate Constant was calculated from the selected Observed Data Series). |
|
Calculate Elimination Rate Constant |
Click the button to calculate Elimination Rate Constant from the Observed Data Series (enabled only when User Defined Elimination Rate Constant toggle is OFF). |
|
Export Elimination Rate Constant |
A toggle. Turn this toggle ON to use the Elimination Rate Constant from this sub-panel in the deconvolution step. Elimination Rate Constant for deconvolution will be calculated from clearance and volume of distribution defined in the compartmental PK model when this toggle is OFF. Make sure to cycle through and Export Elimination Rate Constant for all Inputs, including inputs that were not used for building the IVIVC. |
|
Plot Window |
Selected Observed Data Series (points) and line representing the calculated elimination rate constant. |
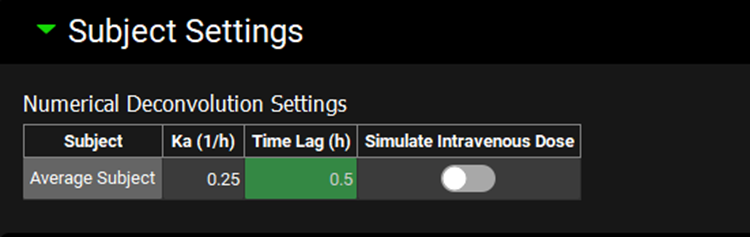
Numerical Deconvolution Method
|
Input/Option |
Description |
|
Subject |
Subjects selected for the Deconvolution step. |
|
Ka |
Enter absorption rate constant. If the value was previously exported from PKPlus™ for current baseline simulation (i.e. after fitting compartmental PK parameters against oral profiles) it will be displayed here. |
|
Time Lag |
Enter time lag in the absorption. If the value was previously exported from PKPlus™ for current baseline simulation (i.e. after fitting compartmental PK parameters against oral profiles) it will be displayed here. |
|
Simulate Intravenous Dose |
A toggle. Turn the toggle ON to treat the input function as IV dose, turn the toggle OFF to treat the input function as oral dose. |
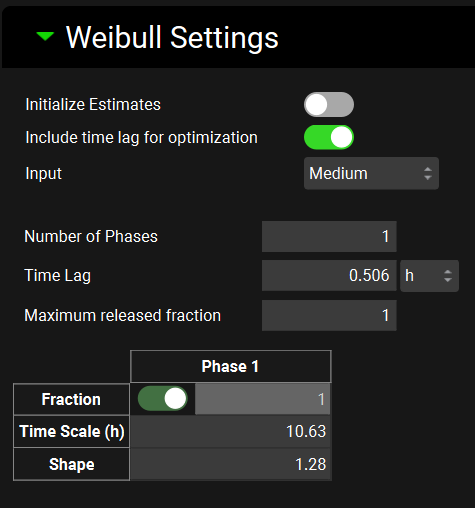
Weibull Settings sub-panel
Weibull function type and initial estimates are defined in this sub-panel (enabled only with Mechanistic and Numerical Deconvolution Methods).
|
Input/Option |
Description |
|
Initialize Estimates |
A toggle. Turn the toggle ON to have the program determine the initial estimates for Weibull parameters from the in vitro dissolution profile. Turn the toggle OFF to enter the initial parameter estimates manually. |
|
Include time lag for optimization |
A toggle. Turn the toggle ON to include time lag in the Weibull function optimization. Time lag zero will be used when the toggle is OFF. |
|
Input |
Select Input (formulation) for which the settings apply. The drop-down includes all Inputs selected in the Inputs section of the Deconvolution panel (make sure to cycle through and define settings for all Inputs in the drop-down). |
|
Number of Phases |
Enter number of phases for Weibull function (enter 1, 2, or 3 for single-, double-, or triple-Weibull function, respectively) for the selected Input. |
|
Time Lag |
Enter initial estimate for Time lag in the Weibull function for the selected Input (formulation). Visible and applicable only when Initialize Estimates toggle is turned OFF and Include time lag for optimization toggle is turned ON. |
|
Maximum released fraction |
Enter initial estimate for the maximum fraction of the dose released in vivo for the selected Input (formulation). Visible only when Initialize Estimates toggle is turned OFF. |
|
Initial estimates table |
Enter initial estimates of Fraction, Time Scale and Shape parameters for each phase of the Weibull function for the selected Input (formulation). Visible only when Initialize Estimates toggle is turned OFF. |
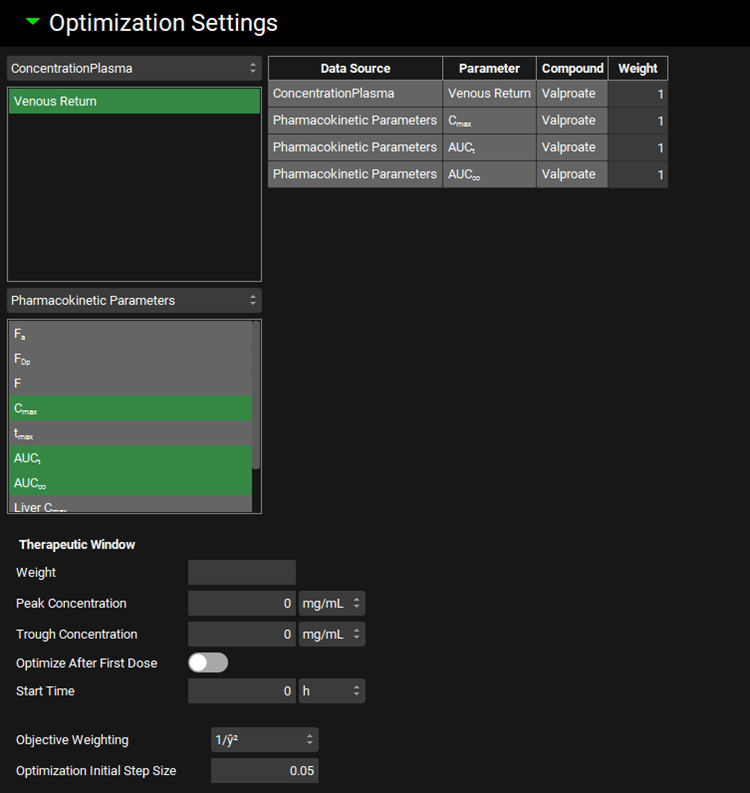
Optimization Settings sub-panel
Observed data weight and objective function weight for Weibull function optimization are defined in this sub-panel. The sub-panel is enabled only with Mechanistic and Numerical Deconvolution Methods.
|
Input/Option |
Description |
|
Observation weights |
Select target concentration time profiles and pharmacokinetics parameters to be used as target in the Weibull function optimization and assign Weights for the selected observed data. The Weights are relative values – the observed data with higher assigned Weight will have bigger impact on the optimization of Weibull function. Only available with Mechanistic deconvolution method. |
|
Data Source |
Indicates the data source type for the observation. Corresponds to the Series and Parameter Type Drop-downs. Only available with Mechanistic deconvolution method. |
|
Parameter |
Indicates the specific series or summary parameter. Only available with Mechanistic deconvolution method. |
|
Compound |
Indicates the compound to which the parameter applies. Only available with Mechanistic deconvolution method. |
|
Weight |
Gives the weight assigned to the observation, with a default value of 1. This value can be edited. The weight is used as a multiplier for the error between simulation and observed values for the parameter during calculation of the overall objective function during optimization. Increasing this value will increase the weight assigned to this error (and thus the impact on optimization), while decreasing this value will decrease the weight. A value of 0 will effectively ignore this observation during optimization. Observation weight can be used in two ways. First, it can be used to emphasize a given parameter, such as putting greater weight on plasma concentrations than mass in urine, if desired for a particular scenario. Second, it can be used to adjust for differences in units between observed data. For example, while concentrations are measured in mass per volume, bioavailability is measured as a percent, which can give undue weight to one scale if calculating the objective function using absolute error. As such, observation weight can be used to compensate for this phenomenon. Only available with Mechanistic deconvolution method. |
|
Therapeutic window |
Assign Therapeutic Window parameters to use it as additional target in the optimization. Applicable with multiple-dose optimizations. Following parameters need to be specified for Therapeutic Window:
|
|
Objective Weighting |
Select weighting function to calculate the weighted sum of squared errors during optimization. Options are: Uniform (unity), 1/y, 1/y2, 1/ŷ, 1/ŷ2, 1/(y+ ŷ), 1/(y+ ŷ)2, 1/σ2 with σ from observed exposure data CV, 1/σ2 with σ calculated from observed exposure data, and 1/σ2 with σ interpolated from user specified CV. 1/ŷ2 is the default selection. |
|
Optimization Initial Step Size |
Relative initial change in the optimized parameters. Default value is 0.05. |
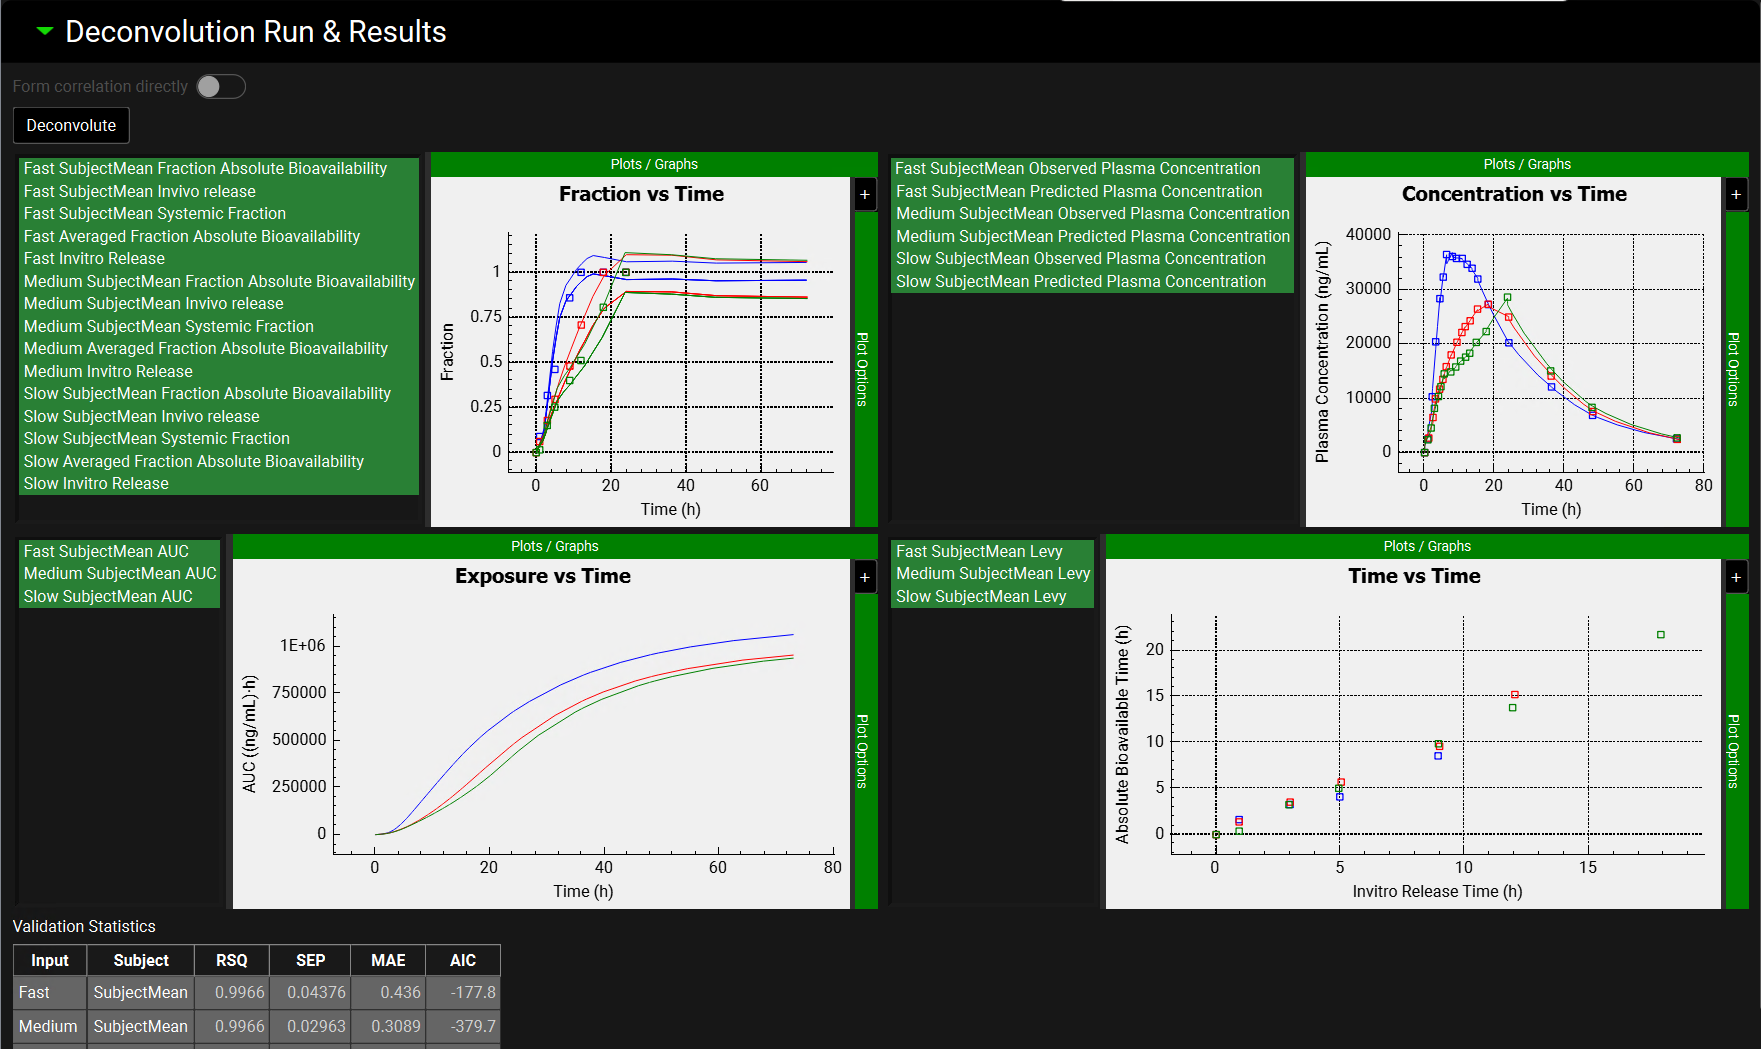
Deconvolution Run & Results sub-panel
Deconvolution step is executed, and deconvolution results can be reviewed in this sub-.panel.
Deconvolution Run & Results sub-panel, plots after Loo Riegelman 2 deconvolution method
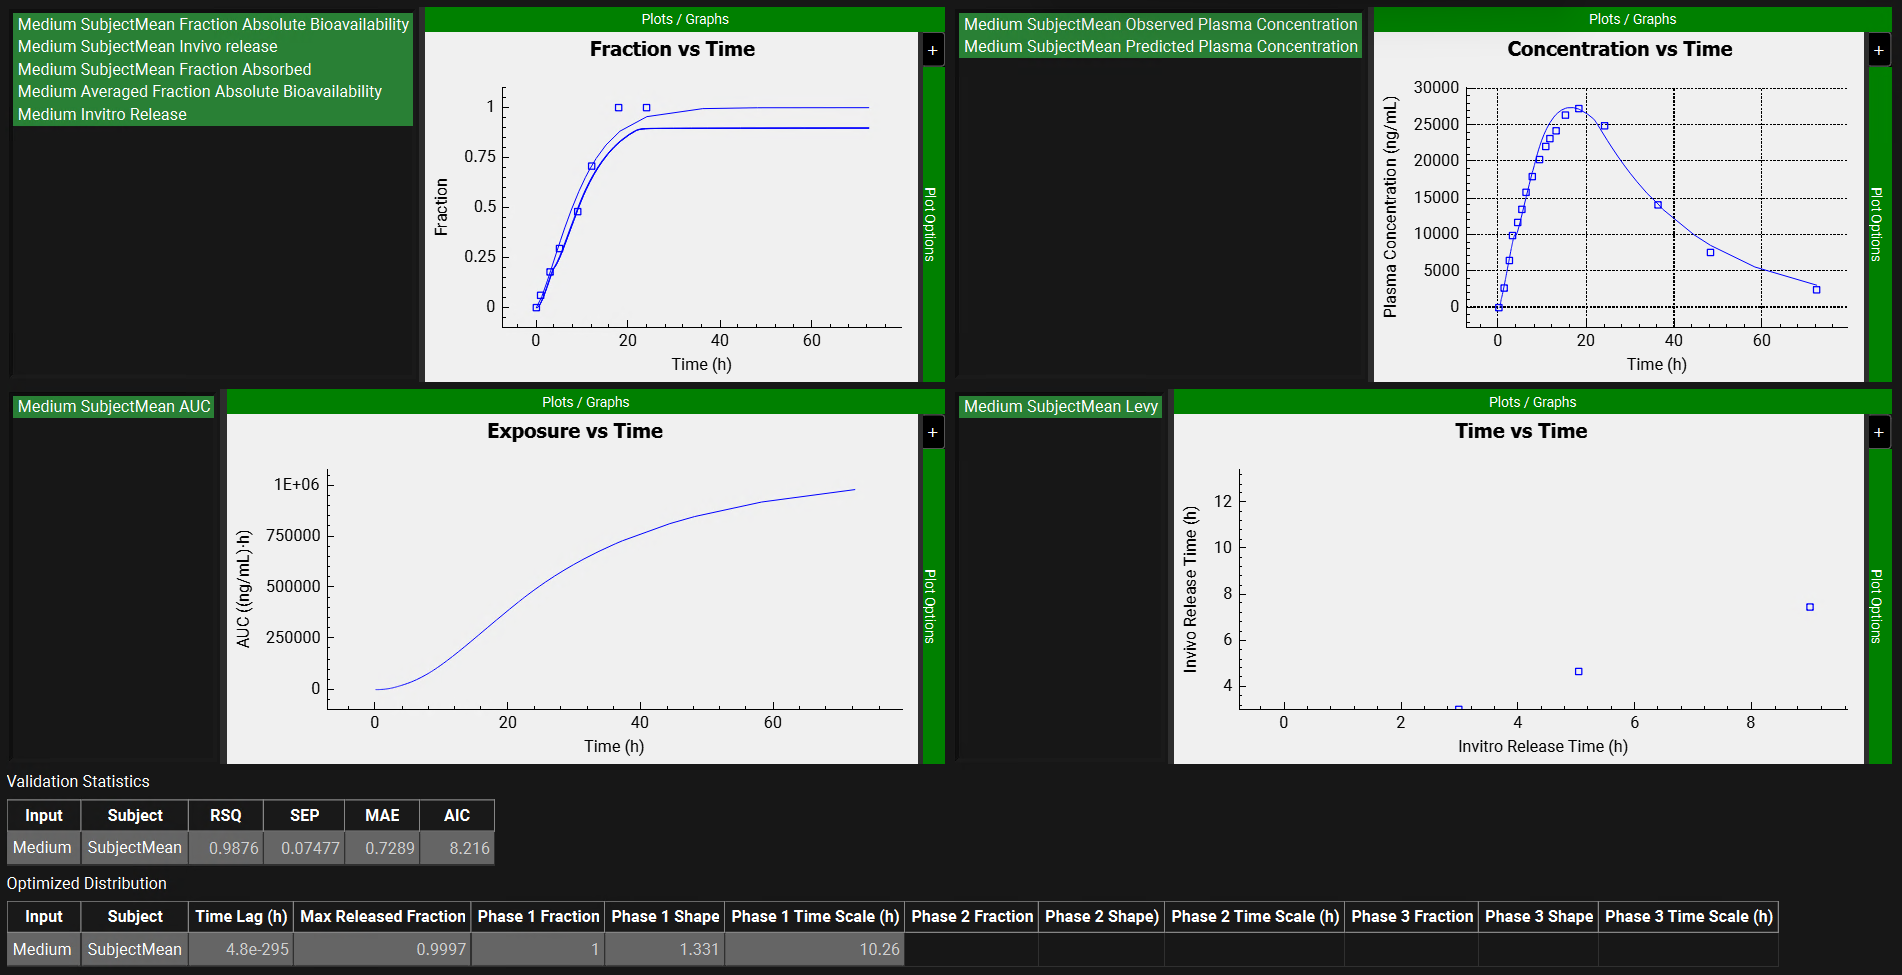
Deconvolution Run & Results sub-panel, plots after Mechanistic deconvolution method
|
Input/Option |
Description |
|
Form correlation directly |
A toggle. Turn this toggle ON to perform one-step deconvolution/correlation. When the toggle is ON, the Deconvolute button will be disabled as the deconvolution is performed along with correlation directly in the Correlation panel. |
|
Deconvolute |
Click the button to execute Deconvolution using the settings defined in the previous panels and sub-panels. |
|
Plots |
Plots summarizing deconvolution results:
|
|
Validation Statistics table |
Table that displays the goodness of the simulated profiles based on deconvoluted in vivo input rates for all selected Inputs (Formulations). Input: Inputs selected for deconvolution Subject: Subjects selected for deconvolution The calculated statistics include coefficient of determination (RSQ),standard error of estimate (SEP), mean absolute error (MAE), and Akaike information criterion (AIC). |
|
Optimized Distribution table |
Table that displays the optimized Weibull parameters after the deconvolution is performed. Input: Inputs selected for deconvolution Subject: Subjects selected for deconvolution The Weibull parameters displayed on this table will be according to the settings in the Weibull Settings panel. Applicable only for Mechanistic and Numerical deconvolution methods. |
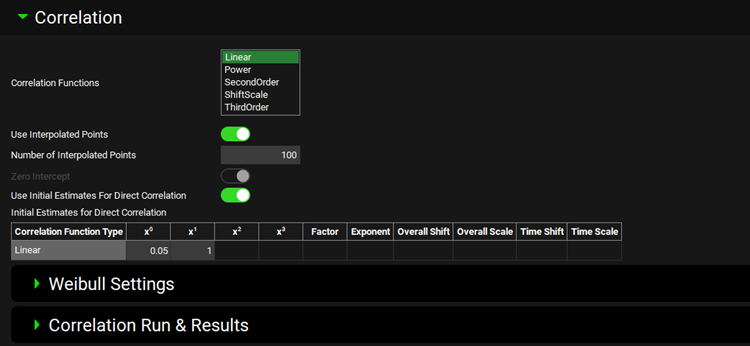
Correlation panel
Correlation between in vitro and in vivo input profiles is created in this panel.
|
Input/Option |
Description |
|
Correlation Functions |
Select correlation functions to fit. Multiple correlation functions can be selected when using two-step process (Deconvolution then Correlation); a single correlation function needs to be selected when using Direct Correlation (single-step IVIVC). Available Correlation Functions: Linear, Power, Second Order, Shift Scale, Third Order. |
|
Use Interpolated Points |
A toggle. Turn the toggle ON to use an interpolated in vitro dissolution profile when fitting the correlation function. |
|
Number of interpolated points |
Specify the number of interpolated data points to use in the correlation function fitting. Applicable only when Use Interpolated Points toggle is turned ON. |
|
Zero Intercept |
Force zero intercept when fitting the correlation function. |
|
Use Initial Estimates for Direct Correlation |
A toggle. Turn the toggle ON to manually enter initial estimates for the correlation function. Enabled only when Form correlation directly toggle is turned ON in the Deconvolution section. |
|
Initial Estimates for Direct correlation |
Enter initial estimates of parameters relevant for the selected correlation function. Displayed only when Use Initial Estimates for Direct Correlation toggle is turned ON. The columns are enabled depending on the selected Correlation Function Type. Correlation Function Type – name of the correlation function. X0 – Intercept in the Linear, SecondOrder and ThirdOrder functions. X1 – coefficient for the linear term in the Linear, SecondOrder, and ThirdOrder functions. X2 – coefficient for the quadratic term in the SecondOrder and ThirdOrder functions. X3 – coefficient for the cubic term in the ThirdOrder functions. Factor – coefficient for the scaling factor in the Power function. Exponent – exponent in the Power function. Overall Shift – release shift coefficient in the ShiftScale function. Overall Scale – release scale coefficient in the ShiftScale function. Time Shift – time shift coefficient in the ShiftScale function. Time Scale – time scale coefficient in the ShiftScale Function. |
|
Weibull Settings |
Sub-panel to select Weibull function type and define initial estimates for fitting Weibull function to in vitro dissolution data (enabled only when User Interpolated Points toggle is turned ON). |
|
Correlation Run & Results |
Sub-panel to execute the correlation run and review the results. |
Weibull Settings sub-panel
When the option to use interpolated data points for correlation function fitting is selected, the in vitro release profile is represented by the Weibull function. The settings for fitting the Weibull function to in vitro dissolution data are specified in this sub-panel.
|
Input/Option |
Description |
|
Input |
Select Input (formulation) for which the settings apply. The drop-down includes all Inputs selected in the Inputs section of the Deconvolution panel (make sure to cycle through and define settings for all Inputs in the drop-down). |
|
Number of Phases |
Enter number of phases for Weibull function (enter 1, 2, or 3 for single-, double-, or triple-Weibull function, respectively) for the selected Input. |
|
Time Lag |
Enter initial estimate for Time lag in the Weibull function for the selected Input (formulation). |
|
Maximum released fraction |
Enter initial estimate for the maximum fraction of the dose released in vitro for the selected Input (formulation). |
|
Initial estimates table |
Enter initial estimates of Fraction, Time Scale and Shape parameters for each phase of the Weibull function for the selected Input (formulation). |
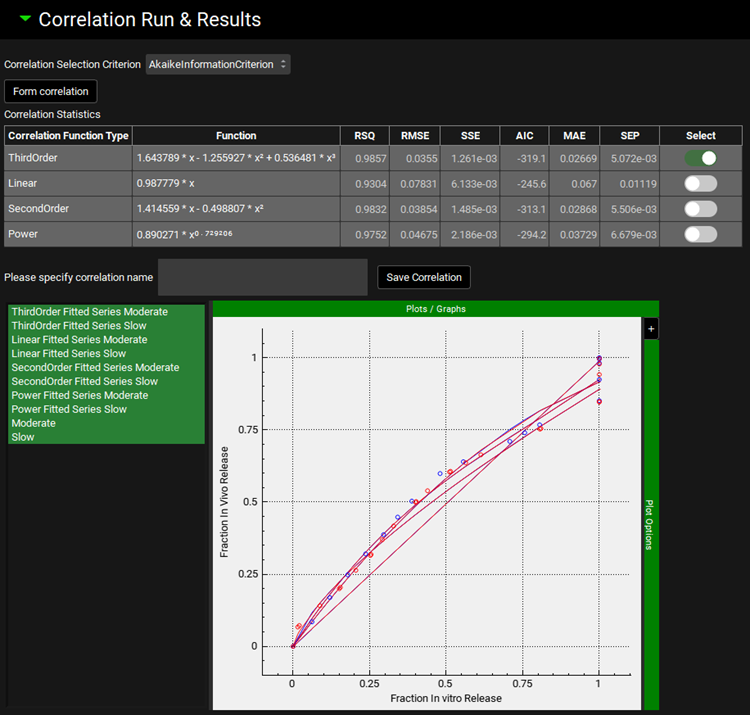
Correlation Run & Results sub-panel
Correlation step is executed, and the results can be reviewed in this sub-panel.
|
Input/Option |
Description |
|
Correlation Selection Criterion |
A drop-down. Select criterion for selecting the best correlation function when multiple correlation functions are fitted. When option AkaikeInformationCriterion, MeanAbsoluteError, Rsquare, RootMeanSquareError, StandardErrorPrediction, or SumSquaredError is selected, program automatically selects the best correlation function based on the selected statistics. When User option is selected, all statistics criteria are displayed in the Correlation Statistics table, and it is up to the user to select the preferred correlation function. |
|
Form Correlation |
Click this button to form correlation between the in vitro dissolution and deconvoluted in vivo input. |
|
Correlation Statistics |
Table summarizing statistics for all fitted correlation functions. Correlation Function Type: displays the correlation types according to the selection made under the Correlation panel. Function: displays the fitted equation for the specific function type to the left. The calculated statistics include coefficient of determination (RSQ), root mean squared error (RMSE), sum of squared errors (SSE), Akaike information criterion (AIC), mean absolute error (MAE), and standard error of estimate (SEP). When User option is selected in the Correlation Selection Criterion drop-down, the Select column is enabled for User’s selection of the best correlation function. With any other Correlation Selection Criterion, the best correlation function is selected automatically by the program and the Select column is disabled. In this case, the best correlation function based on the criterion selected will have the toggle ON. |
|
Please specify correlation name/ Save Correlation |
Enter a name for the best correlation function in the text box and click Save Correlation button to be able to reuse the correlation to predict in vivo performance for new formulations in the future. |
|
Plot |
Points represent deconvoluted in vivo input rate vs in vitro dissolution rate, lines represent individual fitted correlation functions. |
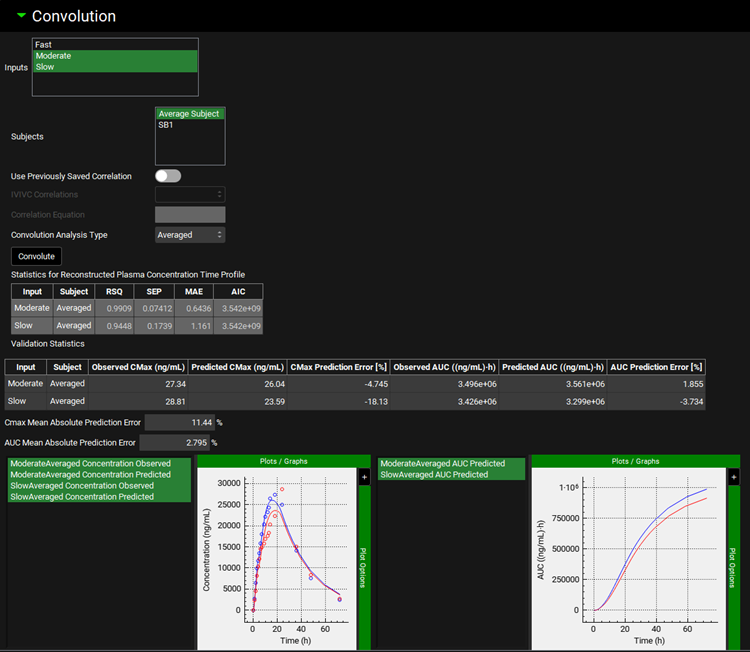
Convolution Panel
Convolution step is executed in this panel. This may include the same Inputs (formulations) as used for Deconvolution and Correlation to perform internal IVIVC validation; or may include different Inputs (formulations) to perform external IVIVC validation (if in vivo data for given Input (formulation) is available) or simply predict in vivo performance for new formulation.
|
Input/Option |
Description |
|
Inputs |
Select inputs (formulations) to predict in vivo exposure using created IVIVC. |
|
Subjects |
Select Subjects to predict in vivo exposure using created IVIVC. |
|
Use Previously Saved Correlation |
A toggle. Turn the toggle ON to use one of the previously saved correlations. The most recently created correlation will be used for convolution when the toggle is turned OFF. |
|
IVIVC Correlations |
Select the correlation to use for convolution. Enabled when Use Previously Saved Correlation toggle is turned ON. The most recently created correlation will be used for convolution when the toggle is turned OFF. |
|
Correlation Equation |
Equation representing correlation selected in the IVIVC Correlations drop-down. |
|
Convolution Analysis Type |
Select option Averaged or Individual to perform average prediction of in vivo exposure or prediction for individual subjects selected in the Subjects section. |
|
Convolute |
A button. Predict in vivo exposure for the selected Inputs (formulations) and Subjects using the selected IVIVC correlation. |
|
Statistics for Reconstructed Plasma Concentration Time Profile |
If observed plasma concentration time profiles are available and mapped in the Inputs panel for Inputs (formulations) selected for Convolution, the statistics comparing simulated and observed profiles are displayed in this table. The calculated statistics include coefficient of determination (RSQ), standard error of estimate (SEP), mean absolute error (MAE), and Akaike information criterion (AIC). |
|
Validation Statistics |
If observed plasma concentration time profiles are available and mapped in the Inputs panel for Inputs (formulations) selected for Convolution, the observed and predicted Cmax and AUC values along with the prediction errors are summarized in this table. |
|
Cmax Mean Absolute Prediction Error |
Mean absolute prediction error for Cmax across all Inputs (formulations) selected for Convolution for which observed plasma concentration time profiles are available and mapped in the Inputs panel. |
|
AUC Mean Absolute Prediction Error |
Mean absolute prediction error for AUC across all Inputs (formulations) selected for Convolution for which observed plasma concentration time profiles are available and mapped in the Inputs panel. |
|
Plots |
Plots showing predicted (and observed if available) plasma concentration vs time profiles and AUC vs time profiles for Inputs (formulations) selected for Convolution. |