
In GastroPlus®, transcellular absorption and paracellular absorption are treated as separate processes, and the total rate of absorption of a drug is calculated as the sum of these two processes. Also, when modeling drug absorption, if both passive absorption and saturable carried-mediated transport (active transcellular absorption) are relevant, then you must also consider these two processes. See:
Effective permeability and absorption rate coefficient for passive transcellular absorption
Absorption Scale Factor (ASF) models are available in GastroPlus® for modeling passive transcellular absorption. Two variables, effective permeability and the absorption rate coefficient, impact these models.
As shown in Figure 1-5, the effective permeability of a drug, Peff, in human is calculated by measuring the rate of disappearance of a drug from the donor side in a section of the GI tract at steady state1 2 3.
Figure 1-5: Effective permeability measurement in human
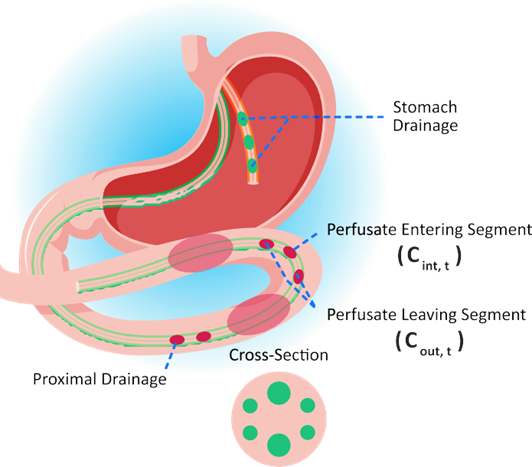
Equation 1-43 and Equation 1-44 show the calculations that are involved in estimating Peff and the absorption rate coefficient ka', where Equation 1-44 was created by rearranging and setting concentration (C) = Mass (M)/Volume (V).
Equation 1-43: Effective permeability calculation
where:
|
Variable |
Definition |
|
|
The volumetric flow rate. |
|
|
The total concentration of drug in the input port. |
|
|
The total concentration of drug in the output port. |
|
|
The radius of the perfused section.* |
|
|
The length of the perfused section.* |
|
Note: *For the experiments described here, values are constant: r = 1.75 cm. L = 10 cm. |
|
Equation 1-44: Absorption rate coefficient calculation
In GastroPlus®, the absorption rate coefficient, ka', for each compartment (i) is the product of the effective permeability value (Peff) for the compartment and the absorption scale factor (ASF) for the compartment. The theoretical ASF value for any compartment is the ratio of the surface area to the volume, which reduces to 2/r, where r is the compartment radius.

This absorption rate coefficient is designated as ka' rather than ka to emphasize that this time-dependent rate coefficient is not the same as the traditional absorption rate constant ka.
If Peff measurements were available for all compartments, then all other factors that could cause variation in Peff from one compartment to the next would be accounted for in the measured Peff values. As a result, the 2/r value would be the correct value to use in all compartments. Such data, however, is generally not available, which means that adjustments to the absorption rate coefficient, ka', must be estimated from other data.
The ASFs account for changes in passive transcellular permeability caused primarily by changes in ionization and distribution coefficient.
Passive transcellular absorption into the enterocyte sub-compartments from each intestinal lumen compartment employs this time-dependent linear rate coefficient ka' that can be different in each compartment. Equation 1-45 shows the calculation for this absorption.
Equation 1-45: Absorption rate calculation for passive transcellular absorption
where:
|
Variable |
Definition |
|
|
Indicates a particular intestinal compartment. |
|
|
The rate of absorption in the jth intestinal compartment. |
|
|
The volume of the lumen in the jth intestinal compartment. |
|
|
The absorption rate coefficient for the jth intestinal compartment. |
|
|
The total concentration of drug in the lumen for the jth intestinal compartment. |
|
|
The concentration of unbound drug in the enterocyte sub-compartment of the jth intestinal compartment. |
GastroPlus® absorption models assume that only dissolved drug is subject to absorption.
Absorption Scale Factor (ASF) models for passive transcellular absorption
Pade and coworkers measured the Caco-2 cellular permeability for a diverse set of acidic and basic drug molecules at two pH values4. They concluded that the permeability coefficients of the acidic drugs were greater at pH 5.4, whereas that of the basic drugs were greater at pH 7.2. They also concluded that the transcellular pathway was the favored pathway for most drugs, most likely due to its larger accessible surface area. The paracellular permeability of the drugs was both size dependent and charge dependent. The permeability of the drugs through the tight junctions decreased with increasing molecular size. Further, the pathway also appeared to be cation-selective, with cationic weak bases permeating the aqueous pores of the paracellular pathway at a faster rate than anionic weak acids. Thus, the extent to which the transcellular route and the paracellular route are used in drug transport is influenced by the following factors:
-
The fraction of ionized and unionized species, which, in turn, depends upon the pKa of the drug and the pH of the solution in the GI tract.
-
The intrinsic partition coefficient of the drug.
-
The size and shape of the drug molecule.
-
The molecular charge.
Figure 1-6 is a representation of regional permeability coefficients of 19 drugs with different physicochemical properties determined by Ungell et. al. using excised segments from three regions of rat intestine: the jejunum, the ileum, and the colon5.
Figure 1-6: Representation of regional permeability coefficients as a sphere plot of Log D vs. jejunal permeability
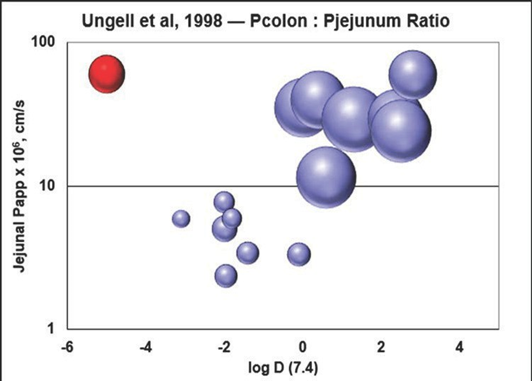
They observed a significant decrease in permeability to hydrophilic drugs and a significant increase in permeability for hydrophobic drugs aborally to the small intestine (P < 0.0001). Figure 1-6 illustrates that, for hydrophilic drugs (low permeability and low log D), the ratio of colon:jejunal permeability was less than one, while for hydrophobic drugs (higher permeability and higher logD), the ratio of colon:jejunal permeability was greater than one. At certain pH values, the permeability of small hydrophilic drugs might have a large percent of their total permeability due to the paracellular pathway6 and it is well known that the transepithelial electrical resistance (TEER) of the colon is much higher than that of the small intestine. TEER increases as the width of tight junctions decrease and the tight junction width has been determined to be 0.75-0.8 nm in jejunum, 0.3-0.35 nm in ileum, and 0.2-0.25 nm in colon. The narrower, tight junctions in colon suggest that paracellular transport is much less significant in the colon, which helps to explain the lower ratio of colon:jejunal permeability for hydrophilic drugs.
Six models are available in GastroPlus® for calculating and scaling the ASFs in the various intestinal compartments.
-
User-Defined. See User defined model.
-
Three log D models. See logD models.
-
Theoretical. See Theoretical model.
-
Theoretical SA/V. See Theoretical SA/V model.
User-defined model
With the User-Defined model, you can manually change any of the values, or you can use the Optimization module to automatically fit the values to your data. Typically, you do this by first selecting the Theoretical model or one of the logD models to initialize the values, then adjust these values, either manually or with the Optimization module to achieve the best fit. You can also directly adjust the ASFs to fit the absorption behavior of a particular compound.
For information about the Optimization module, see the GastroPlus® Optional Modules User Guide.
logD models
The logD model and its variations that are discussed in this section are a “general” model – that is, the best compromise model across a diverse set of compounds. The utility of a logD model is in discovery screening, wherein rank ordering of a series of compounds by fraction absorbed enables you to identify the compounds within a group that are most and least likely to be well-absorbed. You can develop more accurate “drug-specific” models when you have sufficient data for a particular compound.
All three logD models—logD model, Opt logD model, and Opt logD model SA/V 6.1—are based on the premise that a linear relationship with a negative slope exists between the deviation of the logD from the neutral logP and the change in the log of the effective permeability at the pH for the logP and at the pH for the logD. In other words, as the ionized fraction of a compound increases, the effective permeability, Peff, decreases.
logD model
The logD model uses simplified calculations for ASF in the small intestine and the colon, with the gut geometry approximated by a cylinder and not taking into account any contribution from villi or microvilli. Equation 1-46 shows the calculation for ASF in the small intestine using the logD model. Because jejunal Peffs are measured in in vivo experiments at pH 6.5, a pH value of 6.5 was taken as the reference pH, where the ASF for a compartment is related to the difference between the logD in the compartment and the logD at pH 6.5.
Equation 1-46: ASF (small intestine), logD model
where:
|
Variable |
Definition |
|
|
The surface area to volume ratio, where A =1.2/r and where r = the compartment radius. |
|
|
Fitting constants for the purposes of weighting the ASFs to account for aspects that are not considered in this derivation such as active transport and physiological changes in the small intestine, where:
|
|
|
Value = 6.25. A fitting constant that avoids the singular condition. |
|
|
Peff at pH 6.5. |
|
|
The intrinsic (neutral) Peff of the compound. |
Equation 1-47 shows the calculation for ASF in the colon using the logD model.
Equation 1-47: ASF (colon), logD model
where:
|
Variable |
Definition |
|
|
The surface area to volume ratio, where A =4/r and where r = the compartment radius. Note: This calculation is also applicable for the caecum. |
|
|
Fitting constants that regulate the degree to which logD can influence ASF. If C3 and C4 were both equal to 1.0, then when logD is positive, ASF would be greater than 1.0. Conversely, when logD is negative, then ASF would be less than 1.0, which accounts for the decreased colonic absorption of polar compounds as described in Ungell’s studies7. |
For animals other than human, Equation 1-46 and Equation 1-47 are scaled according to the ratio of intestinal radii between the animal and human.
Opt logD model
Like the logD model, the Opt logD model uses a simplified calculation for ASF in the small intestine and the colon, with the gut geometry approximated by a cylinder and not taking into account any contribution from villi or microvilli.
Simulations Plus has optimized the ASFs (the values of C1-C4) in the Opt logD Model SA/V 6.1 to provide the best compromise model for a variety of drugs. This model is often adequate, but you might have to modify it for drugs that are substrates for influx or efflux transporters.
Because of the singularity arising at C2 = ΔlogD6.5, the logD model ASF calculations are not easily amenable to non-linear optimization. Therefore, this equation was modified to create a new model, the Opt logD model, where C (value = 6.25) is a fitting constant that avoids the singular condition as shown in Equation 1-48.
Equation 1-48: ASF (small intestine), Opt logD model
where:
|
Variable |
Description |
|
|
Value = 6.25. A fitting constant that avoids the singular condition. |
|
|
A fitting constant that determines the rate of change, or steepness, of the ASF gradient. |
|
|
A fitting constant that influences the baseline value of the ASFs. |
|
|
The surface area to volume ratio, where
and r = the compartment radius. |
The ASF calculation for the caecum and the colon using the Opt logD model is identical to that for the logD model. See Equation 1-47.
Opt logD model SA/V 6.1
The Opt logD model SA/V 6.1 accounts for an increase in the surface area resulting from the presence of villi and microvilli, and therefore, provides for more accurate calculations of logD values in the individual GI tract compartments. The equation for the calculation of the ASFs in the Opt logD model SA/V 6.1 is identical to that of the Opt logD model, with one notable exception: the surface area to volume ratio is defined as A = 2/r*SEF, where SEF is a Surface area Enhancement Factor that accounts for the changes in the surface area-to-volume ratio along the GI tract. See Equation 1-49 and Equation 1-50.
Equation 1-49: ASF calculation (small intestine), Opt logD SA/V 6.1 model
Equation 1-50: ASF calculation (caecum, colon), Opt logD SA/V 6.1 model
Theoretical model
Equation 1-51 shows the calculation for ASF using the Theoretical model. This equation represents the ratio between the volume of a cylindrical compartment and its surface area that is available for absorption.
Equation 1-51: ASF calculation (all compartments), Theoretical model
Theoretical SA/V model
Equation 1-52 shows the calculation for ASF using the Theoretical model SA/V model, where SEF is a Surface area Enhancement Factor that accounts for changes in the surface area-to-volume ratio along the GI tract.
Equation 1-52: ASF calculation (all compartments), Theoretical SA/V model
Paracellular Absorption
In GastroPlus®, drug absorption via the paracellular pathway is treated as a separate process. Equation 1-53 describes the model for the rate of absorption via the paracellular route, where the paracellular route from each intestinal lumen compartment employs a time-dependent linear rate coefficient, ka,para’, that can be different in each compartment.
Equation 1-53: Paracellular absorption rate prediction
where:
|
Variable |
Definition |
|
|
Indicates a particular intestinal compartment. |
|
|
The paracellular absorption rate coefficient for the jth intestinal compartment. |
|
|
The volume of the lumen in jth intestinal compartment. |
|
|
The total drug concentration in the lumen for the jth intestinal compartment. |
|
|
The concentration of unbound drug in the portal vein. |
As shown in Equation 1-54, the paracellular absorption rate coefficient ka,para’ in each compartment is a product of the paracellular absorption scale factor (ASFpara, j) and paracellular permeability (Ppara,j).
Equation 1-54: Paracellular absorption rate coefficient
where:
|
Variable |
Definition |
|
|
A physiological parameter calculated as 2/radius(j). |
|
|
Estimated according to the published equation8 from the drug properties of size and charge, and the physiological parameters of pore radius and porosity in each intestinal compartment as shown in Equation 1-55. |
Equation 1-55: Paracellular permeability calculation
where:
|
Variable |
Definition |
|
|
Dimensionless electrochemical energy function of the jth intestinal compartment. |
|
|
The unit charge of an ion. |
|
|
The charge of the drug molecule at the pH of the jth intestinal compartment. |
|
|
The electrical potential gradient across the aqueous pore. |
|
|
The Boltzman constant. |
|
|
The temperature. |
|
|
The porosity, or the volume fraction of aqueous pores, in the jth intestinal compartment. |
|
|
The pore length. |
|
|
The aqueous diffusion coefficient for the drug. |
|
|
A Renkin function that characterizes the diffusion of solute in a micropore. See Renkin functions in paracellular absorption. |
As shown in Equation 1-56, the total rate of drug absorption is then calculated as a sum of the passive transcellular absorption rate and the paracellular absorption rate.
Equation 1-56: Total rate of drug absorption
where:
|
Variable |
Definition |
|
|
The paracellular absorption scale factor of the jth intestinal compartment. |
|
|
The paracellular permeability of the jth intestinal compartment. |
|
|
The drug concentration in the lumen. |
|
|
The unbound concentration of drug in the portal vein. |
|
|
The lumen fluid volume of the jth intestinal compartment. |
|
|
The unbound concentration of drug in the enterocyte subcompartment. |
|
|
The transcellular absorption scale factor of the jth intestinal compartment. |
|
|
The transcellular permeability of the jth intestinal compartment. |

All absorption models described in this chapter account for passive transcellular absorption and paracellular absorption; however, if your model also accounts for active transcellular absorption, then you must include up to two additional terms— one for influx and one for efflux—in Equation 1-56.
Renkin functions in paracellular absorption
GastroPlus® incorporates two versions of the Renkin function. The form implemented by Adson8 (Equation 1-57) uses single effective molecular radius to describe the size of the molecule diffusing through the pore. The form proposed by Zhimin9 (Equation 1-58) uses two molecular radii to account for hindered diffusion through the paracellular pores. This form allows for better accounting of the ellipsoidal shape of many drug-like molecules.
Equation 1-57: Renkin function (Adson)
Equation 1-58: Renkin function (Zhimin)
where:
|
Variable |
Definition |
|
|
The pore radius. |
|
|
The effective molecular radius when the molecule is described by a single value of molecular radius. |
|
|
The mean projected radius of solute molecule. |
|
|
The hydrodynamically equivalent sphere radius. |
GastroPlus® includes a simple equation (Equation 1-59) for the calculation of the effective molecular radius, reff, in angstroms (Å). This calculation differs from the commonly utilized Stokes-Einstein equation as most of the drug-like molecules do not have a spherical shape. This equation was calibrated against approximately 1100 drug-like molecules.
Equation 1-59: reff calculation
where MW is the molecular weight of the drug compound.
The physiological parameters for the paracellular pore size and porosity/pore length ratio were obtained by combining information from various literature sources and include a number of assumptions and approximations10 11 12 13 14 15 16.
Pore radius (rpore) and porosity/pore length (εi/δ) in different intestinal compartments in human, rat, and dog were parameterized against measured regional permeabilities and fractions absorbed for neutral paracellular markers, such as mannitol and a series of PEG molecules of varying sizes, with constant pore length in all compartments being assumed. Electrical potential gradient (
) was obtained from the permeability of a charged paracellular marker (atenolol), assuming constant values for compound-dependent parameters in all compartments and all species. Figure 1-7 shows performance of the model in terms of distinguishing the bioavailability of a series of PEG molecules for which only paracellular absorption is assumed and no first- pass extraction is involved. The performance of this model across mammalian species is an excellent example of the quality of validation for the paracellular permeability model.
Figure 1-7: Experimental and predicted bioavailability rates for PEG molecules
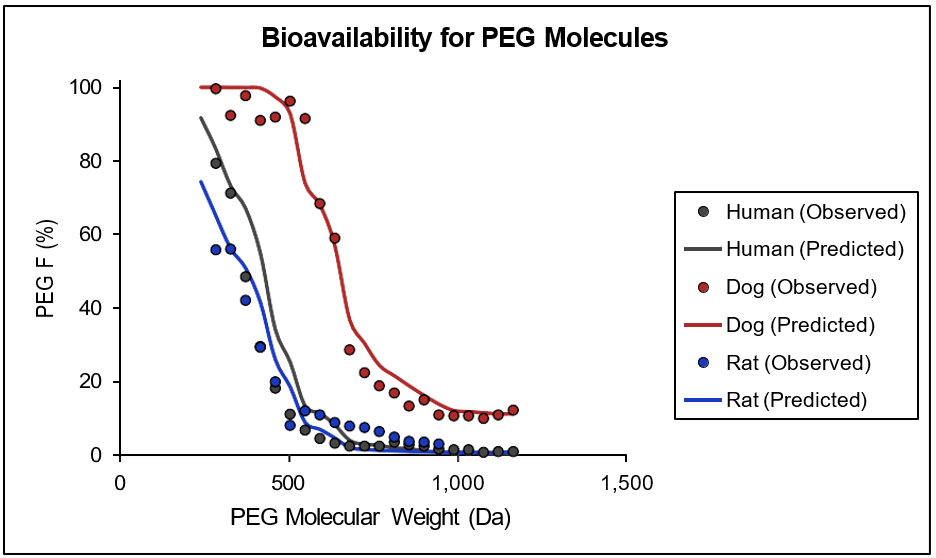
Observed and predicted bioavailability profiles for a series of PEG molecules in the indicated mammalian species. Compound-dependent parameters were held constant across all species. Observed values were obtained from literature17. No information for physiological parameters in other species is currently available and the parameters for mouse, monkey, rabbit, and cat are approximated by parameters derived for human, rat and dog. Human parameters are used for monkey physiologies (cynomologous and rhesus), dog parameters are used for cat and rabbit physiologies, and rat parameters are used for mouse physiology.
Saturable carrier-mediated transport (Active transcellular absorption)
Saturable carrier-mediated transport can take place in one of two ways: either by influx transporters such as PepT1, nucleoside transporter, large neutral amino acid transporter, or organic anion transporters, and bile acid transporters, or by efflux transporters such as P-gp, BCRP, and MRP-2. A Michaelis-Menten equation describes both transport paths:
TransportRate = Influx rate - Efflux rate
and Equation 1-60 (an equation set) details the calculations for the influx and efflux rates, where:
-
The influx transport calculations are based on lumen concentrations (from lumen into enterocytes) or portal vein concentrations (from portal vein into enterocytes.)
-
The efflux transport calculations are based on the enterocyte concentrations (from enterocyte back into the lumen or to the portal vein).
Equation 1-60: Influx and efflux calculations for saturable carrier-mediated transport
where:
|
Variable |
Definition |
|
|
The index for the ith influx/efflux transporter. |
|
|
The index for the jth lumen compartment. |
|
|
The total concentration of the drug in the lumen of the jth intestinal compartment. |
|
|
The concentration of unbound drug in the enterocyte sub-compartment of the jth intestinal compartment. |
|
|
The fraction of unbound drug in the enterocytes. |
|
|
The maximum transport rate for the ith influx/efflux transporter. |
|
|
The Michaelis-Menten constant (the concentration at 1/2 Vmax) for the ith transporter. |
|
|
The distribution factor for the ith transporter to adjust Vmax in the jth intestinal compartment, which represents the relative amount of the transporter compared to its Vmax measurement environment. The default value is 1.0. |
|
|
The scale factor for overall influx transport. The default value is 1.0. |
|
|
The scale factor for overall efflux transport. The default value is 1.0. |
|
|
The scale factor for overall Km for influx transporters. The default value is 1.0. |
|
|
The scale factor for overall Km for efflux transporters. The default value is 1.0. |
1.Lenneräs H., Ahrenstedt O., Hällgren R., Knutston, L., Ryde, M., and Paalzow LK. (1992). “Regional jejunal perfusion, a new in vivo approach to study oral drug absorption in man.” Pharm. Res. 9(10): 1243-51.
2.Lenneräs H., Crison, JR, and Amidon, GL. (1995). “Permability and clearance views of drug absorption: a commentary.” J. Pharmacokinet. Biopharm. 23(3): 333-43.
3.Lenneräs H., et. al. (2003). “Absorption/Metabolism of Sulforaphane and Quercetin, and Regulation of Phase II Enzymes, in Human Jejunum in vivo. Drug Metabolism and Disposition. 31(6): 805-813.
4.Pade, V. and Stavchansky, S. (1997). “Estimation of the relative contribution of the transcellular and paracellular pathway to the transport of passively absorbed drugs in the Caco-2 cell culture model.” Pharm. Res. 14(9): 1210-5.
5.Ungell, A.L., Nylander, S., et al. (1998). “Membrane transport of drugs in different regions of the intestinal tract of the rat.” J. Pharm. Sci. 87(3): 360-6.
6.Adson, A., Burton, P.S., et al. (1995). “Passive diffusion of weak organic electrolytes across Caco-2 cell monolayers: uncoupling the contributions of hydrodynamic, transcellular, and paracellular barriers.” J. Pharm. Sci. 84(10): 1197-1204.
7.Ungell, A.L., Nylander, S., et al. (1998). “Membrane transport of drugs in different regions of the intestinal tract of the rat.” J. Pharm. Sci. 87(3): 360-6.
8.Adson, A., Raub, T.J., et al. (1994). “Quantitative approaches to delineate paracellular diffusion in cultured epithelial cell monolayers.” J. Pharm. Sci. 83(11): 1529-1536.
9.Zhimin, H. (1995). “Theoretical effects of molecular dimension and configuration on effective diffusion coefficient of macromolecules in microporous membranes.” Transactions Tianjin Univ. 1(1): 42-47.
10.Artursson, P., Ungell, A.L., et al. (1993). “Selective paracellular permeability in two models of intestinal absorption: cultured monolayers of human intestinal epithelial cells and rat intestinal segments.” Pharm. Res. 10(8): 1123-9.
11.Billich, C.O. and Levitan, R. (1969). “Effects of sodium concentration and osmolality on water and electrolyte absorption form the intact human colon.” J. Clin. Invest. 48(7): 1336-47.
12.Fordtran, J.S., Rector, F.C.J., et al. (1965). “Permeability characteristics of the human small intestine.” J. Clin. Invest. 44(12): 1935-44.
13.He, Y.L., Murby, S., et al. (1998). “Species differences in size discrimination in the paracellular pathway reflected by oral bioavailability of poly(ethylene glycol) and D- peptides.” J. Pharm. Sci. 87(5): 626-33.
14.Kim, M. (1996). “Absorption of polyethylene glycol oligomers (330-1 122 Da) is greater in the jejunum than in the ileum of rats.” J. Nutr. 126(9): 2172-8.
15.Nellans, H.N. (1991). “Mechanisms of peptide and protein absorption: (1) Paracellular intestinal transport: modulation of absorption.” Adv. Drug Deliv. Rev 7(3): 339-364.
16.Söderholm, J.D., Olaison, G., et al. (1997). “Absorption profiles for polyethylene glycols after regional jejunal perfusion and oral load in healthy humans.” Dig. Dis. Sci. 42(4): 853-7.
17.He, Y.L., Murby, S., et al. (1998). “Species differences in size discrimination in the paracellular pathway reflected by oral bioavailability of poly(ethylene glycol) and D- peptides.” J. Pharm. Sci. 87(5): 626-33