
In a direct response PD model, the observed PD effect is continuous without any lag time and is directly proportional to the total or unbound concentration of the drug in the plasma, Cp, or total or unbound tissue concentration, Ct, when using PBPK. In addition, in a direct response model, a single Cp concentration results in a single PD effect. Four types of direct response PD models are available in GastroPlus®. See:
Unless explicitly noted otherwise, “E” represents both a stimulated and an inhibited PD effect. If the PD effect is solely inhibition, then “I” is used.
Linear model
Equation 3-1 shows the relationship between the observed PD effect and the total or unbound concentration of the drug in the plasma, Cp in a Linear direct response PD model.
Equation 3-1: Linear model, observed PD effect versus concentration
where:
|
Variable |
Definition |
|
|
The PD effect. |
|
|
The total or unbound concentration of the drug in plasma. |
|
|
The slope of the plot of E versus Cp. |
Implicit in this model is the assumption that if the concentration of drug in the plasma is zero, then there is no PD effect, which is not always true. Consequently, this model can be modified to include a second parameter, E0, which describes the baseline of the PD effect.
Equation 3-2: Linear model, observed PD effect versus concentration with baseline
The Linear model with a baseline, however, does not account for an upper limit or lower limit for the PD effect, which is a serious limitation because this is a behavior that is observed for most PD phenomena. See Figure 3-1.
Log Linear model
To address the limitation that is inherent in the Linear model with a baseline, the Linear model can be modified to include linearizations of more complex equations such as the logarithm of the PD effect. This modified model is referred to as the Log Linear model. See Figure 3-2.
Equation 3-3: Log Linear model
Emax model
The Emax model is based on the receptor-binding theory which is a process that is similar to enzyme kinetics. The advantage of this model is that prediction of a maximal PD effect, be it stimulated or inhibited. Equation 3-4 is the equation for the Emax model if the PD effect is stimulated and Equation 3-5 is the equation for the Emax model if the PD effect is inhibited. See Figure 3-3.
Equation 3-4: Emax model, PD effect is stimulated
Equation 3-5: Emax model, PD effect is inhibited
where:
|
Variable |
Definition |
|
|
The PD effect. |
|
|
The baseline of the PD effect. |
|
|
The maximum PD response. |
|
|
The total or unbound concentration of the drug in plasma. |
|
|
The concentration of the drug at 50% of the maximum PD response. |
Sigmoid Emax model
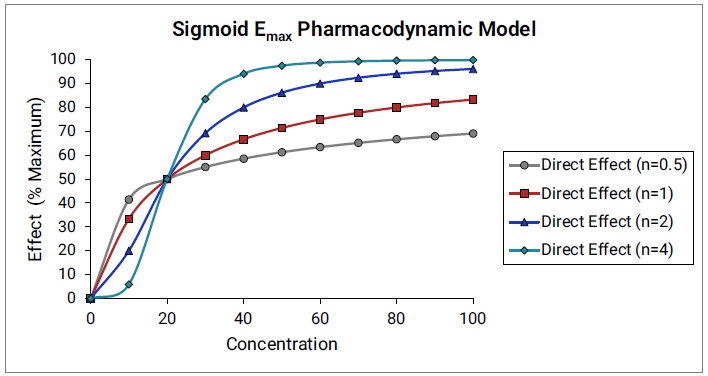
As proposed by Hill1, the Sigmoid Emax model is an extension of the Emax model that introduces an additional parameter, the Hill parameter (γ), that determines the steepness of the curve. Equation 3-6 describes the general concentration-response curve that is based on the molecularity of the enzyme-receptor binding process.
Equation 3-6: Hill equation
where:
|
Variable |
Definition |
|
|
The Hill parameter. |
|
|
The PD effect. |
|
|
The baseline of the PD effect. |
|
|
The maximum PD response. |
|
|
The total or unbound concentration of the drug in plasma. |
|
|
The concentration of the drug at 50% of the maximum PD response. |
Theoretically, the Hill parameter stands for the order of the drug-receptor binding reaction and therefore, it is an integer; however, non-integral values of the Hill parameter are fairly common and in no way detract from the mechanistic basis or empirical value of the Sigmoid Emax model. Most modern pharmacodynamics models use the Hill coefficient to represent the typically steep dependence of a pharmacological effect on concentration changes at the site of action. See Figure 3-4.
Typical PD responses predicted by a direct response model
Figure 3-1 through Figure 3-4 is a series of plots that illustrate the typical PD responses as predicted by a direct response PD model in GastroPlus®.
Figure 3-1: Typical PD response, direct response PD model
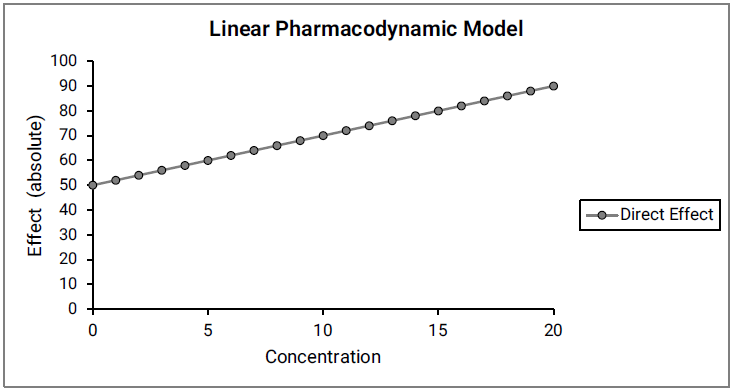
Figure 3-2: Typical PD response, direct response PD model
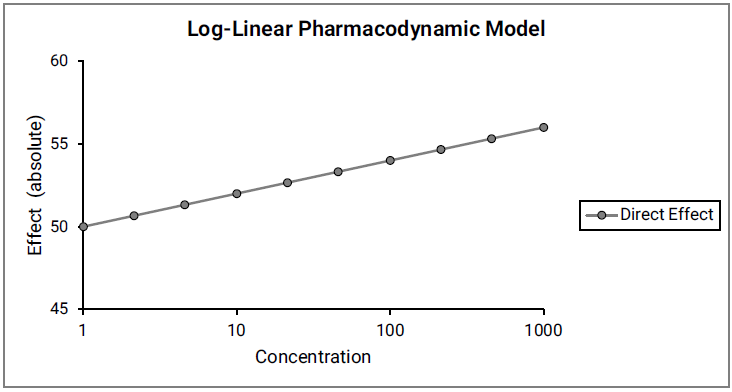
Figure 3-3: Typical PD response, direct response PD model
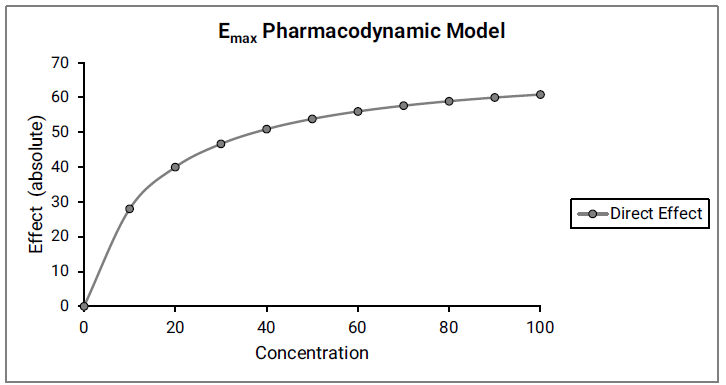
Figure 3-4: Typical PD response, direct response PD model
1.Hill, A.V. (1910). “The possible effects of the aggregation of the molecules on haemoglobin on its dissociation curves.” J. Physiol. (Lond.) 40: iv-vii.