
Understanding the effects of food on pharmacokinetics is a key aspect for compounds with a pH- dependent solubility or low solubility. This understanding is particularly important for compounds that are sensitive to increased gastric pH or require the effect of bile salts to enhance solubility and dissolution. The GastroPlus® physiologies account for six key differences between the fasted and fed states.
-
Increased gastric emptying time.
-
Increased gastric volume.
-
Increased gastric pH.
-
Decreased upper intestine pH.
-
Increased bile salt concentration.
-
Increased hepatic blood flow rate.
The Fasted and Fed State physiologies have the following characteristics:
-
For both the Human Fasted and Human Fed State physiologies, the intestinal compartments are divided into six small intestine compartments, one caecum compartment, and one colon compartment. The pHs, lengths, transit times, and radii for all these compartments are as physiologically accurate as the literature allows.
-
For many drugs, no significant difference is noticed between the results obtained with the two physiologies; however, for ionizable drugs that have a significant difference in solubility between pH 5.0 and 7.5 (which occurs in the caecum and colon), major differences can be observed.
-
For all Fed State physiologies, the gastric emptying time and the bile salt concentration are based on the calories and fat content of the meal consumed. See:
Gastric transit time
The effect of meal calories and type on gastric emptying rate has been studied extensively in literature1 2 3 4 5 6 7 8 9 10 11 12 13 14 15. We compiled data from a number of relevant publications, and then developed a correlation between the calories in the meal and gastric emptying time as shown in Figure 1-2.
Figure 1-2: Correlation between the calories in a meal and gastric emptying time
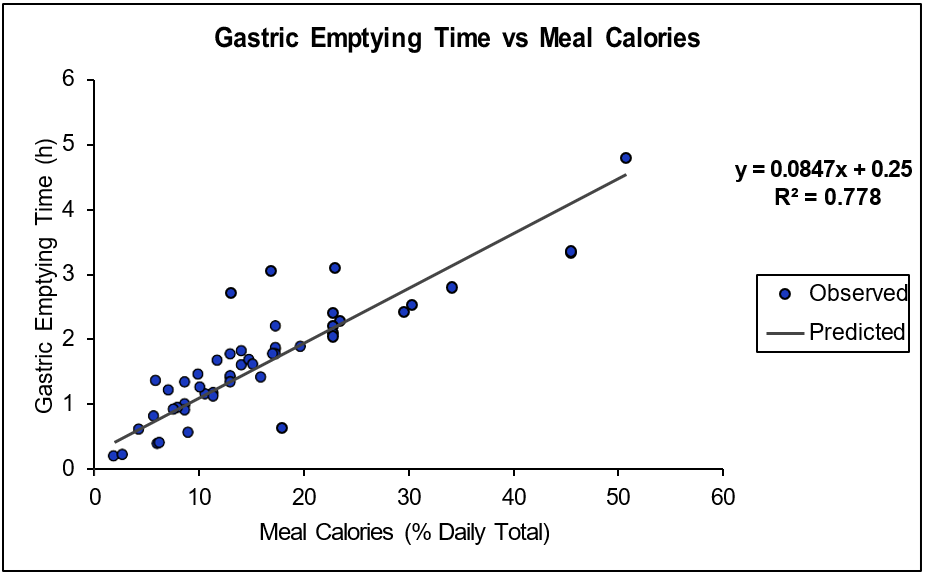
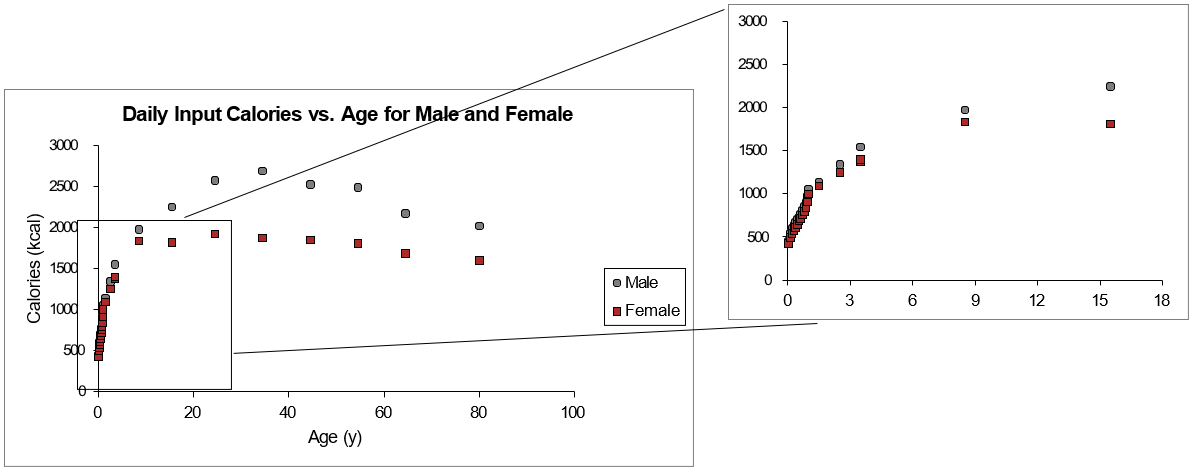
To allow the correlation to be scaled to subjects of much lower weight, including pediatrics, the x-axis was defined as % of daily calories in the meal for the gastric emptying function. The conversion of the meal calories into % daily calories requires information from the literature about the daily caloric intake habits of subjects versus age and gender16 17 as well as from the National Health and Nutrition Examination Survey (NHANES, www.cdc.gov/nchs/nhanes/index.html). A piece-wise polynomial was developed to fit the male and female calories versus age and gender and used with the calorie input to define % daily calories as shown in Figure 1-3.
Figure 1-3: Daily input calories versus age for male and female
Another factor that impacts the gastric emptying time is the shape of the emptying profile. Most of the literature for fed state emptying rates indicates that the profile more closely resembles a zero-order emptying instead of the first-order exponential profile, which is indicative of the fasted state. Table 1-1 summarizes this information.
Table 1-1: Qualitative evaluation of gastric emptying profile shape
|
Reference |
Meal Type |
Measured Emptying Profile Shape |
|
Braden18 |
Liquid or Oat flakes and milk |
Profile not displayed in paper |
|
Calbet19 |
Glucose + Protein Isolate |
Exponential |
|
Cunningham20 |
Mashed Potatoes, Butter, Beans |
Profile not displayed in paper |
|
Doran21 |
Hamburger + Tomato Sauce |
Zero-order |
|
Ghoos22 |
Egg Sandwich |
Exponential |
|
Goetz23 |
Liquid emulsified oil, glucose, or albumin solution |
Zero-order |
|
Hunt24 |
Sucrose + Pectin |
Zero-order |
|
Hunt25 |
Polycrose |
Profile not displayed in paper |
|
Kunz26 |
Pancakes, Potatoes, Eggs |
Zero-order |
|
Kwaitek27 |
Ensure |
Zero-order |
|
Marciani28 |
Emulsified oils |
Zero-order |
|
McHugh29 |
Glucose |
Exponential |
|
Moore30 |
Salad + Dressing |
Zero-order |
|
Speigel31 |
Soup + Egg Sandwich |
Zero-order |
|
Velchik32 |
Egg Sandwich |
Zero-order |
In addition to the actual emptying profiles themselves, we previously looked at a subset of PK data that explored the effect of % fat and calories. While it is beyond the scope of this guide to look at in-depth model development for all compounds, Table 1-2 summarizes overall prediction trends with eight different Fed State physiologies. The results indicate that with the default gastric emptying time calculation and bile salt concentration adjustment, we are generally making better predictions in the fed state.
References are cited where appropriate in Table 1-2. All internal studies used confidential data.
Table 1-2: Evaluation of GastroPlus® Fed State physiology settings on PK predictions for eight compounds
|
Compound |
Meal Type |
Best Fed Physiology Settings |
|
Axitinib33 |
Normal Meal |
Exponential, GastroPlus® V9.7 |
|
High Fat/High Calorie |
Zero-order, GastroPlus® V9.7 |
|
|
Dolutegravir34 |
High Fat/High Calorie |
Zero-order, GastroPlus® V9.7 |
|
Mod. Fat/Mod. Calorie |
Zero-order, GastroPlus® V9.7 |
|
|
Low Fat/Low Calorie |
Zero-order, GastroPlus® V9.7 |
|
|
Lapatinib35 |
Low Fat/Low Calorie |
Default, GastroPlus® V9.6 |
|
High Fat/High Calorie |
Default, GastroPlus® V9.6 |
|
|
Ixazomib36 |
High Fat/High Calorie |
Exponential, GastroPlus® V9.7 |
|
Internal Study 1 |
Low Fat/Low Calorie |
Zero-order, GastroPlus® V9.7 |
|
High Fat/High Calorie |
Zero-order, GastroPlus® V9.7 |
|
|
Internal Study 2 |
FDA High Fat Breakfast |
Zero-order, GastroPlus® V9.7 |
|
Internal Study 3 |
FDA High Fat Breakfast |
Zero-order, GastroPlus® V9.7 |
|
Internal Study 4 |
FDA High Fat Breakfast |
Zero-order, GastroPlus® V9.7 |
Fed Meal % fat effect on bile concentration
The % fat in a meal can impact multiple aspects of drug dissolution. Additional fat in a meal can cause the drug to partition into the fat micelles in a higher amount than in a low-fat meal, which is essentially an “effective” increase in solubility and therefore, in the dissolution rate. Although we do not have the ability to track the concentration of dietary fats and know their capacity for drug partitioning, we can address the increased bile production that high fat diets cause. Studies using imaging methods or direct measurement have shown higher biliary excretion37 38. An indirect measurement of total bile acid excretion comes via the measurement of bile acids in the feces that escaped re- uptake. In high fat diets, the fecal concentration of bile increased by 1.3 to 2-fold39 40 41. Beverage also directly measured different bile concentrations after ingestion of two nutritional drinks of moderate or high fat content42. Based on the bile excretion and fecal concentration data, we built a bile secretion, transit, and uptake physiology to predict steady state bile concentrations that would result in 1.3- to 2-fold increases in bile concentration in feces. This averaged with the direct measurement of Beverage served as a basis for the correlation we developed between % fat in a meal and bile concentration in the intestinal lumen. As shown in Equation 1-4 and Table 1-3, this correlation is a second order polynomial where the concentration of bile Cbile,N in any compartment N can be calculated from the constants A(2,N), A(1,N), and A(0,N).
Equation 1-4: Second-order polynomial for the prediction of bile salt concentration in the intestinal lumen based on % fat in a meal
Table 1-3: Polynomial coefficients for Equation 1-4
|
|
Duodenum |
Jejunum1 |
Jenjunum2 |
Ileum1 |
Ileum2 |
Ileum3 |
|
A2 |
2.131E-04 |
-3.716E-04 |
-1.237E-03 |
-1.217E-03 |
-2.631E-03 |
-7.747E-05 |
|
A1 |
2.957E-01 |
2.746E-01 |
2.863E-01 |
2.177E-01 |
2.677E-01 |
1.934E-02 |
|
A0 |
5.379E+00 |
4.117E+00 |
2.985E+00 |
1.844E+00 |
3.265E-01 |
2.196E-01 |
1.Braden, B., Adams, S., et al. (1995). “The [13C]acetate breath test accurately reflects gastric emptying of liquids in both liquid and semisolid test meals.” Gastroenterology 108(4): 1048-55.
2.Carlert, S., Pålsson, A., et al. (2010). “Predicting intestinal precipitation-A case example for a basic BCS class II drug.” Pharm. Res. 27(10): 2119-30.
3.Cunningham, K.M., Daly, J., et al. (1991). “Gastrointestinal adaptation to diets of differing fat composition in human volunteers.” Gut 32(5): 483-6.
4.Doran, S., Jones, K.L., et al. (1998). “Effects of meal volume and posture on gastric emptying of solids and appetite.” Am. J. Physiol. 275(5): R1712-8.
5.Ghoos, Y.F., Maes, B.D., et al. (1993). “Measurement of gastric emptying rate of solids by means of a carbon-labeled octanoic acid breath test.” Gastroenterology 104(6): 1640-7.
6.Goetze, O., Steingoetter, A., et al. (2007). “The effect of macronutrients on gastric volume responses and gastric emptying in humans: A magnetic resonance imaging study.” Am. J. Physiol. Gastrointest. Liver Physiol. 292(1): G11-7.
7.Hunt, J.N. and Macdonald, I. (1954). “The influence of volume on gastric emptying.” J. Physiol. 126(3): 459-74.
8.Hunt, J.N., Smith, J.L., et al. (1985). “Effect of meal volume and energy density on the gastric emptying of carbohydrates.” Gastroenterology 89(6): 1326-30.
9.Kunz, P., Feinle, C., et al. (1999). “Assessment of gastric motor function during the emptying of solid and liquid meals in humans by MRI.” J. Magn. Reson. Imaging 9(1): 75-80.
10.Kwiatek, M.A., Menne, D., et al. (2009). “Effect of meal volume and calorie load on postprandial gastric function and emptying: studies under physiological conditions by combined fiber-optic pressure measurement and MRI.” Am. J. Physiol. Gastrointest. Liver Physiol. 297(5): G894-901.
11.Marciani, L., Gowland, P.A., et al. (2001). “Effect of meal viscosity and nutrients on satiety, intragastric dilution, and emptying assessed by MRI.” Am. J. Physiol. Gastrointest. Liver Physiol. 280(6): G1227-33.
12.McHugh, P.R. and Moran, T.H. (1979). “Calories and gastric emptying: a regulatory capacity with implications for feeding.” Am. J. Physiol. 236(5): R254-60.
13.Moore, J.G., Christian, P.E., et al. (1984). “Influence of meal weight and caloric content on gastric emptying of meals in man.” Dig. Dis. Sci. 29(6): 513-9.
14.Spiegel, T.A., Fried, H., et al. (2000). “Effects of posture on gastric emptying and satiety ratings after a nutritive liquid and solid meal.” Am. J. Physiol. Regul. Integr. Comp. Physiol. 279(2): R684-94.
15.Velchik, M.G., Reynolds, J.C., et al. (1989). “The effect of meal energy content on gastric emptying.” J. Nucl. Med. 30(6): 1106-10.
16.Ferro-Luzzi, A. and Durnin, J.V.G.A. (1981). “The assessment of human energy intake and expenditure: a critical review of the recent literature.” Rome, FAO.
17.Whitehead, R.G., Paul, A.A., et al. (1981). “A critical analysis of measured food energy intakes during infancy and early childhood in comparison with current international recommendations.” J. Hum. Nutr. 35(5): 339-48.
18.Braden, B., Adams, S., et al. (1995). “The [13C]acetate breath test accurately reflects gastric emptying of liquids in both liquid and semisolid test meals.” Gastroenterology 108(4): 1048-55.
19.Calbert, J.A. and MacLean, D.A. (1997). “Role of caloric content on gastric emptying in humans.” Journal of Physiology 498(2): 553-559.
20.Cunningham, K.M., Daly, J., et al. (1991). “Gastrointestinal adaptation to diets of differing fat composition in human volunteers.” Gut 32(5): 483-6.
21.Doran, S., Jones, K.L., et al. (1998). “Effects of meal volume and posture on gastric emptying of solids and appetite.” Am. J. Physiol. 275(5): R1712-8.
22.Ghoos, Y.F., Maes, B.D., et al. (1993). “Measurement of gastric emptying rate of solids by means of a carbon-labeled octanoic acid breath test.” Gastroenterology 104(6): 1640-7.
23.Goetze, O., Steingoetter, A., et al. (2007). “The effect of macronutrients on gastric volume responses and gastric emptying in humans: A magnetic resonance imaging study.” Am. J. Physiol. Gastrointest. Liver Physiol. 292(1): G11-7.
24.Hunt, J.N. and Macdonald, I. (1954). “The influence of volume on gastric emptying.” J. Physiol. 126(3): 459-74.
25.Hunt, J.N., Smith, J.L., et al. (1985). “Effect of meal volume and energy density on the gastric emptying of carbohydrates.” Gastroenterology 89(6): 1326-30.
26.Kunz, P., Feinle, C., et al. (1999). “Assessment of gastric motor function during the emptying of solid and liquid meals in humans by MRI.” J. Magn. Reson. Imaging 9(1): 75-80.
27.Kwiatek, M.A., Menne, D., et al. (2009). “Effect of meal volume and calorie load on postprandial gastric function and emptying: studies under physiological conditions by combined fiber-optic pressure measurement and MRI.” Am. J. Physiol. Gastrointest. Liver Physiol. 297(5): G894-901.
28.Marciani, L., Gowland, P.A., et al. (2001). “Effect of meal viscosity and nutrients on satiety, intragastric dilution, and emptying assessed by MRI.” Am. J. Physiol. Gastrointest. Liver Physiol. 280(6): G1227-33.
29.McHugh, P.R. and Moran, T.H. (1979). “Calories and gastric emptying: a regulatory capacity with implications for feeding.” Am. J. Physiol. 236(5): R254-60.
30.Moore, J.G., Christian, P.E., et al. (1984). “Influence of meal weight and caloric content on gastric emptying of meals in man.” Dig. Dis. Sci. 29(6): 513-9.
31.Spiegel, T.A., Fried, H., et al. (2000). “Effects of posture on gastric emptying and satiety ratings after a nutritive liquid and solid meal.” Am. J. Physiol. Regul. Integr. Comp. Physiol. 279(2): R684-94.
32.Velchik, M.G., Reynolds, J.C., et al. (1989). “The effect of meal energy content on gastric emptying.” J. Nucl. Med. 30(6): 1106-10.
33.Pithavala, Y.K., Chen, Y., et al. (2012). “Evaluation of the effect of food on the pharmacokinetics of axitinib in healthy volunteers.” Cancer Chemother. Pharmacol. 70(1): 103-12.
34.Song, I., Borland, J., et al. (2012). “Effect of food on the pharmacokinetics of the integrase inhibitor dolutegravir.” Antimicrob. Agents Chemother. 56(3): 1627-9.
35.Devriese, L.A., Koch, K.M., et al. (2014). “Effects of low-fat and high-fat meals on steady-state pharmacokinetics of lapatinib in patients with advanced solid tumours.” Invest. New Drugs 32(3): 481-8.
36.Gupta, N., Hanley, M.J., et al. (2016). “The Effect of a High-Fat Meal on the Pharmacokinetics of Ixazomib, an Oral Proteasome Inhibitor, in Patients With Advanced Solid Tumors or Lymphoma.” J. Clin. Pharmacol. 56(10): 1288-95.
37.Bennion, L.J. and Grundy, S.M. (1975). “Effects of obesity and caloric intake on biliary lipid metabolism in man.” J. Clin. Invest. 56(4): 996-1011.
38.Marciani, L., Cox, E.F., et al. (2013). “Effects of various food ingredients on gall bladder emptying.” Eur. J. Clin. Nutr. 67(11): 1182-7.
39.Antonis, A. and Bersohn, I. (1962). “The influence of diet on fecal lipids in South African white and Bantu prisoners.” Am. J. Clin. Nutr. 11: 142-55.
40.Cummings, J.H., Wiggins, H.S., et al. (1978). “Influence of diets high and low in animal fat on bowel habit, gastrointestinal transit time, fecal microflora, bile acid, and fat excretion.” J. Clin. Invest. 61(4): 953-63.
41.Reddy, B.S. (1981). “Diet and excretion of bile acids.” Cancer Res. 41(9 Pt 2): 3766-8.
42.Bevernage, J., Brouwers, J., et al. (2010). “Drug supersaturation in simulated and human intestinal fluids representing different nutritional states.” J. Pharm. Sci. 99(11): 4525-34.