
Each of the Kp calculation methods was derived using different assumptions for the values for the relevant variable values. See:
Steady state volume distribution values (Vss)
The comparison of the original Rodgers and Rowland method and the Lukacova combined method for the calculation of Kp required the identification of compounds with either experimental Kp values or experimental steady state volume distribution values (Vss). As shown in Equation 2-53, the Vss was estimated using the tissue volumes and tissue:plasma partition coefficients according to Poulin1 2.
Equation 2-53: Steady state volume distribution calculation
where:
|
Variable |
Definition |
|
|
The total volume of plasma in the body. |
|
|
The total volume of erythrocytes in the body. |
|
|
The ratio of the total concentration of the drug in erythrocytes to the total concentration of the drug in plasma, calculated from the blood/ plasma drug concentration ratio and the hematocrit. |
|
|
The volume of a given tissue compartment. |
|
|
The tissue/plasma partition coefficient. |
|
|
The extraction ratio for a given tissue. |
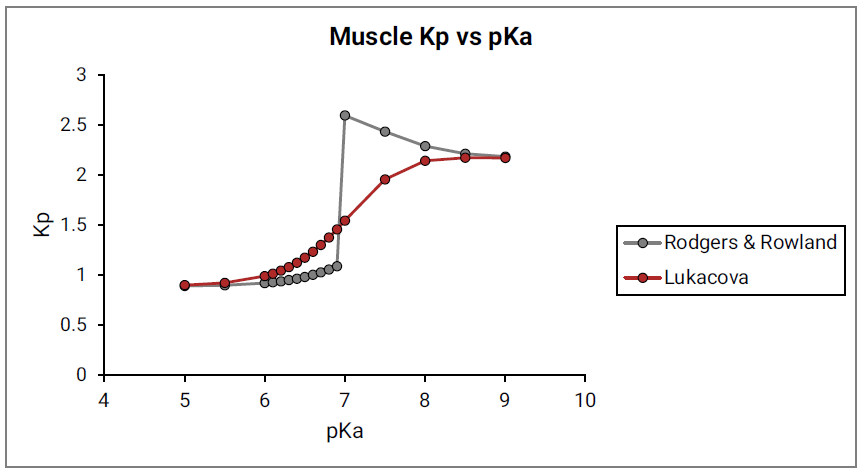
Finally, the dependency of the predicted Kp on the value of base pKa was also evaluated for the Lukacova combined equation. Just as with the original Rodgers and Rowland approach, the Kp calculations were run for a model compound with following characteristics: base pKa, logP = 1, fup = 1 and Rb:p = 1 in adipose and muscle tissues.
As shown in Figure 2-15 and Figure 2-16, the Lukacova combined equation (red lines) presents a much smoother dependency of calculated Kp on base pKa. The results of Kp calculations using the original Rodgers and Rowland approach (gray lines) are also shown for comparison.
Figure 2-15: Adipose Kp calculated using the original Rodgers & Rowland equations (gray) and the Lukacova combined equation (red) versus base pKa
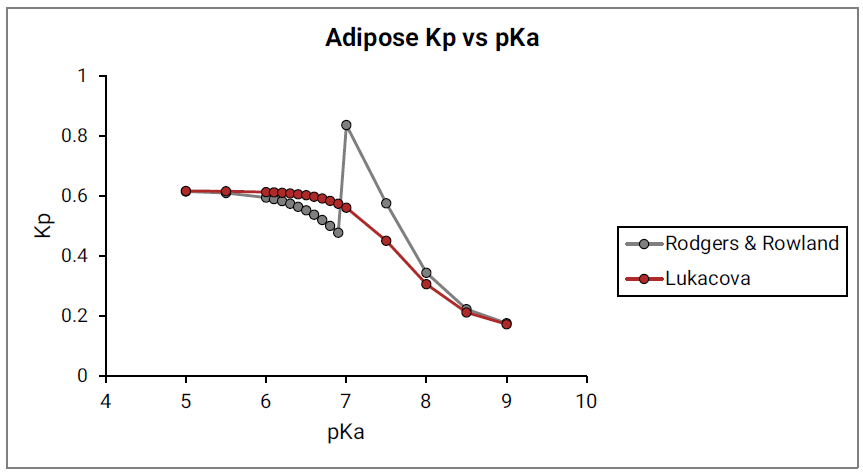
Figure 2-16: Muscle Kp calculated using the original Rodgers & Rowland equations (gray) and the Lukacova combined equation (red) versus base pKa

Based on the presented validation examples, the Lukacova combined equation, labeled as Lukacova, has been selected as the default option for the calculation of tissue-plasma partition coefficients for perfusion-limited tissues in GastroPlus®.
Tissue/plasma albumin (RAt:p) ratio
This section applies to the Kp methods selected for perfusion-limited tissues.
Each of the Kp calculation methods was derived using different assumptions for the ratio of albumin expression in tissue and in plasma. GastroPlus® uses the same values as those that were presented in the original publication for each Kp calculation method. Table 2-3 through Table 2-5 describe what tissue:plasma albumin ratios are being used with each selection. The tables also show the multiple names that are recognized for each tissue. The first name is the name that the Population Estimates for Age-Related (PEAR™) physiology module assigns within GastroPlus®. Any additional names under which the same tissue would be recognized, which is applicable when a user is modifying the default PBPK model, are shown in parenthesis.
Table 2-3: Constant Tissue Albumin
|
Tissue |
RAt:p Value |
|
Note: The Constant Tissue Albumin method is the default Kp calculation for Poulin- Homogeneous, and Berezhkovskiy. |
|
|
Adipose, Yellow Marrow |
0.15 |
|
All others |
0.5 |
Table 2-4: Rothschild Tissue Albumin
|
Tissue |
RAt:p Value |
|
Adipose (Fat), Yellow Marrow |
0.117 |
|
Red Marrow |
0.118 |
|
Brain (Brains) |
0.021 |
|
Heart |
0.118 |
|
Kidney (Kidneys) |
0.035 |
|
Liver |
0.033 |
|
Lung (Lungs) |
0.165 |
|
Muscle (Muscles) |
0.079 |
|
Skin |
0.27 |
|
Spleen |
0.134 |
|
ReproOrg (Reproductive Organs, Testis, Testes) |
0.055 |
|
RestOfBody (Rest of Body) |
0.105 |
|
Gut (Guts, ACAT Gut) |
0.12 |
|
All others |
0.5 |
Table 2-5: Rowland Tissue Albumin
|
Tissue |
Lipoprotein ratio |
RAt:p Value |
|
Note: The Rowland Tissue Albumin method is the default Kp calculation method with Poulin-Extracellular, Rodgers and the Lukacova Kp calculations. Because the assumption is that neutral drugs bind to lipoprotein rather than albumin3 4 5 6, the lipoprotein ratio is used for non-ionizable drugs. For all other compounds, the RAt:p value is used. |
||
|
Adipose (Fat), Yellow Marrow |
0.068 |
0.049 |
|
Red Marrow |
0.16 |
0.157 |
|
Brain (Brains) |
0.041 |
0.048 |
|
Heart |
0.16 |
0.157 |
|
Kidney (Kidneys) |
0.137 |
0.13 |
|
Liver |
0.161 |
0.086 |
|
Lung (Lungs) |
0.168 |
0.212 |
|
Muscle (Muscles) |
0.059 |
0.064 |
|
Skin |
0.096 |
0.277 |
|
Spleen |
0.207 |
0.097 |
|
ReproOrg (Reproductive Organs, Testis, Testes) |
0.267 |
0.143 |
|
RestOfBody (Rest of Body) |
0.133 |
0.122 |
|
Gut (Guts, ACAT Gut) |
0.141 |
0.158 |
|
All others |
0.133 |
0.122 |
1.Poulin, P. and Theil, F.P. (2002). “Prediction of pharmacokinetics prior to in vivo studies. 1. Mechanism-based prediction of volume of distribution.” J. Pharm. Sci. 91(1): 129-56.
2.Poulin, P. and Theil, F.P. (2002). “Prediction of pharmacokinetics prior to in vivo studies. II. Generic physiologically based pharmacokinetic models of drug disposition.” J. Pharm. Sci. 91(5): 1358-70.
3.Rodgers, T., Leahy, D., et al. (2005). “Physiologically based pharmacokinetic modeling 1: predicting the tissue distribution of moderate-to-strong bases.” J. Pharm. Sci. 94(6): 1259-76.
4.Rodgers T. and Rowland M. (2006). “Physiologically-based Pharmacokinetic Modeling 2: Predicting the tissue distribution of acids, very weak bases, neutrals and zwitterions.” J. Pharm. Sci. 95(6):1238-57.
5.Rodgers, T., Leahy, D., et al. (2007). “Physiologically based pharmacokinetic modeling 1: Predicting the tissue distribution of moderate-to-strong bases.” J. Pharm. Sci.96(11): 3151-3152.
6.Rodgers, T. and Rowland, M. (2007). “Physiologically-based Pharmacokinetic Modeling 2: Predicting the tissue distribution of acids, very weak bases, neutrals and zwitterions.” J. Pharm. Sci. 96(11): 3153-3154.