
The implementation of PBPK in GastroPlus® includes an internal module named PEAR Physiology™ (Population Estimates for Age-Related Physiology). This module calculates organ physiologies for American (Western), Japanese (Asian), and Chinese human models across ages ranging from premature neonates to 85 years old. Additionally, it provides adult-only organ physiologies for several commonly used pre-clinical species.
The age-related population data in the PEAR™ module includes data for body weight, height, body mass index, and bioelectrical impedance resistance measured at 50 KHz. The data for the PEAR™ module is sourced as follows:
For humans:
-
The age-related population data for 11,039 Americans (50% male and 50% female) comes from the National Health and Nutrition Examination Survey (NHANES): www.cdc.gov/nchs/nhanes/index.html).
-
The age-related population data for Japanese comes from a paper by Ogiu et al.1
-
The age-related population data for Chinese was collected from over 100 publications, with the primary sources referenced here2 3 4 5 6 7 8 9 10 11.
For pre-clinical species:
-
The default rat physiology comes from a paper on PBPK modeling of terbinafine12.
-
The default physiologies for dog, mouse, monkey, and rabbit are based mainly on the data published by Brown13 and Davies14.
-
Additional information was supplied from number of other publications for the following species:
Individual organ physiology models are beyond the scope of this discussion; however, much of the thought process for the steps for generating organ physiology was influenced by Price et al.33 and Haddad et al.34
-
Look up average weight, height, and bioimpedance.
-
Calculate BMI and Fat-Free Mass (FFM).
-
Set the constant perfusion rates per mL tissue. (Table 13 in the referenced Price manuscript.)
-
Calculate blood volumes.34
-
Calculate weight, volume, density, and perfusion for each tissue.
Infant physiologies
The infant physiology algorithms in GastroPlus® cover infants less than 1 year old, including newborns born up to 16 weeks premature. The core information for individual parameters (body height and weight, tissue sizes, and so on) was obtained from ICRP publication 2335 and was supplemented by data from additional publications.
For the total body height and weight, as well as the majority of tissue sizes, there appears to be a continuous progression of growth from fetus to neonate and infant. Birth does not appear to be a significant event and the development rate is dependent only on post-menstrual age (PMA), where PMA = gestational age + postnatal age. For these cases, smooth relationships between the size and PMA covering the entire range of ages from a 16 week premature newborn to a term-born 1-year-old infant were found and implemented in GastroPlus®. See Figure 2-17 through Figure 2-26.
Some of the physiological parameters, however, are dependent separately on gestational age and postnatal age. For example, premature neonates and infants experience a “catch-up” period during the first few weeks and the percent of fat mass in their bodies increases faster (Figure 2-27) than in their term-born counterparts (neonates and infants of the same post-menstrual age born at term). Similarly, the hematocrit (Figure 2-38) and glomerular filtration rate (Figure 2-49) ontogeny change at birth, and as a result, gestational age and postnatal age must be considered separately when estimating these values.
The majority of the observed physiological parameters used to derive the algorithms for infant physiologies were for infants from western populations. Currently, the same equations are also being used for infants from Japanese and Chinese populations.
Although individual organ physiology models are beyond the scope of this discussion, example plots of experimental data and relationships implemented in GastroPlus® for some of the tissue sizes, compositions, and some of the physiological parameters are shown in the following sections. See:
Infant body and tissue sizes
For infants with PMA < 39 weeks, the weight and height data were not available from survey data. Instead, they were extracted from multiple publications, which included both Chinese and Caucasian infants. The same bivariate distribution function for weight and height is used for both males and females across Chinese, Caucasian, and Japanese infants in this age range.
Body weight and height
Figure 2-17: Body weight and height for preterm/term infants up to 42 weeks old
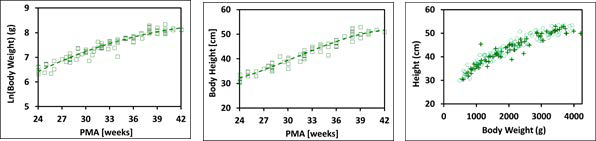
The plot on the left and the plot in the middle show log normal body weight and body height, respectively versus post-menstrual age (PMA). The data points represent experimental data10 35 36 37 38 39 40 41 42 43 44. The plotted lines show tissue weights and heights calculated using equations implemented in GastroPlus®. The plot on the right compares the observed distribution of body weights and heights (cross) in these infants with the distribution of body weights and heights generated by bivariate distribution function implemented in GastroPlus® (circles).
Figure 2-18: Body weight and height for term infants up to 1 year old
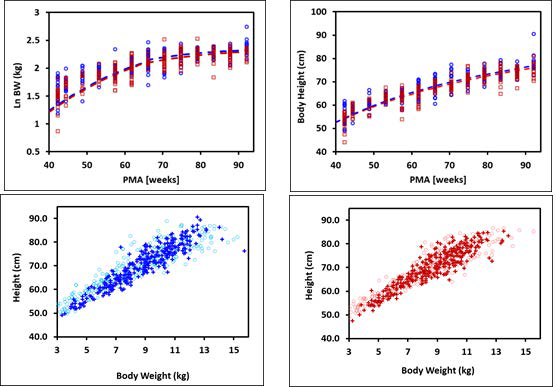
The plots on the top show log normal body weight (left) and body height (right) versus post- menstrual age (PMA). The data points represent NHANES 2003-2004 survey data and the lines show body weights and heights calculated using equations implemented in GastroPlus®. The data for males and females are shown in blue and red, respectively. The plots on the bottom compare the observed distributions of body weights and heights (cross) in these infants with the distribution of body weights and heights generated by bivariate distribution function implemented in GastroPlus® (circles) for males (left) and females (right).
Tissue weight versus post-menstrual age (PMA) for infants up to one year old
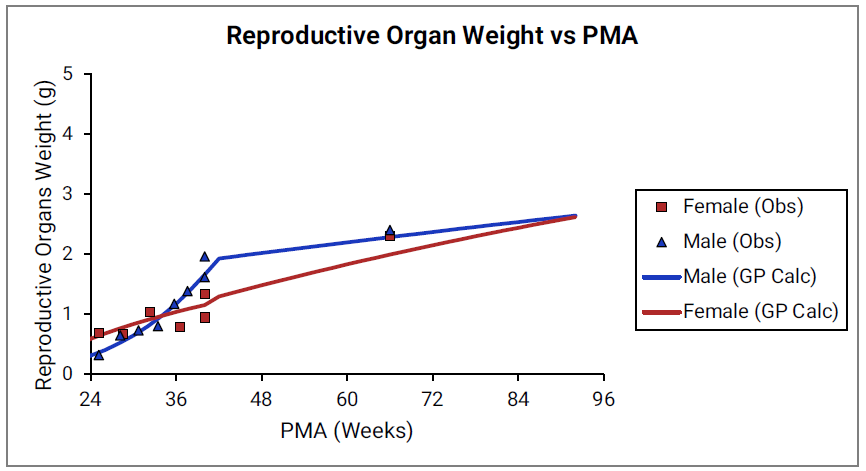
For Figure 2-19 through Figure 2-26, the data points represent experimental data35. The plotted lines represent tissue weights calculated using equations in GastroPlus®. The data for males and females are shown in blue and red, respectively. Tissue weights for all tissues other than muscle and reproductive organs that were calculated using previously published equations for healthy Danish infants45 are shown (gray circles) for comparison.
Figure 2-19: Liver weight versus PMA
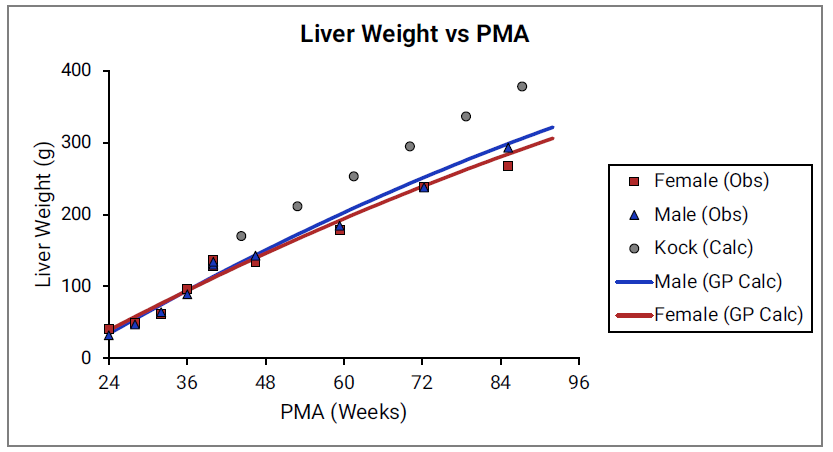
Figure 2-20: Kidney weight versus PMA
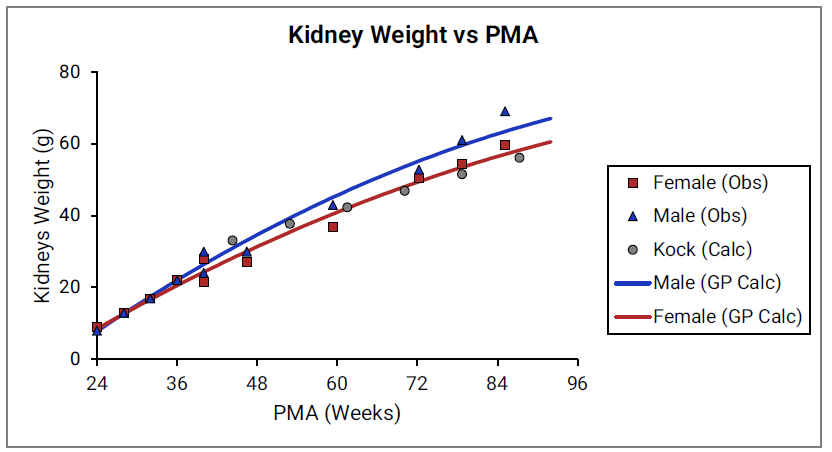
Figure 2-21: Brain weight versus PMA
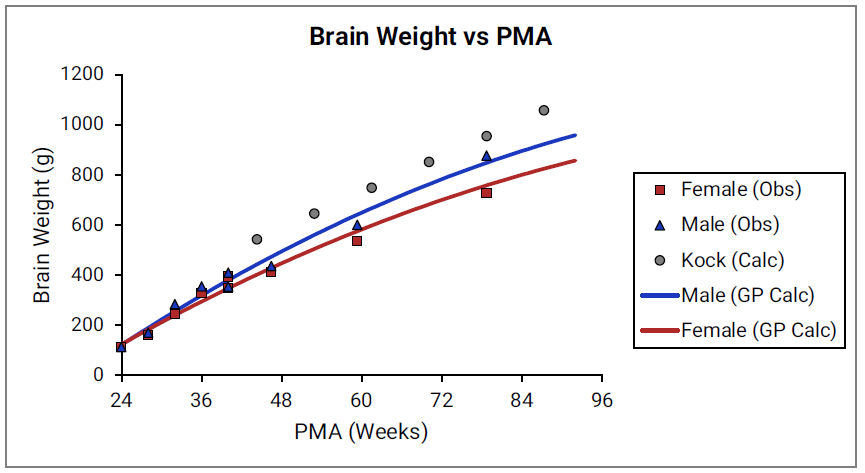
Figure 2-22: Heart weight versus PMA
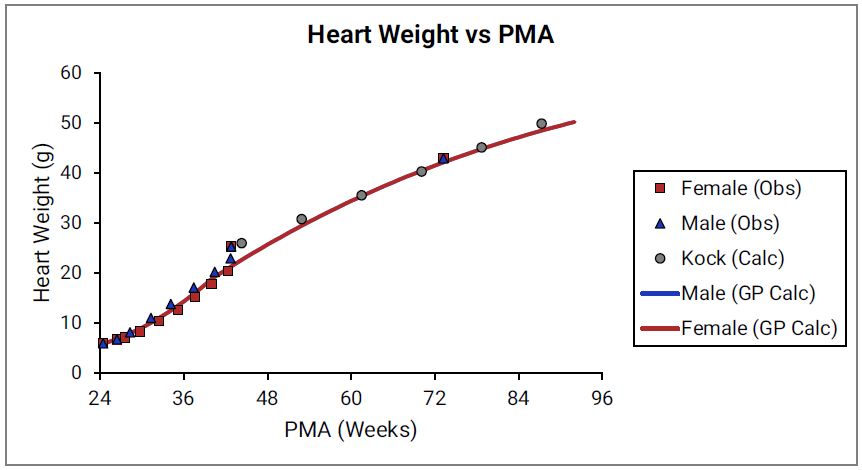
Figure 2-23: Lung weight versus PMA
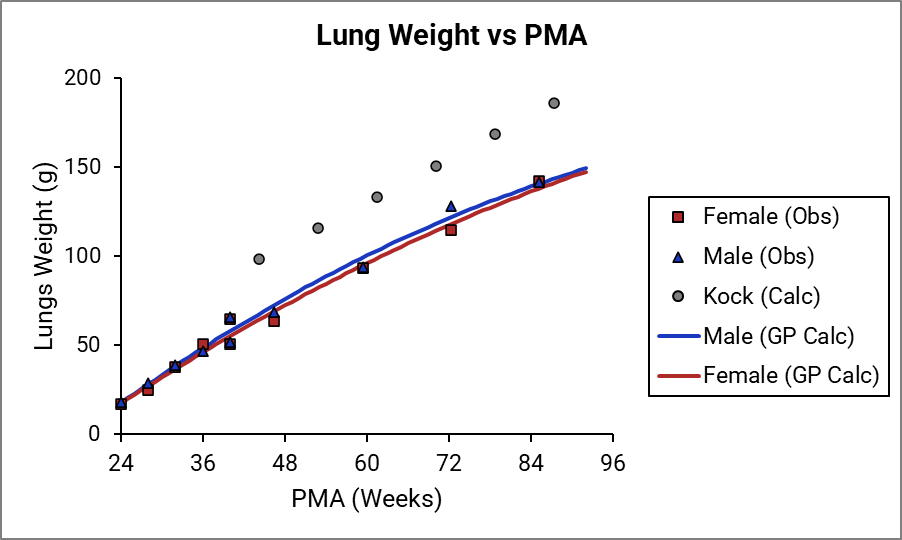
Figure 2-24: Muscle weight versus PMA
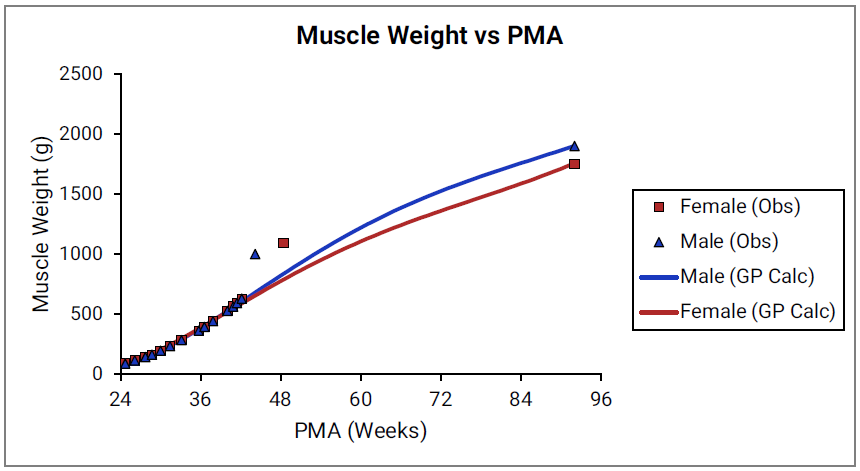
Figure 2-25: Spleen weight versus PMA
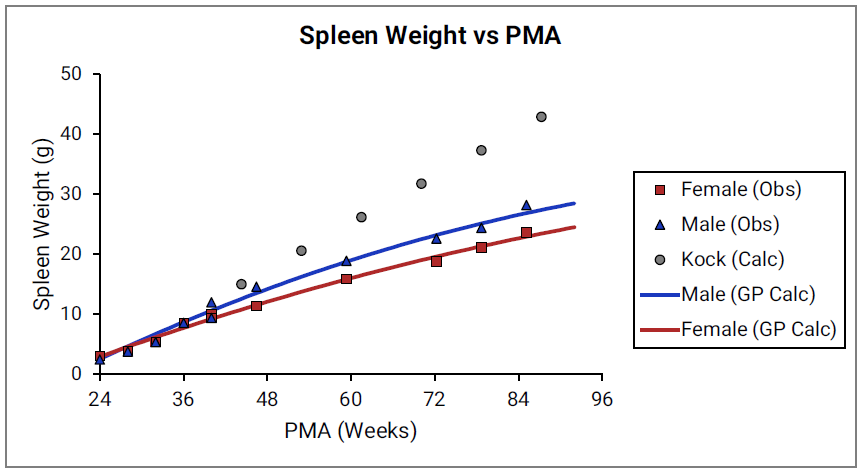
Figure 2-26: Reproductive organ weight versus PMA
Percent fat mass versus post-menstrual age (PMA) for infants up to one year old
Figure 2-27: Term-born infants
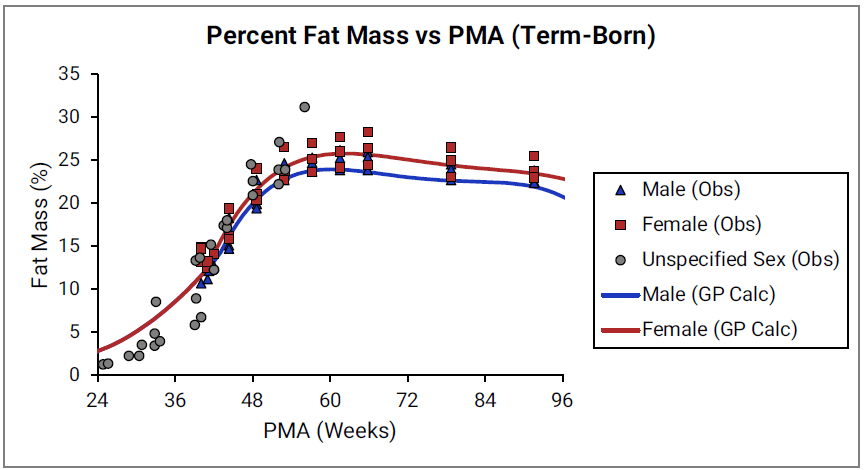
Figure 2-28: Pre-term infants
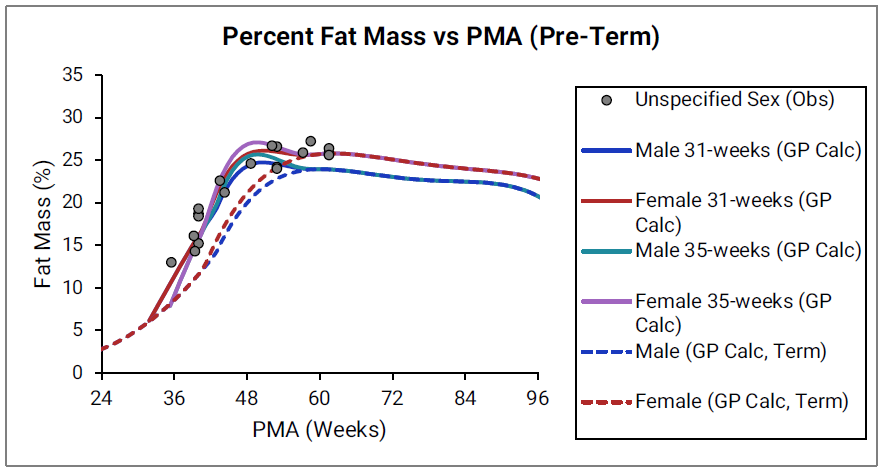
The data points represent experimental data35 39 42 46 47 48 49 50 51 52 53 54 55 56. The lines show % fat mass calculated using equations implemented in GastroPlus®. In the top graph, the data for males and females are shown in blue and red, respectively. The data from publications which did not specify the gender are shown in gray. In the bottom graph, the solid and dotted lines show 35calculated percent fat mass for males (blue) and females (blue). The dotted blue lines and dotted red lines show calculated percent fat mass for term-born infants, which are the same as the blue and red lines for term-born infants in Figure 2-27. The dark blue/ dark red lines and light blue/light red lines represent percent fat mass calculated for infants born after 31 and 35 weeks of gestation, respectively. Gender information was not included in the data for pre-term infants.
Skeletal weight
Figure 2-29: Skeletal weight versus post-menstrual age (PMA) for infants up to two years old
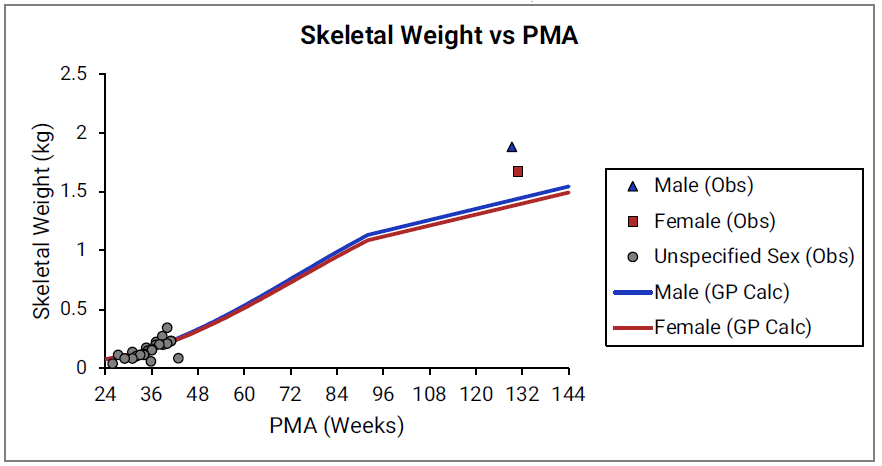
The data points represent experimental data35 57 58. The lines show skeletal weights calculated using equations implemented in GastroPlus®.
Figure 2-30: Yellow marrow content shown as fraction of total skeletal weight versus post-menstrual age (PMA) for infants up to one year old
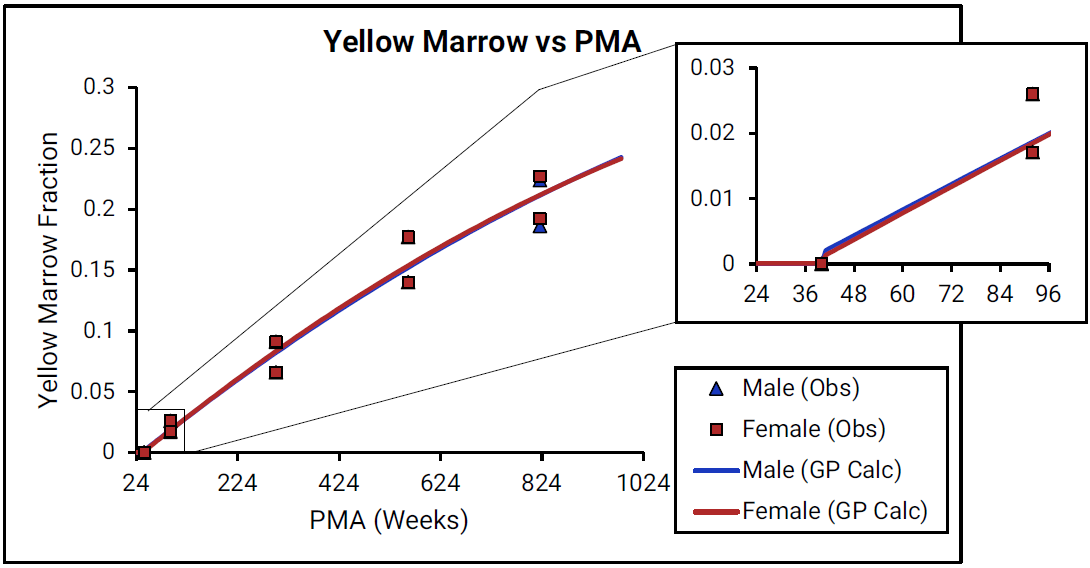
For Figure 2-30, the data points represent experimental data33 59. The lines show values that were calculated using equations implemented in GastroPlus®. Data for males and females are shown in blue and red, respectively. As there is very little detailed information for ages from term- born neonates to 1-year-old infants (PMA = 40 to 92 weeks), the insert that is included for each marrow type shows changes in the marrow content from neonates through adulthood (18 years old).
Figure 2-31: Red marrow content shown as fraction of total skeletal weight versus post-menstrual age (PMA) for infants up to one year old
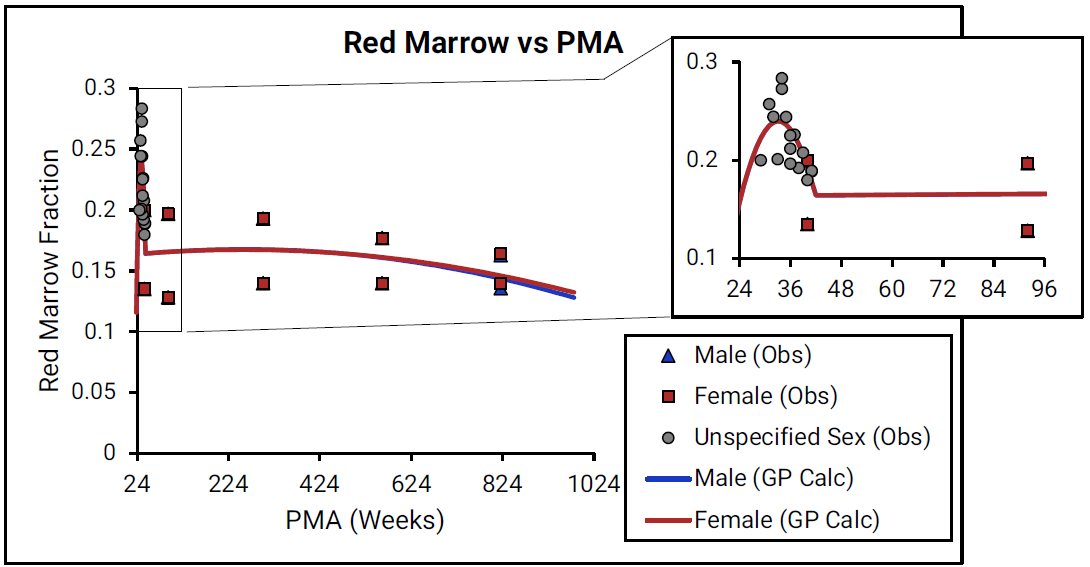
For Figure 2-31, the data points represent experimental data33 59. The lines show values that were calculated using equations implemented in GastroPlus®. Data for males and females are shown in blue and red, respectively. As there is very little detailed information for ages from term- born neonates to 1-year-old infants (PMA = 40 to 92 weeks), the insert that is included for each marrow type shows changes in the marrow content from neonates through adulthood (18 years old).
Infant blood parameters
Infant blood parameters include blood volume, cardiac output, drug-binding proteins in plasma, and hematocrit.
Blood volume
Figure 2-32: Blood volume versus post-menstrual age (PMA) for neonates born after 24- 40 weeks of gestation
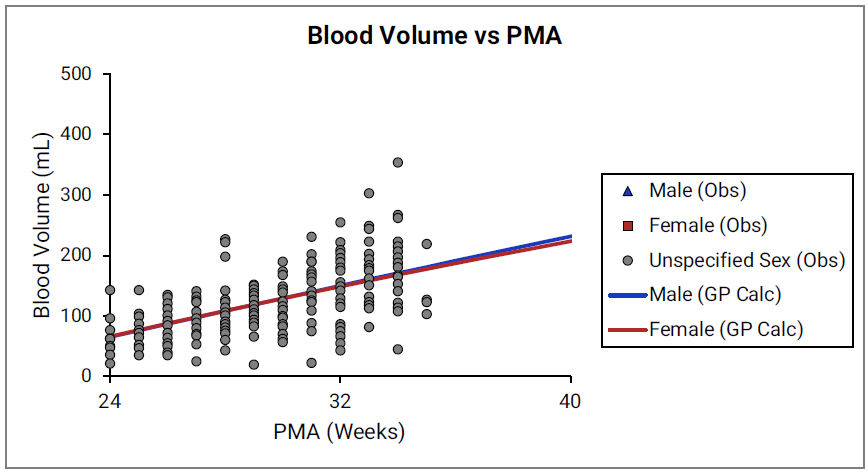
Figure 2-33: Blood volume versus post-menstrual age (PMA) for children up to 3 years old
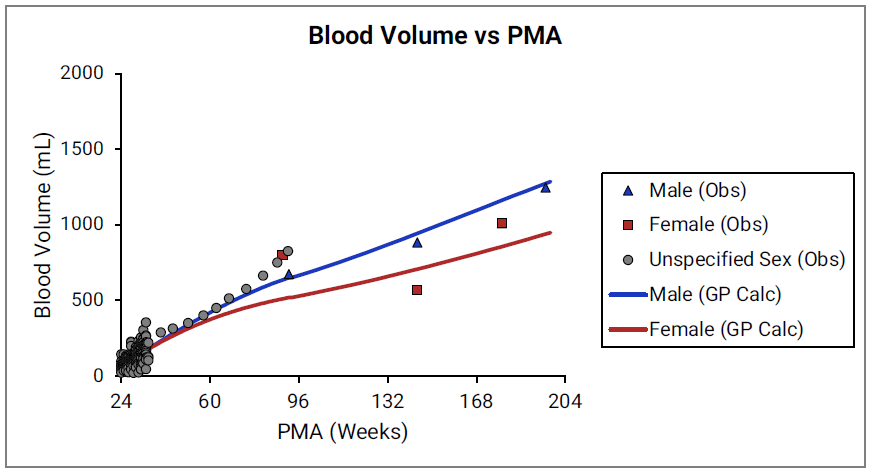
For Figure 2-32 and Figure 2-33, the data points represent experimental data34 35 60. The lines show blood volumes calculated using equations implemented in GastroPlus®. The data for males and females are shown in blue and red, respectively. The data from publications that did not specify the gender are shown in gray.
Cardiac output
Figure 2-34: Cardiac output versus post-menstrual age (PMA) for infants up to one year old
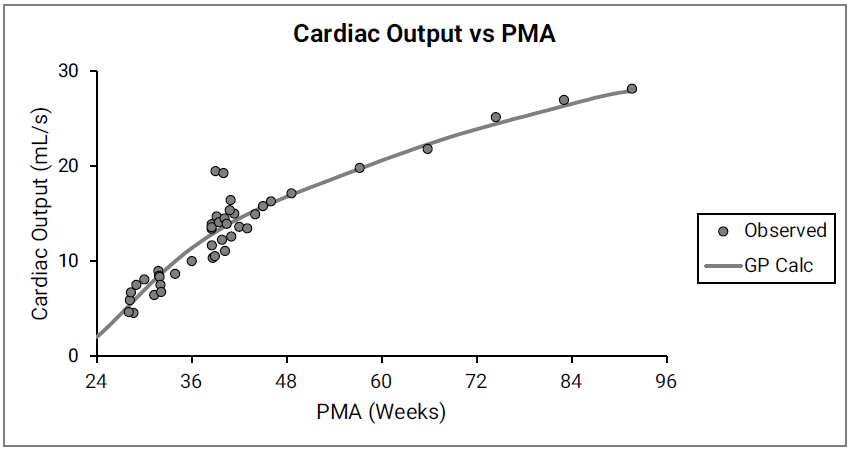
The data points represent experimental data61 62 63 64 65 66. The line shows cardiac output calculated in GastroPlus®. Gender information was not included in the data.
Blood proteins and hematocrit
GastroPlus® also accounts for differences in fraction unbound in plasma (fup) and the differences in the blood/plasma drug concentration ratio (Rb:p) between children and adults due to different levels of protein and hematocrit, respectively.
As shown in Equation 2-54, the fup scaling is based on the equation by McNamara67 and it assumes that the input experimental percent unbound in plasma is representative of non-specific drug to protein binding in adult plasma:
Equation 2-54: McNamara’s equation for infant physiologies
where:
|
Variable |
Definition |
|
|
The fraction of drug unbound in pediatric plasma. |
|
|
The fraction of drug unbound in adult plasma. |
|
|
The protein concentration in pediatric plasma. |
|
|
The protein concentration in adult plasma. |
The ratio of pediatric to adult plasma protein (Cp,protein(ped)/Cp,protein(adult)) is based on the ontogeny of the two major drug-binding proteins in plasma, α1-acid glycoprotein (AAG) and albumin as shown in Figure 2-35 and Figure 2-36.
Figure 2-35: AAG concentration in plasma (shown as % of adult levels) versus post-menstrual age (PMA) for infants up to one year old
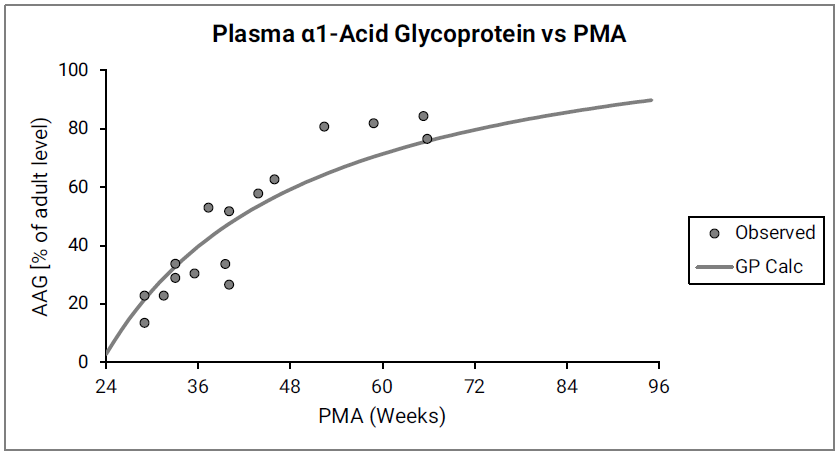
Figure 2-36: Albumin concentration in plasma (shown as % of adult levels) versus post-menstrual age (PMA) for infants up to one year old
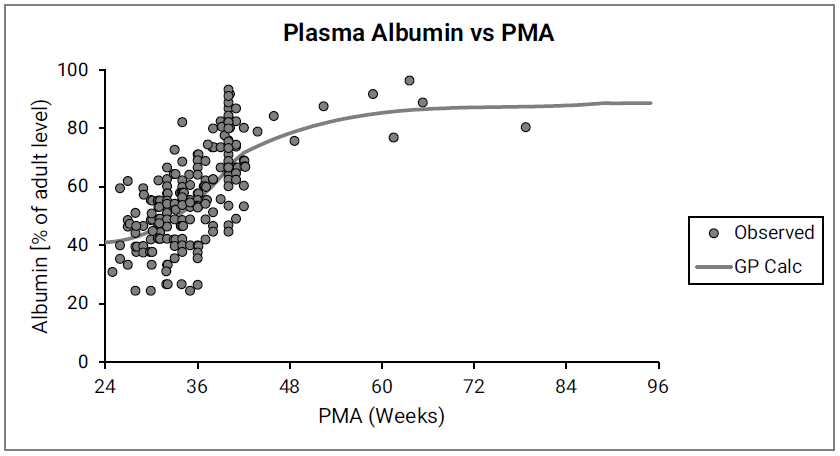
The data points represent experimental data68 69 70 71 72 73 74 75 76. The lines show values calculated using equations in GastroPlus®.
McNamara67 also pointed out the propensity of different compounds to bind preferentially either to plasma AAG or to plasma albumin. Simulations Plus continues to research the structural determinants for this preference, and a more detailed binding model might be implemented in future versions of GastroPlus®. For now, Simulations Plus is combining the ontogeny of AAG and albumin to calculate the changes in total drug-binding plasma protein with age, and then using the total drug-binding protein (AAG + albumin) to scale fup values. Predictions using total drug-binding protein were compared to predictions based on the major binding protein for each compound67.
Figure 2-37 summarizes the performance of both approaches.
Figure 2-37: Comparison of predicting infant fup
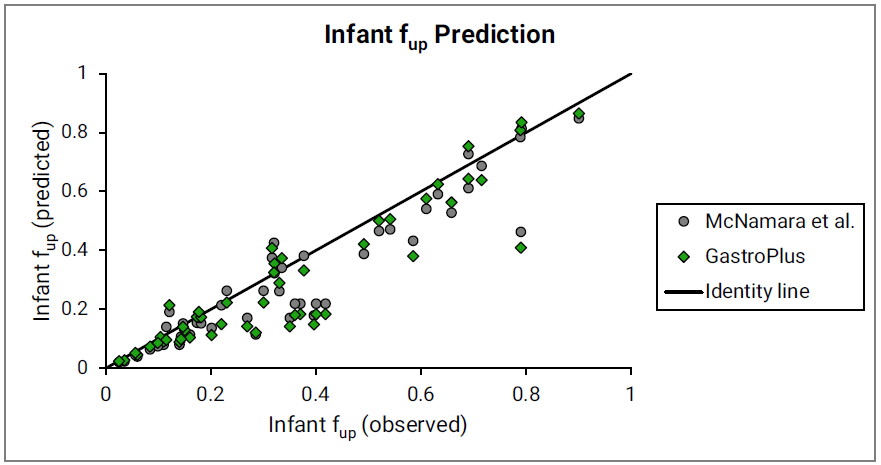
The major binding protein (gray circles) as proposed by McNamara67 and the total drug-binding protein (green diamonds) as currently implemented in GastroPlus® were used. Observed data are used as compiled by McNamara et al. Identity line is shown for reference.
As shown in Equation 2-55, infant Rb:p scaling uses a derived equation based on the assumption that the input experimental Rb:p value represents binding to red blood cells in adult blood, where the hematocrit = 0.45.
Equation 2-55: Infant Rb:p scaling
where:
|
Variable |
Definition |
|
|
The drug blood/plasma concentration ratio as indicated for infants (ped) or adults (adult). |
|
|
The hematocrit, expressed as a fraction, in pediatric blood. |
|
|
The hematocrit, expressed as a fraction, in adult blood. |
Figure 2-38 shows the changes in hematocrit with age.
Figure 2-38: Hematocrit versus post-menstrual age (PMA) for infants up to 1 year old
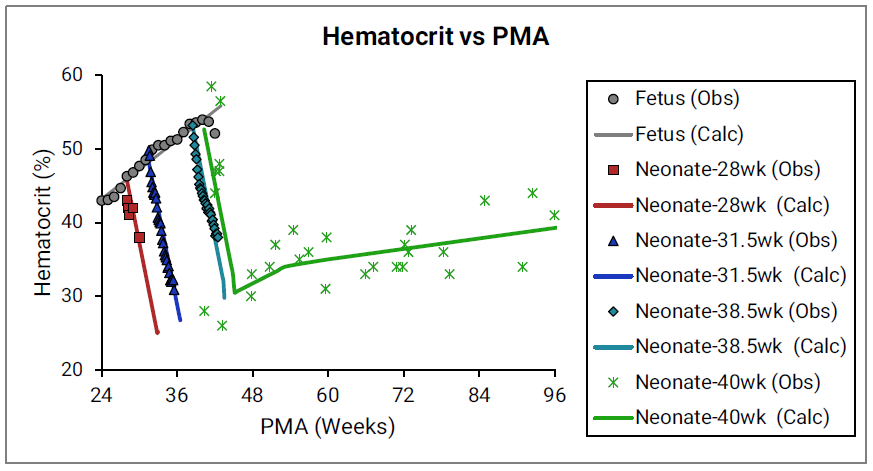
The data points represent experimental data61 77 78. The plotted lines represent values calculated using equations in GastroPlus®. Individual colors represent fetus (gray), neonates born after 28 (red), 31.5 (blue), 38.5 (teal), and 40 (green) weeks of gestation. The experimental data shown in green were not accompanied by exact specification of gestation age for each subject78, but based on the reported body weights for the youngest subjects and the author’s description of the subjects as “normal well children,” Simulations Plus assumed these subjects to be term-born infants.
Infant tissue compositions
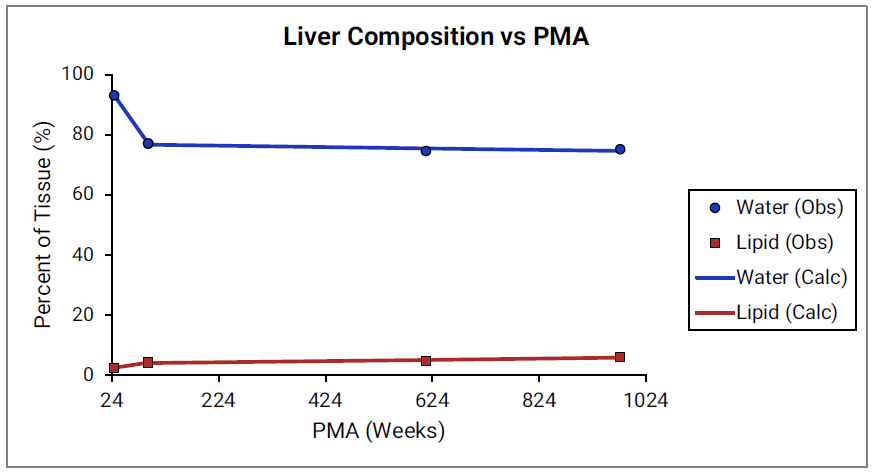
For Figure 2-39 through Figure 2-44, the data points represent experimental data79. The plotted lines show values calculated using equations implemented in GastroPlus®. Data for percent of water and total lipid in each tissue are shown in blue and red, respectively. Because only sparse experimental data is available for these tissue compositions, the entire range of ages from newborn born after 24 weeks of gestation up to an 18-year-old adult (PMA = 976 weeks) is shown.
Figure 2-39: Tissue composition versus post-menstrual age (PMA) for adipose
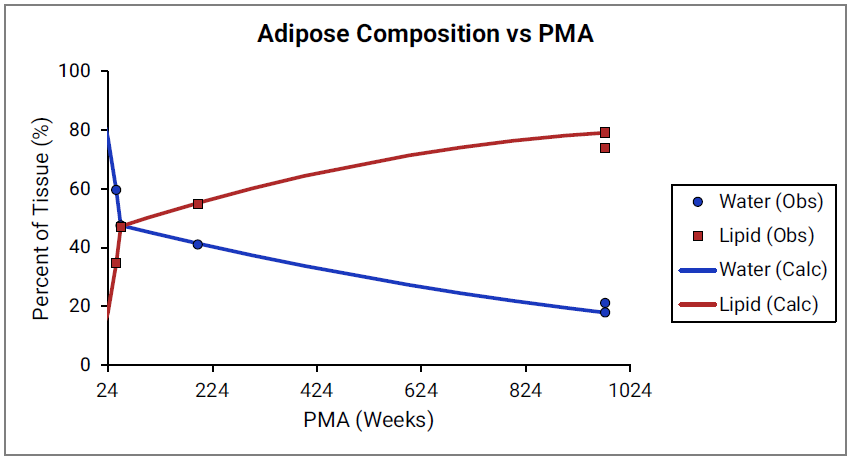
Figure 2-40: Tissue composition versus post-menstrual age (PMA) for brain
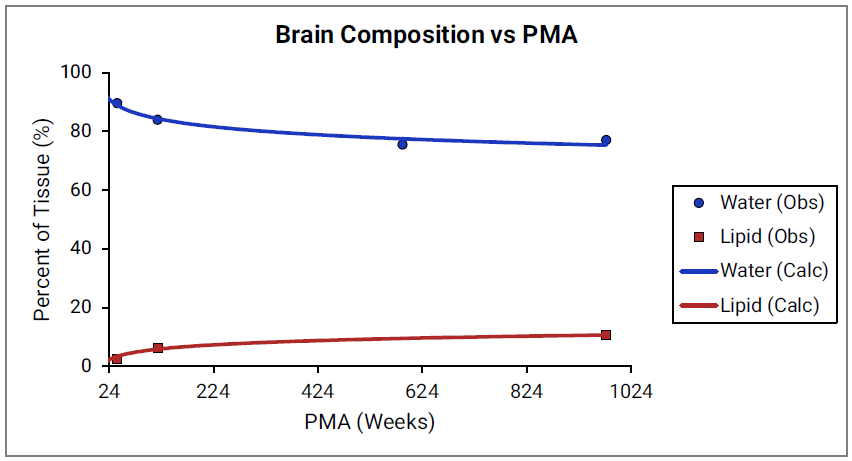
Figure 2-41: Tissue composition versus post-menstrual age (PMA) for kidney
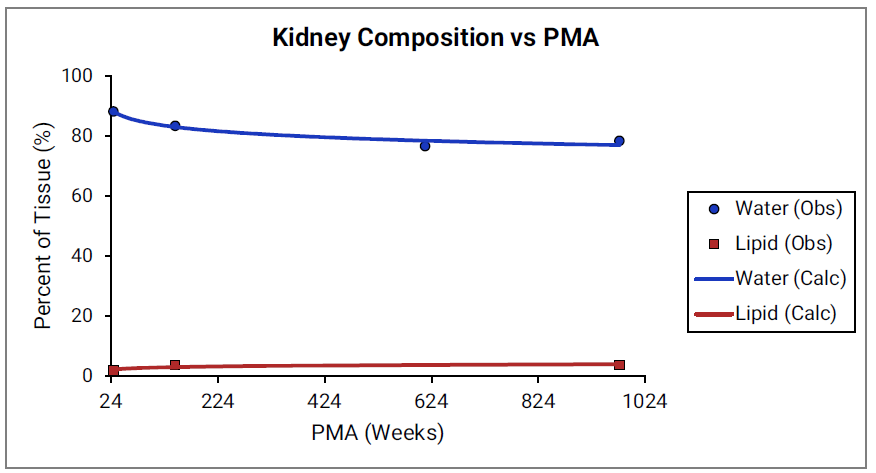
Figure 2-42: Tissue composition versus post-menstrual age (PMA) for lung
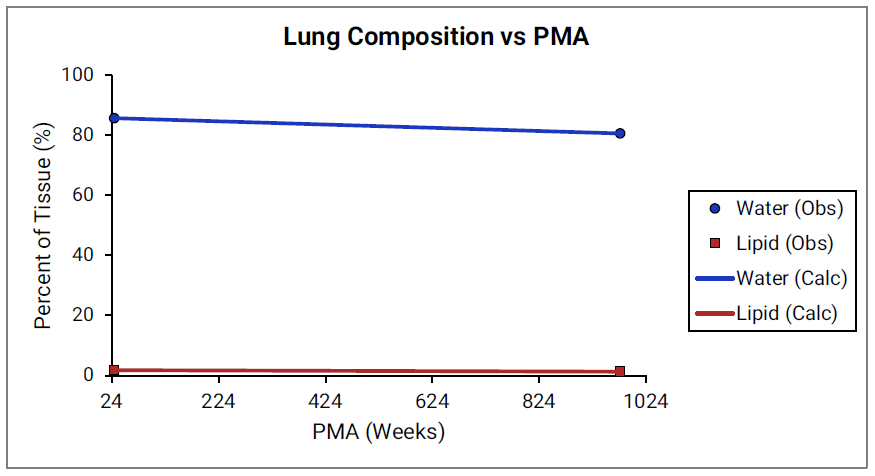
Figure 2-43: Tissue composition versus post-menstrual age (PMA) for heart
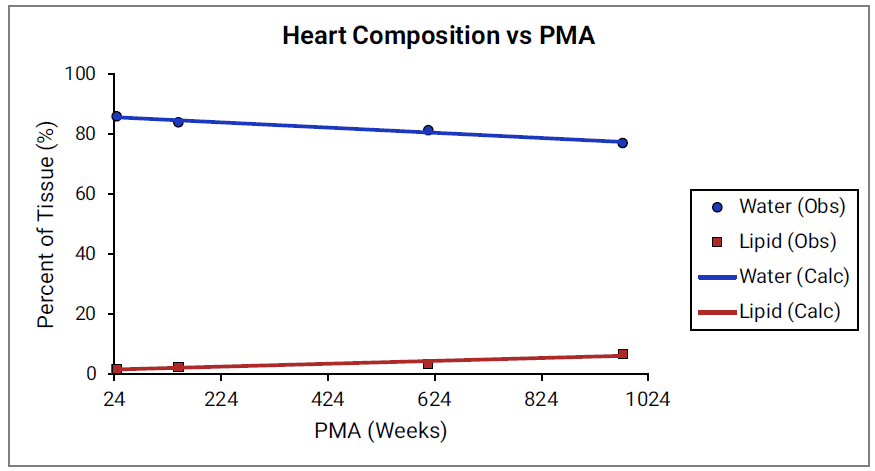
Figure 2-44: Tissue composition versus post-menstrual age (PMA) for liver
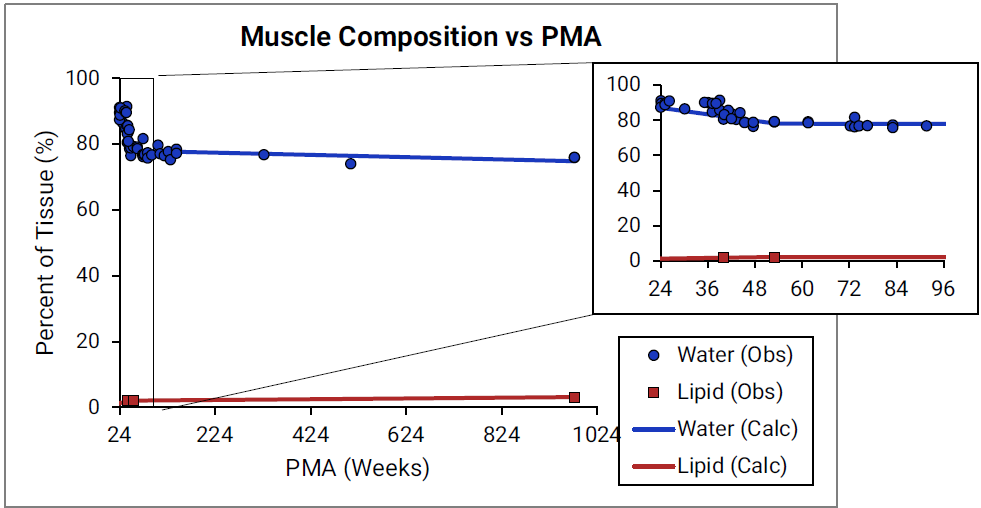
For Figure 2-45 through Figure 2-47, the data points represent experimental data35 79 80 81 82. The plotted lines represent values calculated using equations in GastroPlus®. Data for percent of water and total lipid in each tissue are shown in blue and magenta, respectively. Because only sparse experimental data is available for red marrow and spleen tissue compositions, the entire range of ages from newborn born after 24 weeks of gestation up to an 18-year-old adult (PMA = 976 weeks) is shown. Additional rich sets of data for water content in muscle of infants were available in literature80 82 and an additional plot with details for infants up to 1-year-old is shown as a zoomed in plot for this tissue.
Figure 2-45: Tissue composition versus post-menstrual age (PMA) for red marrow
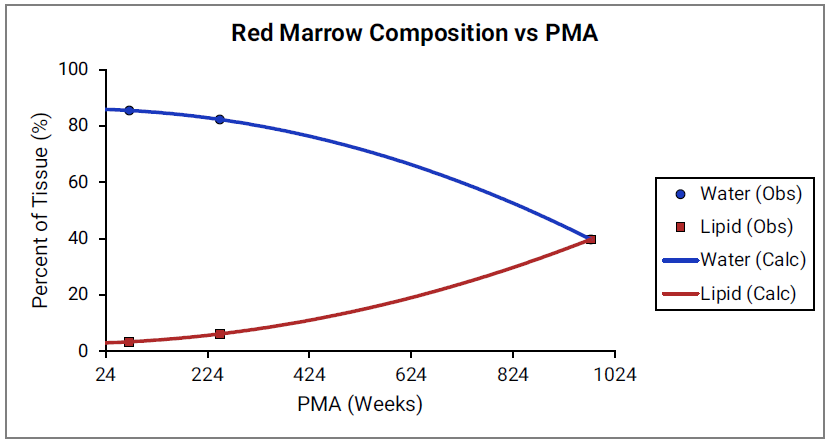
Figure 2-46: Tissue composition versus post-menstrual age (PMA) for spleen
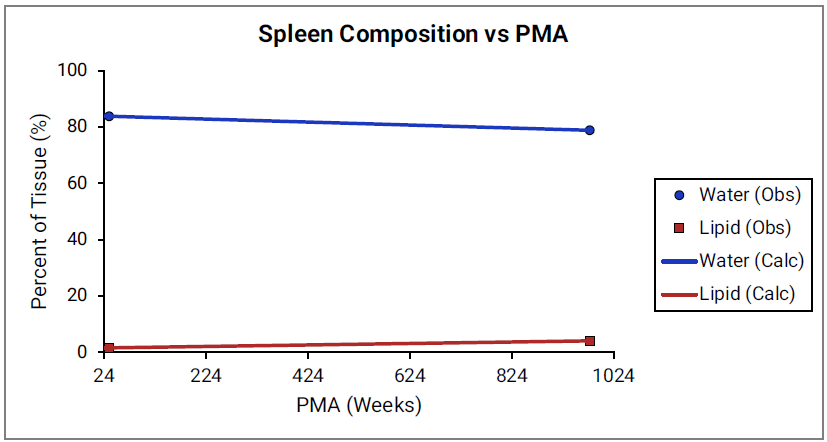
Figure 2-47: Tissue composition versus post-menstrual age (PMA) for muscle
Age dependency for extracellular volume fraction was not found for individual tissues and is estimated from changes in total body water (TBW) and total extracellular water (EXTW).
Figure 2-48: Total body water and extracellular water versus post-menstrual age (PMA)
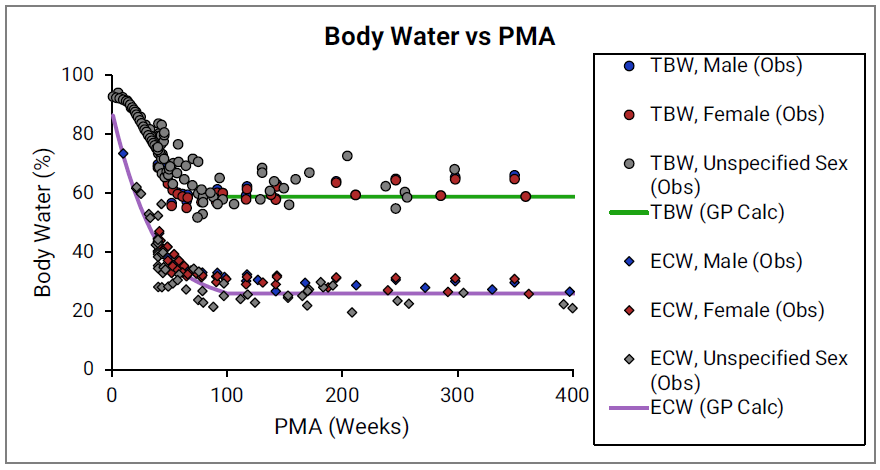
The circles and diamonds represent experimental data for total body water35 49 83 84 85 and extracellular water35 49 83 84 85, respectively. The plotted lines represent values calculated using equations in GastroPlus®. Data for males and females are shown in blue and red, respectively. The data from publications which did not specify the gender are shown in gray.
Infant renal functions
The development of glomerular filtration rate (GFR) and of tubular secretion rate has been the subject of extensive research. Numerous studies have documented changes in GFR in both fetus and post-birth. In general, it was observed that GFR development is slower in utero and exhibits a sharp increase in the first few days after birth or after reaching 33-35 weeks PMA, whichever occurred later. This behavior corresponds to nephrogenesis being completed at approximately 35-36 weeks of gestational age. The equations that are incorporated into GastroPlus® for infant renal functions account for the effects of gestational age and postnatal age on GFR in the first few weeks after birth (Figure 2-49). After approximately 12 weeks of age, the effect of gestational age does not seem to be as dominant, and GFR is estimated based on postnatal age alone (Figure 2-50).
Figure 2-49: GFR versus post-menstrual age (PMA) for neonates up to 12 weeks old (top) and calculated versus observed for same data (bottom)
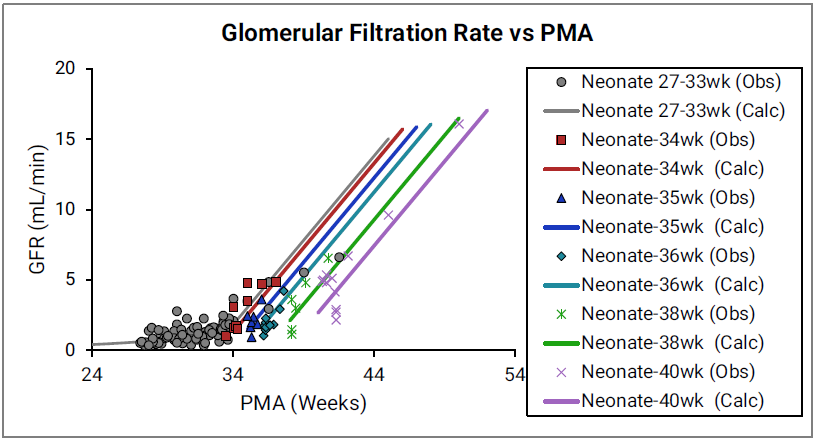
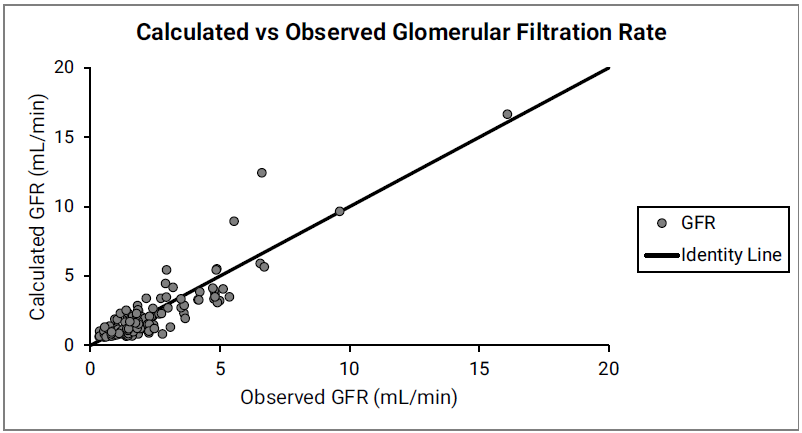
For the top plot, the data points are as follows for the number of weeks born after gestation: 27-33 (gray), 34 (red), 35 (blue), 36 (teal), 38 (green) and 40 (magenta). The data points represent experimental data86 87 88 89. Lines show GFR calculated in GastroPlus®.
Figure 2-50: GFR versus post-menstrual age (PMA) for infants and children < 6 years old
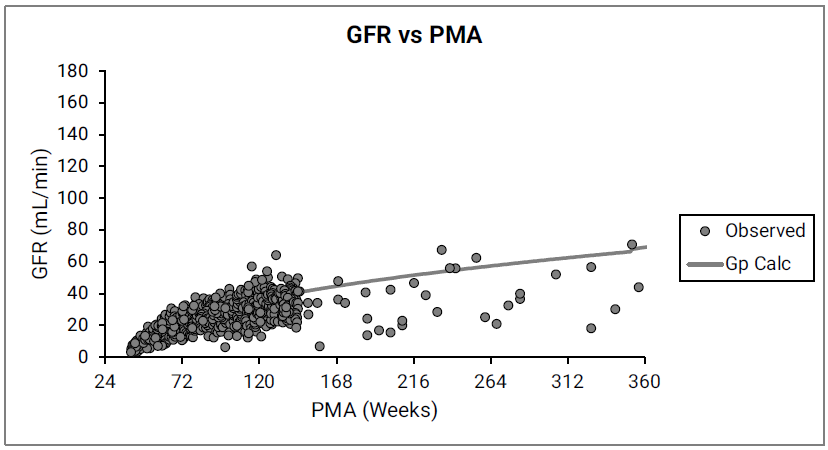
The data points represent experimental data78 90 91 92 93. The line shows GFR calculated in GastroPlus® for infants and children from 12 weeks to 6 years of age.
Disease conditions
The PEAR algorithms account for known physiological changes in hepatic impairment, renal impairment and obesity. When creating a new PBPK model, a user has the option to select physiology for different degrees of hepatic or renal impairment. Physiological changes in obesity are accounted for automatically when a user-defined body weight and BMI indicate an obese subject. Brief summaries of the literature sources used to parameterize each of these conditions are provided in the following sections.
Liver cirrhosis
GastroPlus® follows the Child-Pugh classification to characterize different degrees of liver cirrhosis. The systemic physiological changes—functional liver volume, hepatic and intestinal activities of CYP450 enzymes, plasma protein levels, hematocrit, hepatic and arterial blood flow, cardiac output, glomerular filtration rate, and so on—are incorporated as previously published94.
Renal Impairment
As summarized in Table 2-6, GastroPlus® follows the classification of renal function in the US FDA guidance (FDA/CDER 2010).
Table 2-6: Classification of renal function in GastroPlus®
|
Description |
eGFR |
CLcr |
|
Normal |
>90 |
>90 |
|
Mild decrease in GFR |
60–89 |
60–89 |
|
Moderate decrease in GFR |
30–59 |
30–59 |
|
Severe decrease in GFR |
15–29 |
15–29 |
|
End Stage Renal Disease (ESRD) |
<15, not on dialysis |
<15, not on dialysis |
The information about systemic physiological changes—GFR, hematocrit, plasma protein levels, hepatic CYP450 enzymes, gastric emptying rates, and so on—was collected from multiple literature sources94 95 96 97 98 99 100.
Obesity
As summarized in Table 2-7, GastroPlus® follows the standard WHO definition for overweight and obesity for adults over 18 years old101.
Table 2-7: Classification of overweight and obesity for adults by Body Mass Index (BMI)
|
BMI (kg/m2) |
Description |
Co-morbidity Risk |
|
<18.5 |
Underweight |
Low |
|
18.5–24.99 |
Healthy |
Average |
|
25–29.99 |
Overweight |
Mildly increased |
|
30–39.99 |
Obese (Combined Obese Class I and Class II) |
Moderate to Severe |
|
>40 |
Morbidly obese |
Very severe |
As summarized in Table 2-8, GastroPlus® follows the classification suggested by the U.S. Centers for Disease Control and Prevention for overweight and obesity for children between the ages of 2 and 18 years of age. The look-up table that the CDC provides is used to determine the percentiles for each age.
www.cdc.gov/growth-chart-training/hcp/using-bmi/plotting-interpreting-bmi.html
Table 2-8: Classification of overweight and obesity for children (2-18years) by Body Mass Index (BMI)
|
Description |
Percentile Range |
|
Underweight |
<5th percentile |
|
Healthy |
5th–85th percentile |
|
Overweight |
85th–95th percentile |
|
Obese |
>95th percentile |
The information about systemic physiological changes—lipid content in muscle, composition of plasma, GFR, tissue sizes as percent of total body weight, hepatic CYP450 enzymes, and so on—was collected from multiple literature sources102 103 104 105 106 107 108 109 110 111 112 113 114 115.
Contradicting modifications were suggested in publications for several physiological parameters, such as the GI physiology (transit time, volume, pH values) or UGT expression levels. Until more definitive information can be found, the default values that are used for the parameters are those of healthy (normal weight) subjects.
The changes in tissue sizes as a percent of total body weight are included in the model based on published information112 115.
As shown in Figure 2-51, the physiologies also account for variations in the tissue blood flows and the resulting changes in the cardiac output.
Figure 2-51: Cardiac output versus body weight for Caucasian adults
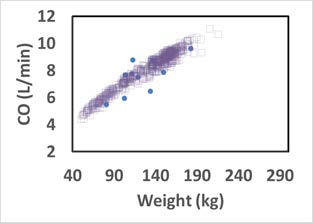
The solid circles represent experimental data116. The open squares represent the cardiac output of the virtual subjects (a group of 20 to 60 year old adults) generated by a GastroPlus® algorithm.
Pregnancy
In the PEAR™ module, the Pregnancy model offers two distinct settings based on gestational age (GA):
-
For a gestational age (GA) between 0-6 weeks, only the uterus tissue is added to the model.
-
For a GA greater than 6 weeks, in addition to the uterine tissue, placental tissues (fetal and maternal counterparts), amniotic fluid, fetal tissue (as a whole) and fetal (venous return and arterial supply) blood circulation are added to the model.

Because the fetal blood circulation starts to establish itself around five to six weeks of gestation, the gestational age of six weeks was selected to separate the two settings.
Figure 2-52 shows the layout of the GastroPlus® Pregnancy model for a GA greater than six weeks.
Figure 2-52: Layout of the Pregnancy model for a GA greater than six weeks
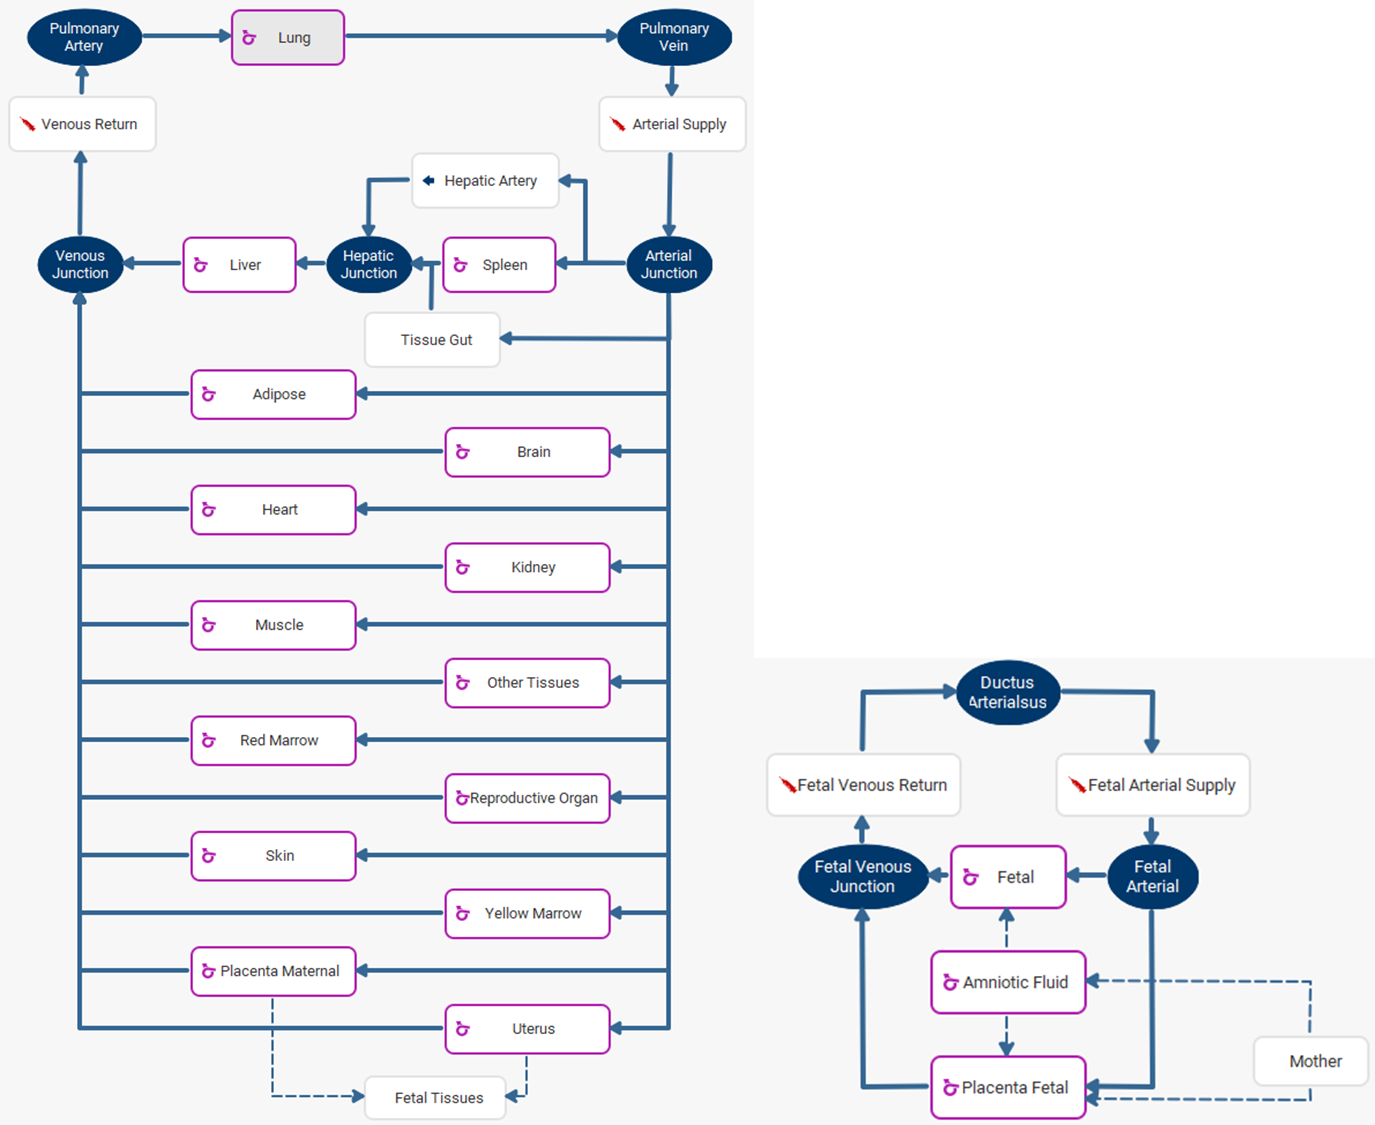

To view the fetal tissues, double click on Fetal Tissues. To go back to the mother tissues, double click on Mother.
Pregnancy changes modeling
The maternal body incurs a series of physiological changes during pregnancy, including, but not limited to, weight gain, changes in enzyme expression levels, enlargement of certain tissues such as the uterus, placenta, brain and kidney, an increased amount of plasma volume, glomerular filtration rate (GFR) increase, GI changes (increased stomach transit time), and so on117 118 119 120 121 122. The volume of fetal tissue and fetal blood also increases with GA. All these changes have been incorporated into the built-in pregnancy PEAR physiology. If you specify the maternal age, GA, and fetal gender, then built-in equations generate the default physiology; however, you can further modify the default physiologies for both maternal and fetal subjects, such as the body weight and height, the cardiac output, maternal weight gain, and individual tissue weights and perfusions.
Maternal weight gain
Weight gain is one of the major changes in the maternal physiology during pregnancy. The total body weight for the maternal subject is the sum of the pre-pregnancy body weight and the weight gain during pregnancy. The pre-pregnancy weight is used to calculate the tissue weights. For tissues which don't change with pregnancy, such as the heart, spleen, liver and lung, the tissue weight stays the same for any GA. For tissues which change with GA, the percent of increase is calculated and added to the pre- pregnancy tissue weight. Carmichael et al.123 have published weight gain percentiles for different BMI groups. The underweight, normal weight, and overweight subjects have consistent measurements throughout the pregnancy, while the obese group showed significantly lower weight gain compared to the other groups. Similar results were also presented in another study124. In GastroPlus®, the averaged weight gain from all underweight, normal weight, and overweight subjects is implemented as shown in Figure 2-53.
Figure 2-53: Weight gain during pregnancy
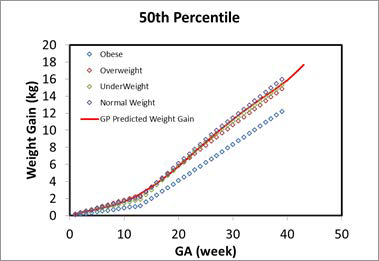
The solid red line represents the calculation in GastroPlus®. The color-coded diamonds are the observed weight gain for obese, overweight, normal weight, and underweight subjects123.
Fetal height and weight
As shown in Figure 2-54, the fetal weight and height at early pregnancy were extrapolated from the preterm (12-16 weeks) infant and fetus measurements, which is the same data that was used for developing the infant PBPK models. The other measurements, such as GFR, fetal hematocrit, liver size (which is used in the scaling for enzyme expressions), blood volume, and percent of protein as adult level, were either extrapolated from current infant equations or refitted against the available data for early pregnancy. Figure 2-55 shows the hematocrit versus either the PMA for infants up to a year old or the GA for a fetus which was refitted with the Dallmann120 equation and available observed data which were used to build the infant PBPK models. Figure 2-54 shows the GFR versus either the PMA for infants up to a year old or the GA for a fetus, which was extrapolated from infant PBPK models.
Figure 2-54: Fetal weight and height prediction in GastroPlus® versus observed data
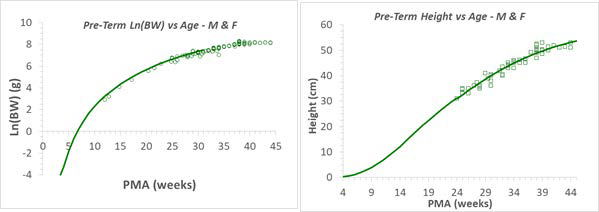
The solid line in each graph represents the GastroPlus® predicted value for fetal weights (left) and heights (right). The green circles and squares are the observed values from multiple publications. Refer to Infant physiologies for the referenced publications.
Figure 2-55: Hematocrit versus post-menstrual age (PMA) for infants up to 1 year old or gestational age (GA) for fetus
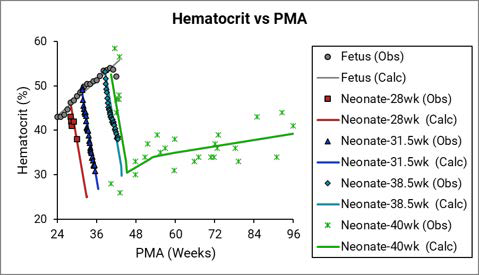
The legend is identical to that for Figure 2-38. The solid yellow triangles represent data that was calculated from the equation that was provided in the Dallmann et al. reference120. The final hematocrit equation (the black line) for a fetus was fitted with the Dallmann equation and the rest of the observed data.
Figure 2-56: GFR versus post-menstrual age (PMA) for infants up to 1 year old or gestational age (GA) for a fetus
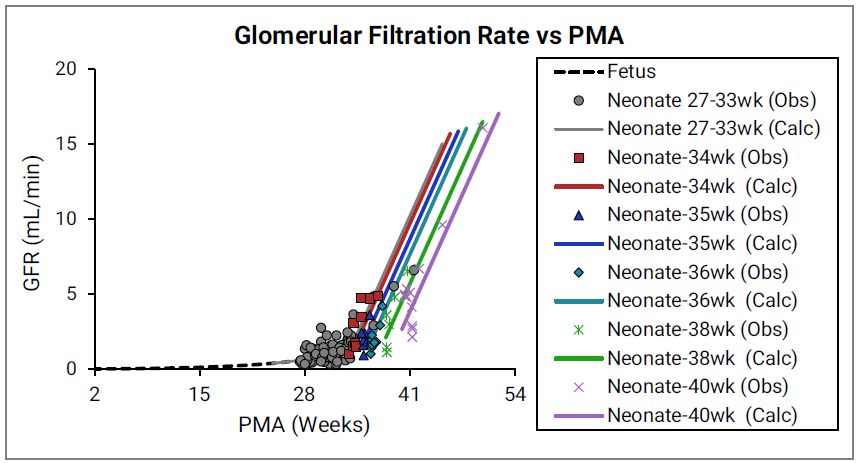
The legend is identical to that for Figure 2-49. The earliest observed values were measured for pre-term infants at 28 weeks. Simulations Plus extrapolated the curve to calculate the GFR for a fetus less than 28 weeks.
Pregnancy pathways modeling125
Amniotic fluid is a clear, yellowish liquid that surrounds the fetus during pregnancy. This fluid is crucial in fetal development. It provides necessary nutrients such as electrolytes, liquids, carbohydrates, and proteins while serving as a barrier for bacteria growth and absorbing outside pressure and physical forces. Maintaining the normal amount of fluid ensures the fetus development. Conditions such as oligohydramnios, which is too little amniotic fluid), or polyhydramnios, which is too much amniotic fluid, can cause fetal growth disorder and preterm labor. The regulation of the amniotic fluid includes three pathways126:
-
The trans-membrane pathway: The movement of water and solute between amniotic fluid and maternal blood within the wall of the uterus.
-
The intra-membranous pathway: The transfer of water and solutes from the amniotic cavity to the fetal circulation (blood) across the amniotic membranes. This transfer occurs in the placenta, the fetal skin, and the umbilical cord. The pathway can be divided into active and passive components, with vesicular pressure driving the active component and osmosity driving the passive component.

The intra-membranous pathway partially disappears after the fetus skin is fraternized at a gestational age (GA) = 20 weeks.
-
The fetal pathway: The transfer of water and solutes between the amniotic fluid and fetal tissue.
These three pathways have been simplified and incorporated into GastroPlus®.
Fetal and amniotic fluid tissues modeling
The rate constants for the movement of the water and solute are not well-established for a human. Some measurements are available for ovine fetus126 127, which have been adapted by scaling based on the fetal body weight. Equation 2-56 describes the homeostasis of amniotic fluid.
Equation 2-56: Homeostasis of amniotic fluid
where:
|
Variable |
Definition |
|
|
The fetal urinary rate. |
|
|
The secretion rate from fetal tissue. |
|
|
The fetal swallowing rate. |
|
|
The active portion of the intra-membranous pathway. |
Perfusion-limited fetal tissues
Because the amniotic fluid is surrounded by amnion and is avascular in humans119, the tissue type of the amniotic compartment is different from other tissues. For convenience of calculating the model derivatives, the tissue type of the amniotic compartment in GastroPlus® has been set to the same tissue type as that of the fetal compartment, which results in the fetal tissue being modeled as a whole tissue in GastroPlus®. During modeling, you have the option of selecting a balanced rates option, which automatically balances the in and out rates for the amniotic fluid based on the homeostasis assumption. You also have the option of specifying a Rate Scale Factor, which simultaneously scales the following five rate constants:
|
Variable |
Definition |
|
|
The secretion rate from fetal tissue. |
|
|
The fetal swallowing rate. |
|
|
The intramembranous fluid transfer rate constant (defined in the amniotic fluid compartment) that represents osmosis and vesicular routes, respectively. |
|
|
The transmembranous fluid transfer rate constant (defined in the amniotic fluid compartment) that between the amniotic fluid and the uterus. |
Equation 2-57 and Equation 2-58 detail the fetal pathways, which are modeled directly as interactions between the fetal tissue and the amniotic fluid. For perfusion-limited tissue, the solute exchange happens between the amniotic fluid and the vascular space of the fetal tissue.
Equation 2-57: Fetal pathway for perfusion-limited tissue (amniotic fluid)
where:
|
Variable |
Definition |
|
|
The total volume of the amniotic fluid. |
|
|
The total concentration of drug in the amniotic fluid. |
|
|
The concentration of unbound drug in the amniotic fluid. |
|
|
The total concentration of drug in the fetal tissue. |
|
|
The intra-membranous fluid transfer rate constant (defined in the amniotic fluid compartment) representing osmosis. |
|
|
The trans-membranous fluid transfer rate constant between the uterus and the amniotic fluid. |
|
|
The fetal tissue/plasma partition coefficient. |
|
|
The fraction of unbound drug in the fetal plasma. |
|
|
The total concentration of drug on the fetal side of the placenta. |
|
|
The tissue/plasma partition coefficient on the fetal side of the placenta. |
|
|
The fetal filtration clearance rate. |
|
|
The secretion rate from fetal tissue. |
|
|
The fetal swallowing rate. |
|
|
The total concentration of drug in the uterine tissue. |
|
|
The uterine tissue/plasma partition coefficient. |
|
|
The general clearance rate for the fetal tissue. |
Unless otherwise noted, all variables are defined for the amniotic fluid or fetal tissue.
Equation 2-58: Fetal pathway for perfusion-limited tissue (fetal tissue)
where:
|
Variable |
Definition |
|
|
The total volume of the fetal tissue. |
|
|
The fetal blood flow. |
|
|
The total concentration of drug in arterial (in) blood in fetal tissue. |
|
|
The fetal blood/plasma drug concentration ratio. |
|
|
The fetal tissue/plasma partition coefficient. |
|
|
The intra-membranous fluid transfer rate constant (defined in the amniotic fluid compartment) representing osmosis and vesicular routes, respectively. |
|
|
The concentration of unbound drug in the amniotic fluid. |
|
|
The total concentration of drug in the fetal tissue. |
|
|
The fraction of unbound drug in the fetal plasma. |
|
|
The fetal filtration clearance rate. |
|
|
The secretion rate from fetal tissue. |
|
|
The fetal swallowing rate. |
|
|
The general clearance rate for the fetal tissue. |
Permeability-limited fetal tissues
For permeability-limited tissue, the solute exchange happens between the amniotic fluid and the extravascular space of the fetal tissue. Consequently, to model the fetal pathway for permeability-limited tissue, the fetal tissue concentration in Equation 2-57 and in Equation 2-58 is automatically replaced with the fetal extravascular concentration.
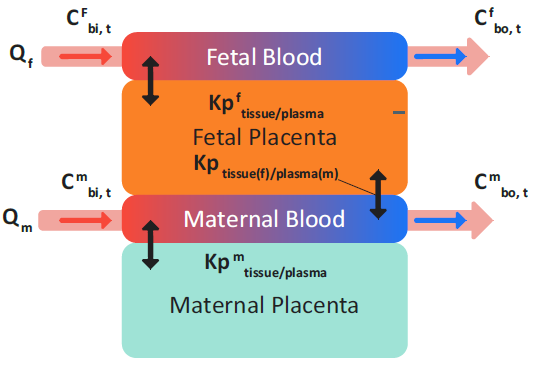
Placenta tissue modeling
The placenta tissue is modeled as two compartments: maternal placenta and fetal placenta, where the maternal placenta is facing the maternal blood circulation and the fetal placenta is facing the fetal blood circulation. The two compartments represent the same tissue, and therefore, both compartments must be modeled as the same tissue type: either both perfusion limited or both permeability limited.
For the equations that describe the modeling of the fetal and maternal placenta tissue, the variables were defined according to the following rules:
|
Variable |
Definition |
|
|
Represents concentration, amount (mass) and volume, respectively. |
|
|
The total concentration of drug in arterial (in) blood and venous (out) blood in tissue. |
|
|
Represents fetal, maternal, and total (across both fetal and maternal), respectively. |
|
|
The extracellular fluid to plasma partition coefficient. |
|
|
The (permeability*surface area) product for the tissue, which can be either on the apical side (api) or the basolateral side (baso). |
|
|
The tissue/plasma partition coefficient between maternal tissue and maternal plasma. |
|
|
The tissue/plasma partition coefficient between fetal tissue and maternal plasma. |
|
|
The tissue/plasma partition coefficient between fetal tissue and fetal plasma. |
|
|
The tissue/plasma partition coefficient between total placenta tissue (maternal and fetal) and maternal plasma. |
|
|
The total amount (mass) of drug in the maternal placenta and the fetal placenta, respectively. |
|
|
The maternal blood/plasma drug concentration ratio and the fetal blood/plasma concentration ratio, respectively. |
|
|
The tissue blood flow from the maternal side and the fetal side, respectively. |
|
|
The total maternal placenta tissue volume and the total fetal placenta tissue volume, respectively. |
|
|
Represents total, unbound, extracellular space, intracellular space, and the plasma compartment in the tissue, respectively. |
Perfusion-limited placenta tissues
Figure 2-57 shows the redistribution of drug in perfusion-limited placenta. This redistribution is calculated instantaneously between the maternal placenta tissues and the fetal placenta tissues at any given time.
Figure 2-57: Perfusion-limited placenta tissues
Equation 2-59 (an equation set) defines the total mass balance in a perfusion- limited placenta tissue without clearance and considers only instantaneous distribution that is parameterized by Kp values.
Equation 2-59: Mass balance in perfusion-limited placenta tissue
Therefore, the total concentration in the placenta (maternal + fetal) can be calculated as shown in Equation 2-60.
Equation 2-60: Total concentration in the placenta (maternal + fetal)
Equation 2-61 shows the calculation for the tissue/plasma partition coefficient between the total placenta tissue (maternal + fetal) and the maternal plasma.
Equation 2-61: Partition coefficient for total placenta tissue and maternal plasma
By substituting Equation 2-60 and Equation 2-61 into Equation 2-59, the general equation (Equation 2-62) that describes the change in the amount of drug in the total perfusion-limited placenta tissue (maternal placenta + fetal tissue) is derived. In this equation, the clearance term is the combination of any intrinsic and enzymatic clearance in the placenta tissue and the transflux term represents the drug transport between the amniotic fluid and the fetal placenta through the intra-membranous osmosis pathways.
Equation 2-62: General equation that describes the change in the amount of drug in the total perfusion-limited placenta tissue (maternal placenta + fetal tissue)
where:
|
Variable |
Definition |
|
|
The concentration of unbound drug in the amniotic fluid. |
|
|
The total concentration of drug in the fetal side of the placenta. |
|
|
The tissue/plasma partition coefficient on the fetal side of the placenta. |
|
|
The fraction of unbound drug in the fetal tissue. |
As shown in Equation 2-63, (an equation set), the general equation for the change in the amount of drug in the total placenta can then be used to obtain the change in the amount of drug in the fetal placenta.
Equation 2-63: Change in the amount of drug in the fetal placenta
And, as shown in Equation 2-64, the general equation for the change in the amount of drug in the total placenta can also be used to obtain the initial equation for the change in the amount of drug in the maternal placenta.
Equation 2-64: Initial equation for the change in the amount of drug in maternal placenta
By substituting the fetal tissue placenta concentration (Equation 2-65) into Equation 2-64, the final equation (Equation 2-66) for the change in the amount of drug in the perfusion-limited maternal placenta is derived.
Equation 2-65: Fetal tissue placenta concentration
Equation 2-66: Final equation for the change in the amount of drug in the maternal placenta
Permeability-limited placenta tissue
If the placenta is modeled as permeability-limited tissue, then as shown in Figure 2-58, transplacental transfer is enabled, which represents the interchange between the maternal blood plasma in the intervillous space and fetal trophoblastic cells.
Figure 2-58: Permeability-limited placenta tissue
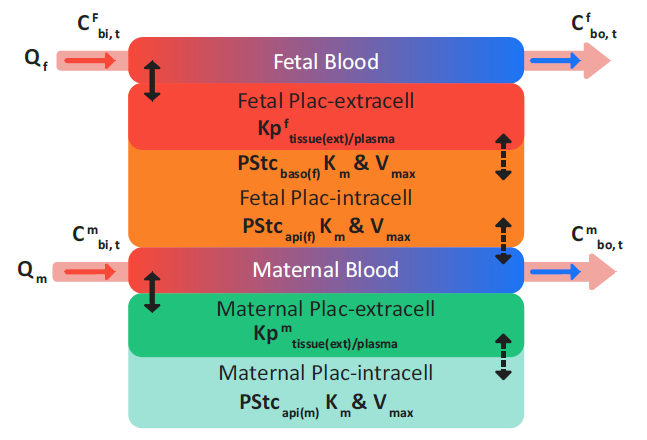
where:
|
Variable |
Definition |
|
|
The permeation between the fetal placenta tissue and the maternal vascular space. Note: The Papi calculation shown in Equation 2-67 and Equation 2-68 is for the same process: Permeation between the fetal placenta tissue and the maternal vascular space. |
|
|
The permeation between the tissue intracellular space and the extracellular space in fetal or maternal placenta tissue. |
|
|
The drug permeation between the amniotic fluid and the fetal placenta tissue as defined by the trans-membranous transport rate, ktransm. |
Equation 2-67: Permeability-limited fetal placenta calculations
Equation 2-68: Permeability-limited maternal placenta calculations
where:
|
Variable |
Definition |
|
|
The saturable clearance rate of drug calculated using Michaelis-Menten kinetics. |
|
|
The saturable, carrier-mediated transport rate of drug into the tissue using Michaelis-Menten kinetics. |
|
|
The saturable, carrier-mediated transport rate of drug out of the tissue using Michaelis-Menten kinetics. |
Enzyme phenotypes
The PEAR algorithms in GastroPlus® account for genetic variants of CYP2B6, 2C9, 2C19, and 2D6 enzymes in Caucasian and Asian subjects. The common genotypes of these CYP enzymes were assigned to poor metabolizer (PM), intermediate metabolizer (IM), extensive metabolizer (EM) or ultra-rapid metabolizer (UM) phenotypes in both populations.
Table 2-9: Enzyme Phenotypes and Genotypes for PEAR algorithms
|
Enzyme |
Phenotype |
Genotype |
|
2C9 |
EM |
*1/*1 |
|
IM |
*1/*2; *1/*3 |
|
|
PM |
*2/*2; *2/*3; *3/*3 |
|
|
2C19 |
UM |
*1/*17; *17/*17; |
|
EM |
*1/*1 |
|
|
IM |
*1/*2; *1/*3; *1/*5; *1/*8; *2/*17 |
|
|
PM |
*2/*2; *2/*3; *2/*5; *2/*6; *3/*3 |
|
|
2D6 |
UM |
Duplicate EM alleles |
|
EM |
*1; *2; *2A; *35 |
|
|
IM |
*9; *10; *17; *29; *41 |
|
|
PM |
*3; *4; *5; *6; *7; *8; *14; *36; *71 |
|
|
2B6 |
EM |
*1/*1; *1/*4; *1/*6 |
|
PM |
*5/*5; *5/*6; *6/*6 |
The default frequencies of different phenotypes in Caucasian and Asian (Chinese and Japanese) subjects that are included in GastroPlus® are based on extensive collection of physiological and genetic information from multiple literature resources128 129 130 131 132 133 134 135 136 137.
In GastroPlus®, the different phenotypes are assumed to be expressed through variations in the hepatic enzyme abundance. When creating a new PBPK model, the expression for different enzyme phenotypes with the suffix as “-UM,” “-EM,” “IM,” and “PM” are generated based on the selected population and other information (for example. gender, age, and health status) that you provide. A user can set the phenotype of any enzyme for a given subject by selecting an enzyme name with the correct phenotype suffix. Assuming that the percent of expression differences are the same for both liver and gut, the corresponding enzyme expression in gut is also adjusted based on the change in the hepatic abundance due to the phenotype difference.
1.Ogiu, N., Nakamura, Y., et al. (1997). “A statistical analysis of the internal organ weights of normal Japanese people.” Health Phys. 72(3): 368-83.
2.(CHNS, 2014) “China Health and Nutrition Survey”. http://www.cpc.unc.edu/projects/
china/
3.Hao, C., Li, W., et al. (1993). “The weight and volume of fetal viscera.” Chinese J. Anat.
16(1): 77-80.
4.Li, S. and Gao, H. (2006). “Table of organ weights for different age groups of Chinese.”
J. Guangxi Medical University 23(1): 155-156.
5.Li, S., Luo, D., et al. (1996). “Study on the organ weight of sudden death cases.” Chin.
J. Pathol. 25(2): 86-88.
6.Shu, Y., Cheng, Z., et al. (2001). “Interindividual variations in levels and activities of
cytochrome P-450 in liver microsomes of Chinese subjects.” Acta Pharmacol. Sin.
22(3): 283-288.
7.Wang, J. (1990). “Measurement of organ weight of 160 fetuses of Tujia nationality exi
autonomous prefecture.” Journal of Hubei Institute For Nationalities. 7(2): 1-4.
8.Wang, J. (1998). “Reference values of anatomical, physiological and metabolic
parameters for Chinese.” Atomic Energy Press: 7-58.
9.Wang, J., Li, B., et al. (1995). “Reference values of main internal organs for Chinese.”
Chinese J. Radiol. Med. Prot. 15(4): 248-254.
10.Wang, Q., Hu, P., et al. (1989). “An approach to the rules of fetal growth through
organometry.” Acta Acad. Med. Jiangxi 29(3): 19-25.
11.Yang, B., Wang, J., et al. (2015). “Recent advances in the quantification of drug
metabolizing enzymes and transporters by proteomic approach.” Acta Pharm. Sin.
50(6): 668-674.
12.Hosseini-Yeganeh, M. and McLachlan, A.J. (2002). “Physiologically based
pharmacokinetic model for terbinafine in rats and humans.” Antimicrob. Agents
Chemother. 46(7): 2219-28.
13.Brown, R.P., Delp, M.D., et al. (1997). “Physiological parameter values for
physiologically based pharmacokinetic models.” Toxicol. Ind. Health 13(4): 407-84.
14.Davies, B. and Morris, T. (1993). “Physiological parameters in laboratory animals and
humans.” Pharm. Res. 10(7): 1093-5.
15.Gong, J.K. (1965). “Effects of altitude acclimatization and de-acclimatization on bone
and marrow volume in dogs.” Am. J. Physiol. 209: 347-52.
16.Jurvelin, J., Lahtinen, T., et al. (1988). “Blood flow, histomorphology and elemental
composition of the canine femur after physical training or immobilization.” Acta
Physiol. Scand. 132(3): 385-9.
17.Paltiel, H.J., Diamond, D.A., et al. (2002). “Testicular volume: comparison of
orchidometer and US measurements in dogs.” Radiology 222(1): 114-9.
18.Ahn, J.M., Jung, H.K., et al. (2004). “Changes in the reproductive functions of mice
due to injection of a plasmid expressing an inhibin alpha-subunit into muscle: a
transient transgenic model.” Mol Cells 18(1): 79-86.
19.Cagen, S.Z., Waechter, J.M.J., et al. (1999). “Normal reproductive organ development
in CF-1 mice following prenatal exposure to bisphenol A.” Toxicol. Sci. 50(1): 36-44.
20.Kyselova, V., Peknicova, J., et al. (2003). “Effects of p-nonylphenol and resveratrol on
body and organ weight and in vivo fertility of outbred CD-1 mice.” Reprod. Biol.
Endocrinol. 1: 30.
21.Bercovitch, F.B. and Rodriguez, J.F. (1993). “Testis size, epididymis weight, and
sperm competition in rhesus macaques.” Am. J. Primatol. 30(2): 163-8.
22.Black, A., Tilmont, E.M., et al. (2001). “Accuracy and precision of dual-energy X-ray
absorptiometry for body composition measurements in rhesus monkeys.” J. Med.
Primatol. 30(2): 94-9.
23.Franklin, M.S., Kraemer, G.W., et al. (2000). “Gender differences in brain volume and
size of corpus callosum and amygdala of rhesus monkey measured from MRI
images.” Brain Res. 852(2): 263-7.
24.Alexander, N. and DeQuattro, V. (1974). “Gastrointestinal and mesenteric
hemodynamic patterns in neurogenic hypertensive rabbits.” Circ. Res. 35(4): 646-51.
25.Cenic, A., Nabavi, D.G., et al. (2000). “A CT method to measure hemodynamics in
brain tumors: validation and application of cerebral blood flow maps.” Am. J.
Neuroradiol. 21(3): 462-70.
26.Cumming, J.D. (1962). “A study of blood flow through bone marrow by a method of
venous effluent collection.” J. Physiol. 162: 13-20.
27.Cumming, J.D. and Nutt, M.E. (1962). “Bone-marrow blood flow and cardiac output in
the rabbit.” J. Physiol. 162: 30-4.
28.Hardman, M.J. and Hull, D. (1973). “Blood flow and fatty acid release by cervical
adipose tissue of rabbits.” J. Physiol. 235(1): 1-8.
29.Hudson, G. (1958). “Bone marrow volume in guinea-pigs.” J. Anat. 92(1): 150-61.
30.Horton, J., Ogden, M.E., et al. (1982). “The importance of splenic blood flow in clearing
pneumococcal organisms.” Ann. Surg. 195(2): 172-6.
31.Kairento, A.L., Brownell, G.L., et al. (1983). “Regional blood-flow measurement in
rabbit soft-tissue tumor with positron imaging using the C15O2 steady-state and
labeled microspheres.” J. Nucl. Med. 24(12): 1135-42.
32.Lewis, G.P. and Matthews, J. (1968). “The mobilization of free fatty acids from rabbit
adipose tissue in situ.” Br. J. Pharmacol. 34(3): 564-78.
33.Price, P.S., Conolly, R.B., et al. (2003). “Modeling interindividual variation in
physiological factors used in PBPK models of humans.” Crit. Rev. Toxicol. 33(5): 469-
503.
34.Haddad, S., Restieri, C., et al. (2001). “Characterization of age-related changes in body
weight and organ weights from birth to adolescence in humans.” J. Toxicol. Environ.
Health A 64(6): 453-64.
35.Snyder, W.S., Cook, M.J., et al. (1975). “Report of the Task Group on reference man
(ICRP Publication 23).” Elsevier Science Inc., pp.480.
36.Bertino, E., Coscia, A., et al. (2009). “Weight growth velocity of very low birth weight
infants: role of gender, gestational age and major morbidities.” Early Hum. Dev. 85(6):
339-47.
37.Chen, T.H. (1998). “A further discussion on fetal organ growth model.” Chinese J.
Med. Phys. 15(4): 217-220.
38.Cooke, R.J. and Griffin, I. (2009). “Altered body composition in preterm infants at
hospital discharge.” Acta. Paediatr. 98(8): 1269-73.
39.Enzi, G., Zanardo, V., et al. (1981). “Intrauterine growth and adipose tissue
development.” Am. J. Clin. Nutr. 34(9): 1785-90.
40.Gao, S.Y., Xiang, S.R., et al. (1990). “Evaluation of organ weights of 150 fetuses in
Jiangxi province.” Chinese J. Anat. 13(2): 148-153.
41.Hammarlund, K. and Sedin, G. (1979). “Transepidermal water loss in newborn infants.
III. Relation to gestational age.” Acta Paediatr. Scand. 68(6): 795-801.
42.Iob, V. and Swanson, W.W. (1934). “Mineral growth of the human fetus.” Am. J. Dis.
Child 47(2): 302-6.
43.Usher, R. and McLean, F. (1969). “Intrauterine growth of live-born Caucasian infants
at sea level: standards obtained from measurements in 7 dimensions of infants born
between 25 and 44 weeks of gestation.” J. Pediatr. 74(6): 901-10.
44.Zhang, Z.Y., Zhang, J.P., et al. (1994). “The analysis of liver weight, age and body
weight in 189 fetuses.” J. Jining Medical College 17(3): 45.
45.Kock, K.F., Lammert, O., et al. (1997). “Organ weights in healthy and apparently
healthy Danish infants.” Am. J. Hum. Biol. 9(1): 35-38.
46.Anderson, A.K. (2009). “Association between Infant Feeding and Early Postpartum
Infant Body Composition: A Pilot Prospective Study.” Int. J. Pediatr. 2009: 648091.
47.Deierlein, A.L., Thornton, J., et al. (2012). “An anthropometric model to estimate
neonatal fat mass using air displacement plethysmography.” Nutr. Metab. (Lond) 9:
21.
48.Fields, D.A., Gilchrist, J.M., et al. (2011). “Longitudinal body composition data in
exclusively breast-fed infants: a multicenter study.” Obesity 19(9): 1887-91.
49.Fomon, S.J., Haschke, F., et al. (1982). “Body composition of reference children from
birth to age 10 years.” Am. J. Clin. Nutr. 35(5 Suppl): 1169-75.
50.Gianni, M.L., Roggero, P.M., et al. (2012). “Post-natal catch-up fat after late preterm
birth.” Pediatr. Res. 72(6): 637-40.
51.Gianni, M.L., Roggero, P.M., et al. (2009). “Adiposity in small for gestational age
preterm infants assessed at term equivalent age.” Arch. Dis. Child Fetal Neonatal Ed.
94(5): F368-72.
52.Ramel, S.E., Gray, H.L., et al. (2011). “Body composition changes in preterm infants
following hospital discharge: comparison with term infants.” J. Pediatr. Gastroenterol.
Nutr. 53(3): 333-8.
53.Roggero, P.M., Gianni, M.L., et al. (2008). “Postnatal growth failure in preterm infants:
recovery of growth and body composition after term.” Early Hum. Dev. 84(8): 555-9.
54.Roggero, P.M., Gianni, M.L., et al. (2011). “Rapid recovery of fat mass in small for
gestational age preterm infants after term.” PLoS One 6(1): e14489.
55.Schmelzle, H.R. and Fusch, C. (2002). “Body fat in neonates and young infants:
validation of skinfold thickness versus dual-energy X-ray absorptiometry.” Am. J. Clin.
Nutr. 76(5): 1096-100.
56.Wells, J.C. (2000). “A Hattori chart analysis of body mass index in infants and
children.” Int. J. Obes. Relat. Metab. Disord. 24(3): 325-9.
57.Hudson, G. (1965). “Bone marrow volume in the human fetus and newborn." Br. J.
Haematol. 11: 446-52.
58.Trotter, M. and Peterson, R.R. (1970). “Weight of the skeleton during postnatal
development.” Am. J. Phys. Anthropol. 33(3): 313-23.
59.Valentine, J.A., Scott, J., et al. (1985). “A histological analysis of the early effects of
alcohol and tobacco usage on human lingual epithelium.” J. Oral Pathol. 14: 654-665.
60.Smith, G.C. and Cameron, A.D. (2002). “Estimating human fetal blood volume on the
basis of gestational age and fetal abdominal circumference.” BJOG 109(6): 721-2.
61.Yanowitz, T.D., Yao, A.C., et al. (1999). “Post-natal hemodynamic changes in very low
birth weight infants.” J. Appl. Physiol. 87(1): 370-80.
62.Alverson, D.C., Aldrich, M., et al. (1987). “Longitudinal trends in left ventricular cardiac
output in healthy infants in the first year of life.” J. Ultrasound. Med. 6(9): 519-24.
63.Coskun, S., Yüksel, H., et al. (2001). “Non-invasive evaluation of the adaptations of
cardiac function in the neonatal period: a comparison of healthy infants delivered by
vaginal route and cesarean section.” Acta. Med. Okayama. 55(4): 213-8.
64.Seppänen, M.P., Kääpä, P.O., et al. (1994). “Doppler-derived systolic pulmonary artery
pressure in acute neonatal respiratory distress syndrome.” Pediatrics 93(5): 769-73.
65.Walther, F.J., Siassi, B., et al. (1985). “Pulsed Doppler determinations of cardiac
output in neonates: normal standards for clinical use.” Pediatrics 76(5): 829-33.
66.Winberg, P. and Lundell, B.P. (1990). “Left ventricular stroke volume and output in
healthy term infants.” Am. J. Perinatol. 7(3): 223-6.
67.McNamara, P.J. and Alcorn, J. (2002). “Protein binding predictions in infants.” AAPS
Pharm. Sci. 4(1): E4.
68.Cartlidge, P.H. and Rutter, N. (1986). “Serum albumin concentrations and oedema in
the newborn.” Arch. Dis. Child 61(7): 657-60.
69.Colón, A.R. (1990). “Textbook of Pediatric Hepatology.” Year Book Medical Publishers,
Inc., pp.353.
70.Darrow, D.C. and Cary, M.K. (1933). “The serum albumin and globulin of newborn,
premature and normal infants.” J. Pediatr. 3: 573-9.
71.Ehrnebo, M., Aqurell, S., et al. (1971). “Age differences in drug binding by plasma
proteins: studies on human foetuses, neonates and adults.” Eur. J. Clin. Pharmacol.
3(4): 189-93.
72.Kanakoudi, F., Drossou, V., et al. (1995). “Serum concentrations of 10 acute-phase
proteins in healthy term and preterm infants from birth to age 6 months.” Clin. Chem.
41(4): 605-8.
73.Lerman, J., Strong, H.A., et al. (1989). “Effects of age on the serum concentration of
alpha 1-acid glycoprotein and the binding of lidocaine in pediatric patients.” Clin.
Pharmacol. Ther. 46(2): 219-25.
74.Philip, A.G. and Hewitt, J.R. (1983). “Alpha 1-acid glycoprotein in the neonate with and
without infection.” Biol. Neonate. 43(3-4): 118-24.
75.Rane, A., Lunde, P.K., et al. (1971). “Plasma protein binding of diphenylhydantoin in
normal and hyperbilirubinemic infants.” J. Pediatr. 78(5): 877-82.
76.Reading, R.F., Ellis, R., et al. (1990). “Plasma albumin and total protein in preterm
babies from birth to eight weeks.” Early Hum. Dev. 22(2): 81-7.
77.Jopling, J., Henry, E., et al. (2009). “Reference ranges for hematocrit and blood
hemoglobin concentration during the neonatal period: data from a multi-hospital
health care system.” Pediatrics 123(2): e333-7.
78.Rubin, M.I., Bruck, E., et al. (1949). “Maturation of renal function in childhood;
clearance studies.” J. Clin. Invest. 28(5 Pt 2): 1144-62.
79.White, D.R., Widdowson, E.M., et al. (1991). “The composition of body tissues (II).
Fetus to young adult.” Br. J. Radiol. 64(758): 149-59.
80.Brans, Y.W. and Shannon, D.L. (1981). “Chemical changes in human skeletal muscle
during fetal development.” Biol. Neonate 40(1-2): 21-8.
81.Goodsitt, M.M., Hoover, P., et al. (1994). “The composition of bone marrow for a dualenergy
quantitative computed tomography technique. A cadaver and computer
simulation study.” Invest. Radiol. 29(7): 695-704.
82.Graham, J.A. and Scobie, W.G. (1970). “Muscle biopsy measurement of body water
and intracellular electrolytes in children.” Arch. Dis. Child 45(242): 473-7.
83.Butte, N.F., Hopkinson, J.M., et al. (2000). “Body composition during the first 2 years
of life: an updated reference.” Pediatr. Res. 47(5): 578-85.
84.Flexner, L.B. and Wilde, W.S. (1947). “The estimation of extracellular and total body
water in the newborn human infant with radioactive sodium and deuterium oxide.” J.
Pediatr. 30(4): 413-5.
85.Friis-Hansen, B. (1983). “Water distribution in the fetus and newborn infant.” Acta
Paediatr. Scand. Suppl. 305: 7-11.
86.Arant, B.S.J. (1978). “Developmental patterns of renal functional maturation
compared in the human neonate.” J. Pediatr. 92(5): 705-12.
87.Coulthard, M.G. (1985). “Maturation of glomerular filtration in preterm and mature
babies.” Early Hum. Dev. 11(3-4): 281-92.
88.DeWoskin, R.S. and Thompson, C.M. (2008). “Renal clearance parameters for PBPK
model analysis of early lifestage differences in the disposition of environmental
toxicants.” Regul. Toxicol. Pharmacol. 51(1): 66-86.
89.Fawer, C.L., Torrado, A., et al. (1979). “Maturation of renal function in full-term and
premature neonates.” Helv. Paediatr. Acta 34(1): 11-21.
90.Bird, N.J., Henderson, B.L., et al. (2003). “Indexing glomerular filtration rate to suit
children.” J. Nucl. Med. 44(7): 1037-43.
91.Kearns, G.L., Abdel-Rahman, S.M., et al. (2003). “Developmental pharmacology-Drug
disposition, action, and therapy in infants and children.” N. Engl. J. Med. 349(12):
1157-67.
92.Peters, A.M., Gordon, I., et al. (1994). “Normalization of glomerular filtration rate in
children: body surface area, body weight or extracellular fluid volume?” J. Nucl. Med.
35(3): 438-44.
93.Stevens, L.A. and Levey, A.S. (2007). “Frequently asked questions about GFR
estimates.” National Kidney Foundation, pp.17.
245.Johnson, T.N., Boussery, K., et al. (2010). “A semi-mechanistic model to predict the
effects of liver cirrhosis on drug clearance.” Clin. Pharmacokinet. 49(3): 189-206.
94.Aparicio, M., Chauveau, P., et al. (2000). “Nutrition and outcome on renal replacement
therapy of patients with chronic renal failure treated by a supplemented very low
protein diet.” J. Am. Soc. Nephrol. 11(4): 708-716.
95.Guz, G., Bali, M., et al. (2004). “Gastric emptying in patients on renal replacement
therapy.” Ren. Fail. 26(6): 619-624.
96.Hsu, C.Y., Bates, D.W., et al. (2001). “Relationship between hematocrit and renal
function in men and women.” Kidney Int. 59(2): 725-731.
97.Rowland Yeo, K., Aarabi, M., et al. (2011). “Modeling and predicting drug
pharmacokinetics in patients with renal impairment.” Expert Rev, Clin, Pharmacol,
4(2): 261-274.
98.Stenvinkel, P., Heimbürger, O., et al. (1999). “Strong association between malnutrition,
inflammation, and atherosclerosis in chronic renal failure.” Kidney Int. 55(5): 1899-
1911.
99.Van Vlem, B., Schoonjans, R., et al. (2000). “Delayed gastric emptying in dyspeptic
chronic hemodialysis patients.” Am. J. Kidney Dis. 36(5): 962-968.
100.Yoshida, K., Sun, B., et al. (2016). “Systematic and quantitative assessment of the
effect of chronic kidney disease on CYP2D6 and CYP3A4/5.” Clin. Pharmacol. Ther.
100(1): 75-87.
101.World Health Organization. (2000). “Obesity: Preventing and Managing the Global
Epidemic.” World Health Organ. Tech. Rep. Ser. (2000). 894(i-xii): 1-253. PMID:
11234459.
102.Anastasio, P., Spitali, L., et al. (2000). “Glomerular filtration rate in severely overweight
normotensive humans.” Am. J. Kidney Dis. 35(6): 1144-1148.
103.Benedek, I.H., Blouin, R.A., et al. (1984). “Serum protein binding and the role of
increased alpha 1-acid glycoprotein in moderately obese male subjects.” Br. J. Clin.
Pharmacol. 18(6): 941-946.
104.Benedek, I.H., Fiske, W.D.r., et al. (1983). “Serum alpha 1-acid glycoprotein and the
binding of drugs in obesity.” Br. J. Clin. Pharmacol. 16(6): 751-754.
105.Brill, M.J., Diepstraten, J., et al. (2012). “Impact of obesity on drug metabolism and
elimination in adults and children.” Clin. Pharmacokinet. 51(5): 277-304.
106.Chagnac, A., Weinstein, T., et al. (2003). “The effects of weight loss on renal function
in patients with severe obesity.” J. Am. Soc. Nephrol. 14(6): 1480-1486.
107.Chagnac, A., Weinstein, T., et al. (2000). “Glomerular hemodynamics in severe
obesity.” Am. J. Physiol. Renal Physiol. 278(5): F817-22.
108.Collis, T., Devereux, R.B., et al. (2001). “Relations of stroke volume and cardiac output to body composition: the strong heart study.” Circulation 103(6): 820-825.
109.Dadson, P., Ferrannini, E., et al. (2017). “Fatty acid uptake and blood flow in adipose
tissue compartments of morbidly obese subjects with or without type 2 diabetes:
effects of bariatric surgery.” Am. J. Physiol. Endocrinol. Metab. 313(2): E175-E182.
110.Ghobadi, C., Johnson, T.N., et al. (2011). “Application of a systems approach to the
bottom-up assessment of pharmacokinetics in obese patients: expected variations in
clearance.” Clin. Pharmacokinet. 50(12): 809-822.
111.Lesser, G.T. and Deutsch, S. (1967). “Measurement of adipose tissue blood flow and
perfusion in man by uptake of 85Kr.” J. Appl. Physiol. 23(5): 621-630.
112.Pai, M.P. (2010). “Estimating the glomerular filtration rate in obese adult patients for
drug dosing.” Adv Chronic Kidney Dis 17(5): e53-62.
113.Tabur, S., Oztuzcu, S., et al. (2016). “CYP gene expressions in obesity-associated
metabolic syndrome.” Obes. Res. Clin. Pract. 10(6): 719-723.
114.Weis, J., Johansson, L., et al. (2007). “Quantification of intramyocellular lipids in
obese subjects using spectroscopic imaging with high spatial resolution.” Magn.
Reson. Med. 57(1): 22-28.
115.Young, J.F., Luecke, R.H., et al. (2009). “Human organ/tissue growth algorithms that
include obese individuals and black/white population organ weight similarities from
autopsy data.” J. Toxicol. Environ. Health A. 72(8): 527-540.
116.de Divitiis, O., Fazio, S., et al. (1981). “Obesity and cardiac function.” Circulation 64(3):
477-482.
117.Abduljalil, K., Furness, P., et al. (2012). “Anatomical, physiological and metabolic
changes with gestational age during normal pregnancy: a database for parameters
required in physiologically based pharmacokinetic modeling.” Clin. Pharmacokinet.
51(6): 365-96.
118.Abduljalil, K., Johnson, T.N., et al. (2018). “Fetal Physiologically-Based
Pharmacokinetic Models: Systems Information on Fetal Biometry and Gross
Composition.” Clin. Pharmacokinet. 57(9): 1149-1171.
119.Dallmann, A., Ince, I., et al. (2018). “A Physiologically Based Pharmacokinetic Model
for Pregnant Women to Predict the Pharmacokinetics of Drugs Metabolized Via
Several Enzymatic Pathways.” Clin. Pharmacokinet. 57(6): 749-768.
120.Dallmann, A., Ince, I., et al. (2017). “Gestation-Specific Changes in the Anatomy and
Physiology of Healthy Pregnant Women: An Extended Repository of Model
Parameters for Physiologically Based Pharmacokinetic Modeling in Pregnancy.” Clin.
Pharmacokinet. 56(11): 1303-1330.
121.De Sousa Mendes, M., Lui, G., et al. (2017). “A Physiologically-Based Pharmacokinetic
Model to Predict Human Fetal Exposure for a Drug Metabolized by Several CYP450
Pathways.” Clin. Pharmacokinet. 56(5): 537-550.
122.Zhang, Z., Imperial, M.Z., et al. (2017). “Development of a Novel Maternal-Fetal
Physiologically Based Pharmacokinetic Model I: Insights into Factors that Determine
Fetal Drug Exposure through Simulations and Sensitivity Analyses.” Drug Metab.
Dispos. 45(8): 920-938.
123.Carmichael, S., Abrams, B., et al. (1997). “The pattern of maternal weight gain in
women with good pregnancy outcomes.” Am. J. Public Health 87(12): 1984-8.
124.Rasmussen, K.M., Yaktine, A.L., et al. (2009). “The National Academies Collection:
Reports funded by National Institutes of Health. In “Weight Gain During Pregnancy:
Reexamining the Guidelines”. National Academies Press (US). National Academy of
Sciences., Washington (DC).
125.Szeto, Ke Xu, Maxime Le Merdy, Benjamin DuPont, Michael B. Bolger, and Viera
Lukacova. (2021). “PBPK Modeling Approach to Predict the Behavior of Drugs Cleared
by Kidney in Pregnant Subjects and Fetus.” The AAPS Journal. 23:89.
126.Brace, R.A., Anderson, D.F., et al. (2014). “Regulation of amniotic fluid volume:
mathematical model based on intramembranous transport mechanisms.” Am. J.
Physiol. Regul. Integr. Comp. Physiol. 307(10): R1260-73.
127.Underwood, M.A., Gilbert, W.M., et al. (2005). “Amniotic fluid: not just fetal urine
anymore.” J. Perinatol. 25(5): 341-8.
128.Chen, K., Wang, R., et al. (2005). “Relationship of P450 2C9 genetic polymorphisms in
Chinese and the pharmacokinetics of tolbutamide.” J. Clin. Pharm. Ther. 30(3): 241-9.
129.Dorado, P., Heras, N., et al. (2012). “CYP2D6 genotype and dextromethorphan
hydroxylation phenotype in an Ecuadorian population.” Eur. J. Clin. Pharmacol. 68(5):
637-44.
130.Gawronska-Szklarz, B., Adamiak-Giera, U., et al. (2012). “CYP2C19 polymorphism
affects single-dose pharmacokinetics of oral pantoprazole in healthy volunteers.” Eur.
J. Clin. Pharmacol. 68(9): 1267-74.
131.Goh, L.L., Lim, C.W., et al. (2017). “Analysis of Genetic Variation in CYP450 Genes for
Clinical Implementation.” PLoS One 12(1): e0169233.
132.Guan, S., Huang, M., et al. (2006). “Genetic polymorphisms of cytochrome P450 2B6
gene in Han Chinese.” Eur. J. Pharm. Sci. 29(1): 14-21.
133.Hillman, M.A., Wilke, R.A., et al. (2004). “Relative impact of covariates in prescribing
warfarin according to CYP2C9 genotype.” Pharmacogenetics 14(8): 539-47.
134.Scordo, M.G., Aklillu, E., et al. (2001). “Genetic polymorphism of cytochrome P450
2C9 in a Caucasian and a black African population.” Br. J. Clin. Pharmacol. 52(4): 447-
50.
135.Wang, S.M., Zhu, A.P., et al. (2009). “Frequencies of genotypes and alleles of the
functional SNPs in CYP2C19 and CYP2E1 in mainland Chinese Kazakh, Uygur and
Han populations.” J. Hum. Genet.54(6): 372-5.
136.Zackrisson, A.L., Holmgren, P., et al. (2004). “Fatal intoxication cases: cytochrome
P450 2D6 and 2C19 genotype distributions.” Eur. J. Clin. Pharmacol. 60(8): 547-52.
137.Zhou, Q., Yu, X.M., et al. (2009). “Genetic polymorphism, linkage disequilibrium,
haplotype structure and novel allele analysis of CYP2C19 and CYP2D6 in Han
Chinese.” Pharmacogenomics J. 9(6): 380-94.