
When the concentration of the dissolved drug exceeds the solubility in a given compartment, the drug might precipitate and return to undissolved drug. Two model types are available in GastroPlus® for modeling precipitation: First Order Precipitation and Mechanistic (Classic Nucleation Theory). Both models have two variations available. The First Order Precipitation model has the option of a single precipitation time or multiple precipitation times. The Mechanistic model has the option of using either the Lindfors derivation of Classic Nucleation Theory (CLNT), or the Fraczkiewicz-Model V2. See:
First Order Precipitation Model - Single Precipitation Time
GastroPlus® has a model, the First Order Precipitation model, for first order precipitation in the lumen of the GI tract1. This model considers all aspects of the pH and bile salt dependence of solubility. In this model, the rate coefficient in the equations for the mass of drug that is precipitated is based on a user-selected precipitation time and is invoked when the local concentration of a drug in any given compartment exceeds the solubility in the compartment.
Equation 1-36: First Order Precipitation model equation to predict precipitation rate in the jth intestinal compartment
where:
|
Variable |
Definition |
|
|
The volume of the lumen in the jth intestinal compartment. |
|
|
The precipitation rate constant in the jth intestinal compartment. |
|
|
The precipitation time in the jth intestinal compartment. Note: You can define compartment-specific precipitation times through a precipitation time versus pH profile. |
|
|
The concentration of dissolved drug in the jth intestinal compartment. |
|
|
The drug solubility in the jth intestinal compartment. |
Simulations Plus’s ability to parameterize the value of the precipitation time has kept pace with developments in this field. Data from the transfer assay introduced by Kostewicz and Dressman in 20042 allowed us to derive a default value for precipitation time under fasted conditions that has proven to be useful in explaining and predicting the in vivo behavior of many known drugs and potential drug candidates3 4 5 6 7 8 9 10 11 12 13 14 15 16 17 18.
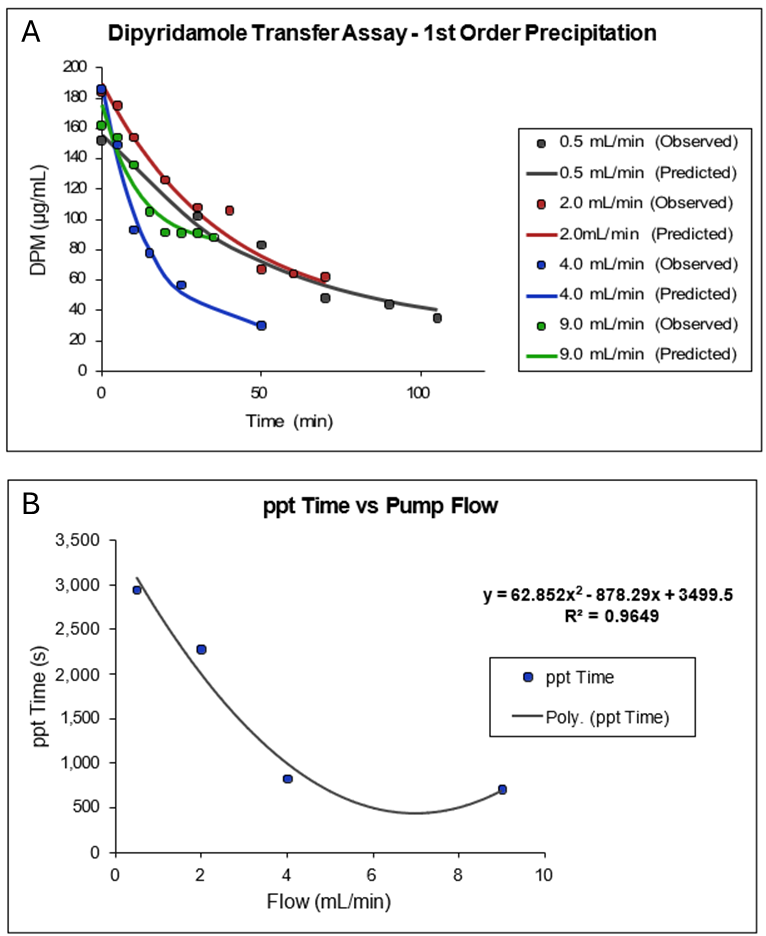
In Figure 1-4, Plot A shows a plot of a portion of the data collected by Kostewicz 1 from their transfer assay using dipyridamole dissolved in 125 mL of fasted state simulated gastric fluid (SGFfast) containing 34.2 mM NaCl in 0.01 M HCl at pH 2.1, followed by transfer into 500 mL of FaSSIF. The exponential decline in dipyridamole concentration as a function of time from the peak concentration was fitted to a single exponential. Plot B is a plot of the reciprocal of the fitted 1st order rate constants as a function of the rate of transfer (flow) of the SGFfast solution into the FaSSIF media. As the plot shows, the precipitation time (ppt time) decreases as the transfer rate increases and reaches a minimum of approximately 700 s at a transfer rate of 9 mL/min.
If we assume the average gastric emptying time is approximately 4 mL/min, then we arrive at the default value of 900 s for the fasted state precipitation time.
Figure 1-4: Default value for precipitation time in GastroPlus® (Obtained by analysis of published dipyridamole in vitro precipitation data) 1
First Order Precipitation Model - Multiple Precipitation Times
For a more complex treatment of drug precipitation with the first-order precipitation model, GastroPlus® incorporates an option to specify user-defined precipitation times as a function of compartmental pH. If the precipitation rate is truly dependent on the pH of the media, then this support file can be used to account for differences in precipitation rates. This option can also be used to account for the effects of excipients on precipitation of the active pharmaceutical ingredient (API).
A strong effect of excipients to maintain a certain degree of supersaturation after dosing the salt of a weak acid, amorphous, or a solid dispersion is expected in the stomach and upper small intestine. In lower intestinal regions, as the intestinal fluid dilutes the excipients, their effect on the dissolution and precipitation behavior of API might be reduced. With the option to set multiple precipitation times, you can now simulate this scenario by setting longer precipitation times for pH values that represent the stomach and upper small intestine compartments and shorter precipitation times for pH values that represent the lower small intestine or colon.
Mechanistic Precipitation Model - The Lindfors Derivation
GastroPlus® can model precipitation rates from a mechanistic perspective. This approach allows for the incorporation of basic theoretical equations to explain and predict the in vivo performance of any molecule using parameters that can be obtained from in vitro or in silico methods. This mechanistic model uses the fundamental principles of solution thermodynamics, with special focus on the kinetics behind nucleation and growth. In general, the process of precipitation involves the formation of a new (solid) phase within a given bulk (liquid) phase. This process, in the absence of participating foreign (solid) particles, usually involves the formation of a small cluster of molecules, followed by its growth to the point of becoming recognizable crystallites, which can grow significantly in size through diffusional (Ostwald ripening) or mechanical (coalescence) processes. In reality, in a pure solution, molecules are in a constant state of collision with each other, forming clusters and then breaking apart. This process continues to keep the molecules in solution, until the free energy needed to keep them in solution becomes greater than the free energy required to form a cluster. This difference in free energy determines the rate of formation of new clusters, known as nuclei. The net rate of precipitation is a combination of the formation of new nuclei and the growth in size of already formed clusters of nuclei.
The application of a mechanistic precipitation model within computational oral absorption simulation (COAS) was previously presented by Sugano19 20. Among others, Sugano referred to the work of Lindfors in his derivation of the equations for homogeneous precipitation using CLNT21. Equation 1-37 and Equation 1-38 represent the differential equations for nucleation and growth, respectively, and are taken directly from Sugano’s publication.
Equation 1-37: Sugano’s CLNT model - Differential equation for nucleation
where:
|
Variable |
Definition |
|
|
A fitted lump constant of various factors as shown in Equation 1-38. |
|
|
The diffusion coefficient of a free monomer drug. |
|
|
Avogadro’s number. |
|
|
The concentration of a free monomer drug in aqueous solution and not in bile micelles. |
|
|
The solubility of the precipitant in water without bile micelles. |
|
|
The interfacial surface tension. |
|
|
The Boltzman constant. |
|
|
The temperature. |
|
|
The molecular volume. |
Equation 1-38: Sugano’s CLNT model - Particle radius calculation and fitted lump sum of various factors for the calculation of β
where:
|
Variable |
Definition |
|
|
The amount of particle growth (weight or mole) that is generated during a time period, with i representing a particle group that is generated at a different time point. |
|
|
The particle radius at time t. |
|
|
The density of the drug. |
|
|
The effective diffusion coefficient in a bile micelle media. |
|
|
The diffusion layer thickness. |
|
|
The sum of the concentrations of free monomer and the bile micelle-bound molecule. |
|
|
The solubility in the bile micelle media. |
Sugano used these equations, with fitted parameters for β and γ, to qualitatively describe the data published by Kostewicz for dipyridamole at four different transfer flow rates. The value of β was determined to be 1 x 10-18 and the value of the interfacial surface tension, γ, was 0.003 N/m (or J/m2).
Our analysis of Sugano’s work revealed a possible flaw in his derivation of the CLNT equations and might partly explain why the fitted value of β in his work is such a small value. According to Fick’s law, in an ideal situation, the concentration of drug that is immediately adjacent to the cluster is equal to the solubility and the diffusive flow of monomers from the cluster surface to the bulk controls the rate of association/ dissociation and vice versa. Lindfors, however, pointed out that the transfer of monomers to the surface might not be limited by diffusion only, but by some kind of surface integration process. He defined a term, λ, which represents the ratio of the diffusion coefficient over a surface integration factor. We derived the CLNT equations directly from Lindfors’s publication and arrived at Equation 1-39.
Equation 1-39: Simulation Plus’s CLNT model
where:
|
Variable |
Definition |
|
|
Assuming spherical geometry, the critical radius of the growing cluster. See Equation 1-40. |
|
|
The crystallization parameter, which is a correction factor to account for surface integration processes. |
|
Note: All other variables have been defined previously. See Equation 1-37 and Equation 1-38. |
|
Equation 1-38 and Equation 1-39 are quite similar except for two terms. Lindfors's original equation does not include the parameter β that Sugano describes as “a lump constant of various factors such as the number of the foreign particles for heterogeneous nucleation and the attachment probability of a molecule onto a cluster.” Equation 1-39 does, however, include a surface integration factor with sensitivity to the critical radius of the growing cluster of monomer drug molecules. The lower limit of cluster size depends on the “critical radius,” which Equation 1-40 describes.
Equation 1-40: Critical radius calculation for use in Equation 1-39
The upper limit for r* depends on three factors:
-
The stability of the growing crystal or amorphous form
-
The degree of supersaturation achieved (Caq/Saq)
-
The hydrodynamic environment of the precipitating system.
In one of the publications, Sugano incorporated the λ term from Lindfors's equations, but still retained a squared term for Avogadro's number22.
Equation 1-41 is the final equation that is used to account for the formation rate of new nuclei (new precipitated particles). Equation 1-41 is based on Equation 1-39, but with an additional empirical parameter that you can optimize – the exponential correction factor (ECF). The critical radius is calculated according to Equation 1-40, and then the contribution of growth of already existing nuclei to the overall precipitation rate is calculated according to Equation 1-39.
Equation 1-41: Formation rate of new nuclei with the optimizable ECF
Mechanistic Precipitation Model - Fraczkiewicz-Model V2
Upon closer examination, we determined that there were some minor errors also in the Lindfors derivation of CLNT equations. Therefore, in GastroPlus® we offer a second option, Fraczkiewicz-Model V2, for the mechanistic precipitation model. This model includes two main corrections to the nucleation rate equations that arose from (1) an omission of the concentration gradient in the term that is used to compute the frequency of molecules approaching a cluster, and (2) the misinterpretation of concentration in the nucleation equations. The lumen concentration was used instead of the concentration of monomers. This resulted in a corrected nucleation equation as shown in Equation 1-42.
Equation 1-42: Fraczkiewicz-Model V2 equation
In the corrected Lindfors equation, h is the diffusion layer thickness and does not necessarily need to be the critical radius. In the Fraczkiewicz-Model V2, λ +h are optimized together as one parameter called the effective diffusion layer thickness. Additionally, the exponential correction factor is removed. Also in the Fraczkiewicz-Model V2, the interfacial surface tension, γ, is optimized to adjust the nucleation rate instead of the exponential correction factor. Avogadro's number is added in the exponential term to correct for the number of nuclei versus volumetric concentration. The same growth equation is used as with the Lindfors model version.
1.Agoram, B., Woltosz, W.S., et al. (2001). “Predicting the impact of physiological and biochemical processes on oral drug bioavailability.” Adv. Drug Deliv. Rev. 50(Suppl 1): S41-S67.
2.Kostewicz, E.S., Wunderlich, M., et al. (2004). “Predicting the precipitation of poorly soluble weak bases upon entry in the small intestine.” J. Pharm. Pharmacol. 56(1): 43- 51.
3.Dannenfelser, R.M., He, H., et al. (2004). “Development of clinical dosage forms for a poorly water soluble drug I: Application of polyethylene glycol-polysorbate 80 solid dispersion carrier system.” J. Pharm. Sci. 93(5): 1165-75.
4.De Buck, S.S., Sinha, V.K., et al. (2007). “The prediction of drug metabolism, tissue distribution, and bioavailability of 50 structurally diverse compounds in rat using mechanism-based absorption, distribution, and metabolism prediction tools.” Drug Metab. Dispos. 35(4): 649-59.
5.De Buck, S.S., Sinha, V.K., et al. (2007). “Prediction of human pharmacokinetics using physiologically based modeling: a retrospective analysis of 26 clinically tested drugs.” Drug Metab. Dispos. 35(10): 1766-80.
6.Gao, Y., Carr, R.A., et al. (2010). “A pH-dilution method for estimation of biorelevant drug solubility along the gastrointestinal tract: application to physiologically based pharmacokinetic modeling.” Mol. Pharm. 7(5): 1516-26.
7.Heimbach, T., Lakshminarayana, S.B., et al. (2009). “Practical anticipation of human efficacious doses and pharmacokinetics using in vitro and preclinical in vivo data.” AAPS J. 11(3): 602-14.
8.Jones, H.M., Gardner, I.B., et al. (2011). “Simulation of human intravenous and oral pharmacokinetics of 21 diverse compounds using physiologically based pharmacokinetic modelling.” Clin. Pharmacokinet. 50(5): 331-47.
9.Jones, H.M., Parrott, N., et al. (2006). “Predicting pharmacokinetic food effects using biorelevant solubility media and physiologically based modelling.” Clin. Pharmacokinet. 45(12): 1213-26.
10.Kovacevic, I., Parojcic, J., et al. (2009). “Justification of biowaiver for carbamazepine, a low soluble high permeable compound, in solid dosage forms based on IVIVC and gastrointestinal simulation.” Mol. Pharm. 6(1): 40-7.
11.Kuentz, M., Nick, S., et al. (2006). “A strategy for preclinical formulation development using GastroPlus as pharmacokinetic simulation tool and a statistical screening design applied to a dog study.” Eur. J. Pharm. Sci. 27(1): 91-9.
12.Lukacova, V., Woltosz, W.S., et al. (2009). “Prediction of modified release pharmacokinetics and pharmacodynamics from in vitro, immediate release, and intravenous data.” AAPS J. 11(2): 323-34.
13.Okumu, A., DiMaso, M., et al. (2009). “Computer simulations using GastroPlus to justify a biowaiver for etoricoxib solid oral drug products.” Eur. J. Pharm. Biopharm. 72(1): 91-8.
14.Parrott, N., Lukacova, V., et al. (2009). “Predicting pharmacokinetics of drugs using physiologically based modeling--application to food effects.” AAPS J. 11(1): 45-53.
15.Sperry, D.C., Thomas, S.J., et al. (2010). “Dissolution modeling of bead formulations and predictions of bioequivalence for a highly soluble, highly permeable drug.” Mol. Pharm. 7(5): 1450-7.
16.Tubic-Grozdanis, M., Bolger, M.B., et al. (2008). “Application of gastrointestinal simulation for extensions for biowaivers of highly permeable compounds.” AAPS J. 10(1): 213-26.
17.Watson, K.J., Davis, J., et al. (2011). “Application of physiologically based pharmacokinetic modeling to understanding the clinical pharmacokinetics of UK- 369,003.” Drug Metab. Dispos. 39(7): 1203-13.
18.Wei, H. and Löbenberg, R. (2006). “Biorelevant dissolution media as a predictive tool for glyburide a class II drug.” Eur. J. Pharm. Sci 29(1): 45-52.
19.Sugano, K. (2009). “Computational oral absorption simulation for low-solubility compounds.” Chem. Biodivers. 6(11): 2014-29.
20.Sugano, K. (2009). “Introduction to computational oral absorption simulation.” Expert Opin. Drug Metab. Toxicol. 5(3): 259-93.
21.Lindfors, L., Forssén, S., et al. (2008). “Nucleation and crystal growth in supersaturated solutions of a model drug.” J. Colloid. Interface. Sci. 325(2): 404-13.
22.Sugano, K. (2009). “A simulation of oral absorption using classical nucleation theory.” Int. J. Pharm. 378(1-2): 142-5.