
Several topics in this section detail equations that reference specific publications by Simulations Plus. Therefore, to maintain consistency between the information presented here and the referenced publications, these equations have not been edited to adhere to Simulations Plus’s internal documentation standards for GastroPlus®.
The steady-state calculations, which are applicable to metabolic DDI only, automatically incorporate the contribution of gut and liver metabolism to the overall change in exposure of the victim drug (substrate). Equation 4-1 represents a combination of steady-state equations that were previously published for competitive inhibition1 2, time-dependent inhibition3 4, and induction5 6 7. In Equation 4-1, the first term represents the contribution of the gut to DDI and the second term represents the contribution of the liver to DDI.
For clarity in Equation 4-1, the effect of only one inhibitor/inducer is shown; however, with the use of simulated concentrations, you can include the effects of a parent compound, and if applicable, the effects of its metabolites as long as you specify their constants.
Equation 4-1: Steady-state calculations applicable to metabolic DDI
where:
|
Variable |
Definition |
|
|
The measure of the total exposure of the drug to the body with oral dosage when co-dosed with an inhibitor/inducer. |
|
|
The measure of the total exposure of the drug to the body with oral dosage. |
|
|
The fraction of the drug that bypasses gut metabolism. |
|
|
The contributions of individual enzymes (E) to the victim drug’s gut and liver (or systemic) clearance, respectively. |
|
|
The fraction of the victim drug’s gut and liver (or systemic) clearance due to mechanisms not affected by a perpetrator, respectively. |
|
|
The effective perpetrator gut concentration and the effective perpetrator liver (or systemic) concentration, respectively. |
|
|
The reversible (competitive) inhibition constant, the irreversible inhibition constant, and the induction constant, respectively, of a perpetrator against individual enzymes that are involved in the victim’s gut metabolism, liver metabolism, or both. |
|
|
The inactivation constant and the maximum induction potential, respectively, of a perpetrator against individual enzymes that are involved in the victim’s gut metabolism, liver metabolism, or both. |
|
|
The turnover rate of individual enzymes, with different turnover rates specified for the gut and liver, respectively. |
Steady state perpetrator concentration calculations
Several different calculated and simulated inhibitor/inducer concentration estimates are available in the DDI module. A full PK model is required for the simulated inhibitor/inducer concentration estimates.
Calculated perpetrator concentrations
Calculated perpetrator concentrations—systemic average, systemic Cmin, systemic Cmax, liver inlet, liver inlet Cmax, gut, and all corresponding unbound concentrations—are obtained from standard equations8, where [I] can be either an inducer or an inhibitor.
Equation 4-2: Calculated systemic average
Equation 4-3: Calculated systemic Cmin
Equation 4-4: Calculated systemic Cmax
Equation 4-5: Calculated liver inlet
Equation 4-6: Calculated liver inlet Cmax
Equation 4-7: Calculated gut
Equation 4-8: Calculated corresponding unbound concentrations
where:
|
Variable |
Definition |
|
|
The dose of the drug. |
|
|
The dosing interval. |
|
|
The clearance rate of the drug dose. |
|
|
The elimination rate constant. |
|
|
The absorption rate constant. |
|
|
The fraction of the dose that is absorbed. |
|
|
The fraction of the dose that was absorbed in the portal vein. |
|
|
The bioavailability of the drug dose. |
|
|
The liver blood flow rate. |
|
|
The enterocytic blood flow rate. |
|
|
The percent of drug unbound in plasma. |
Simulated perpetrator concentrations
Perpetrator concentrations are obtained from simulated profiles for the perpetrator using full absorption and PK models.
-
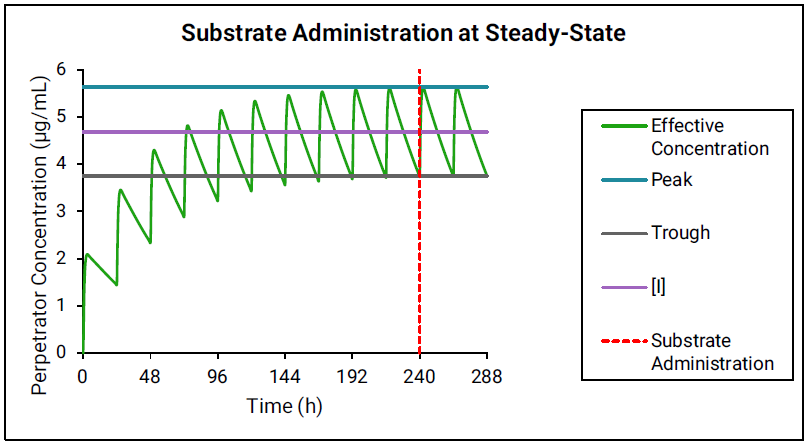
If the perpetrator reaches steady state before substrate administration, then as shown in Figure 4-1, the effective perpetrator concentration is estimated as an average of simulated peak and trough concentrations.
Figure 4-1: Perpetrator concentration estimated as an average of simulated peak and trough concentrations
-
If the perpetrator does not reach steady state before substrate administration, then as shown in Figure 4-2 and Figure 4-3, the effective perpetrator concentration is estimated as an AUC-driven average concentration across the dosing interval from the time of substrate administration.
Figure 4-2: Traditional AUC concentration
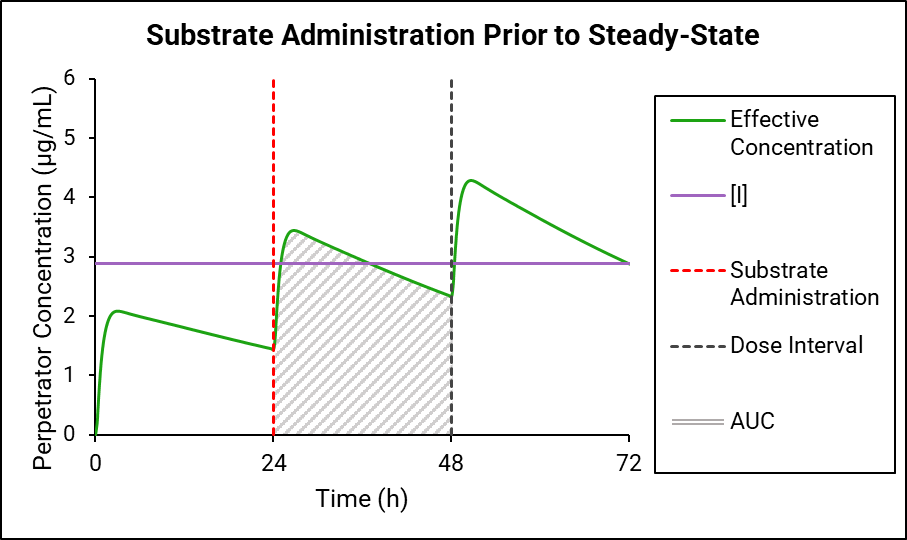
Figure 4-3: Perpetrator concentration estimated as an AUC-driven average across the dosing interval
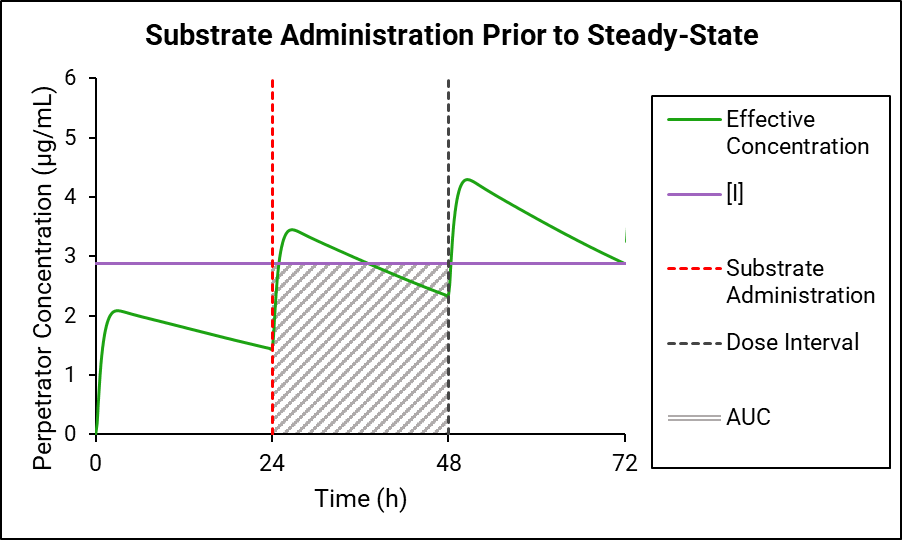
GastroPlus® uses the traditional AUC (Figure 4-2) to “back calculate” an equivalent AUC below the horizontal line, which results in the effective perpetrator concentration being the output of this process. This effective perpetrator concentration is then used as the input for the DDI calculation.
-
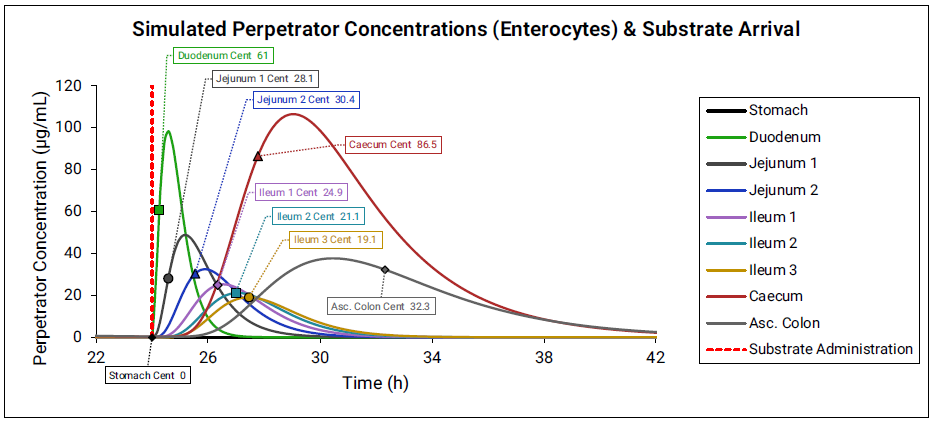
The effective perpetrator concentration in the gut is determined by averaging the enterocyte concentration across all compartments. For each compartment, the perpetrator concentration is calculated based on the administration time of the substrate and the transit time of the compartment.
Figure 4-4: Gut effective perpetrator concentration
fm value estimations from in vitro measurements
You can estimate fm values from in vitro measurements in either recombinant cytochrome P450 enzymes (rCYP) or human liver microsomes (HLM). See:
in vitro measurements in recombinant P450 enzymes (rCYP)
The metabolic profile using rCYPs is assessed by measuring the in vitro clearance of the drug with an in vitro system that expresses one CYP enzyme at a time. The activity of the recombinant CYP enzyme might differ from the activity of the same CYP enzyme in vivo and these differences are commonly accounted for through inter-system extrapolation factors (ISEFs). The calculation of ISEFs requires the following values:
-
The in vitro clearance values of standard substrates for each corresponding CYP enzyme measured in human liver microsomes (HLM) and in the same rCYP system that was used to assay the compound of interest.
-
The amount of the given CYP enzyme in the HLM preparation that was used in the assay with the standard substrate.
See Equation 4-99 through Equation 4-11.
Equation 4-9: ISEF calculation
Equation 4-10: in vivo intrinsic clearance calculation for each enzyme
The fm value for each enzyme, i, is then calculated as shown in Equation 4-11.
Equation 4-11: fm value for each enzyme (i)
where:
|
Variable |
Definition |
|
|
The sum of the in vivo intrinsic clearances for all CYP enzymes. |
|
|
The percent of the total systemic clearance that is due to non-metabolic pathways. |
in vitro measurements in human liver microsomes (HLM)
The metabolic profile using HLM is assessed by employing specific inhibitors of individual CYP enzymes. The in vitro values required are the in vitro intrinsic clearance measured in HLM without the presence of any inhibitors and the in vitro intrinsic clearance values measured in HLM in the presence of inhibitors that are specific for individual CYP enzymes. The in vivo intrinsic clearance is calculated for each enzyme as shown in Equation 4-12.
Equation 4-12: in vivo intrinsic clearance for each enzyme
where:
|
Variable |
Definition |
|
|
The in vitro intrinsic clearance measured with inhibitor. |
|
|
The in vitro intrinsic clearance as measured in the presence of a specific inhibitor for a given CYP enzyme. |
The fm value for each enzyme, i, is then calculated as shown in Equation 4-13.
Equation 4-13: fm value for each enzyme (ii)
where:
|
Variable |
Definition |
|
|
The sum of the in vivo intrinsic clearances for all CYP enzymes. |
|
|
The percent of the total systemic clearance that is due to non-metabolic pathways. |
1.Lu, C., Miwa, G.T., et al. (2007). “A novel model for the prediction of drug-drug interactions in humans based on in vitro cytochrome p450 phenotypic data.” Drug Metab. Dispos. 35(1): 79-85.
2.Obach, R.S., Walsky, R.L., et al. (2006). “The utility of in vitro cytochrome P450 inhibition data in the prediction of drug-drug interactions.” J. Pharmacol. Exp. Ther. 316(1): 336-48.
3.Galetin, A., Burt, H., et al. (2006). “Prediction of time-dependent CYP3A4 drug-drug interactions: impact of enzyme degradation, parallel elimination pathways, and intestinal inhibition.” Drug Metab. Dispos. 34(1): 166-75.
4.Wang, Y.H., Jones, D.R., et al. (2004). “Prediction of cytochrome P450 3A inhibition by verapamil enantiomers and their metabolites.” Drug Metab. Dispos. 32(2): 259-66.
5.Almond, L.M., Yang, J., et al. (2009). “Towards a quantitative framework for the prediction of DDIs arising from cytochrome P450 induction.” Curr. Drug Metab. 10(4): 420-32.
6.Fahmi, O.A., Maurer, T.S., et al. (2008). “A combined model for predicting CYP3A4 clinical net drug-drug interaction based on CYP3A4 inhibition, inactivation, and induction determined in vitro.” Drug Metab. Dispos. 36(8): 1698-708.
7.Kato, M., Chiba, K., et al. (2005). “The quantitative prediction of in vivo enzyme- induction caused by drug exposure from in vitro information on human hepatocytes.” Drug Metab. Pharmacokinet. 20(4): 236-43.
8.Ito K, Brown HS, Houston JB (2004). Database analyses for the prediction of in vivo drug–drug interactions from in vitro data. Br. J. Clinical Pharmacol. 57(4): 473-486.
9.Proctor, N.J., Tucker, G.T., et al. (2004). “Predicting drug clearance from recombinantly expressed CYPs: intersystem extrapolation factors.” Xenobiotica 34(2): 151-78.