Deep View Tutorial: Bespoke Plotting
In this tutorial, we will cover:
Creating a bespoke plot combining Cp vs Time with General Clearance and Renal Clearance
Open GPX™ and, in the Dashboard view, click on the icon next to Select to open an Existing project.
Click Browse and navigate to the C:\Users\<user>\AppData\Local\Simulations Plus, Inc\GastroPlus\10.2\Tutorials\GPX Library folder and select the project file GPX Library.gpproject by clicking on it and clicking Open.
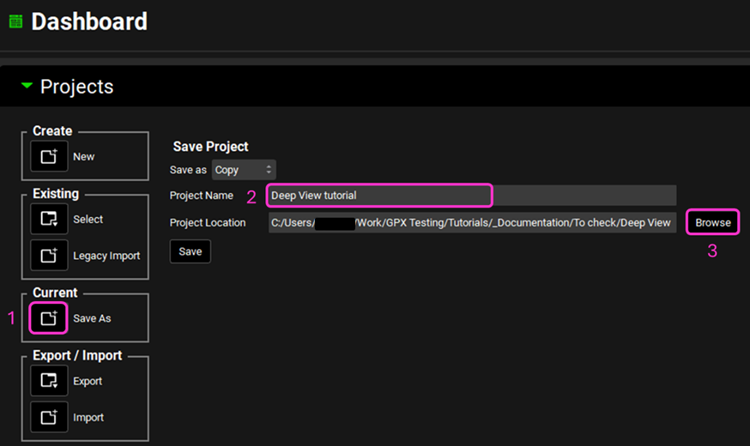
Now we will save a copy of the Library project to keep the original project unaltered. In the Dashboard view, click on the icon next to Save As under the Current frame. From the Save as drop-down, select Copy. Type “Deep View tutorial” as the Project name and click Browse to navigate to/add a folder to Save the project in. Click Save - you will see an information message in the Messages Center indicating that the project has been successfully copied. This message will disappear once you click 'Yes' on the pop-up window that also appears.
Click on the Simulations view in the Navigation pane.
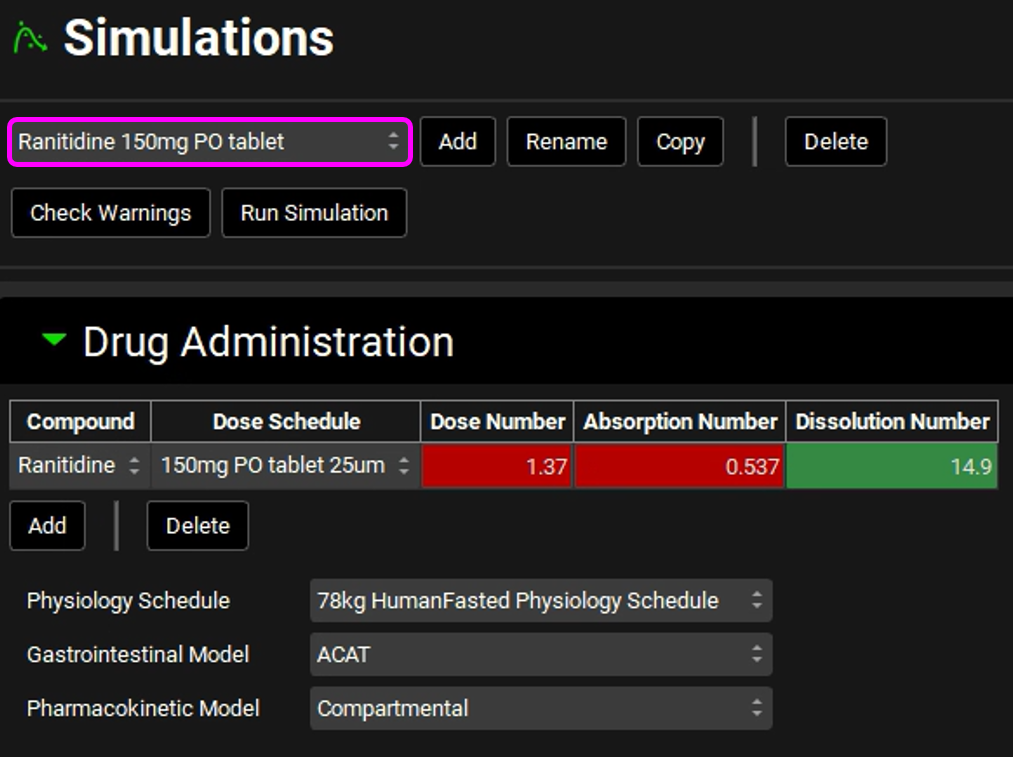
Select the “Ranitidine 150mg PO tablet” simulation and, if it is not open, expand the Drug Administration panel to assess the Dose Number, Absorption Number and Dissolution Number.
Click on Run Simulation.
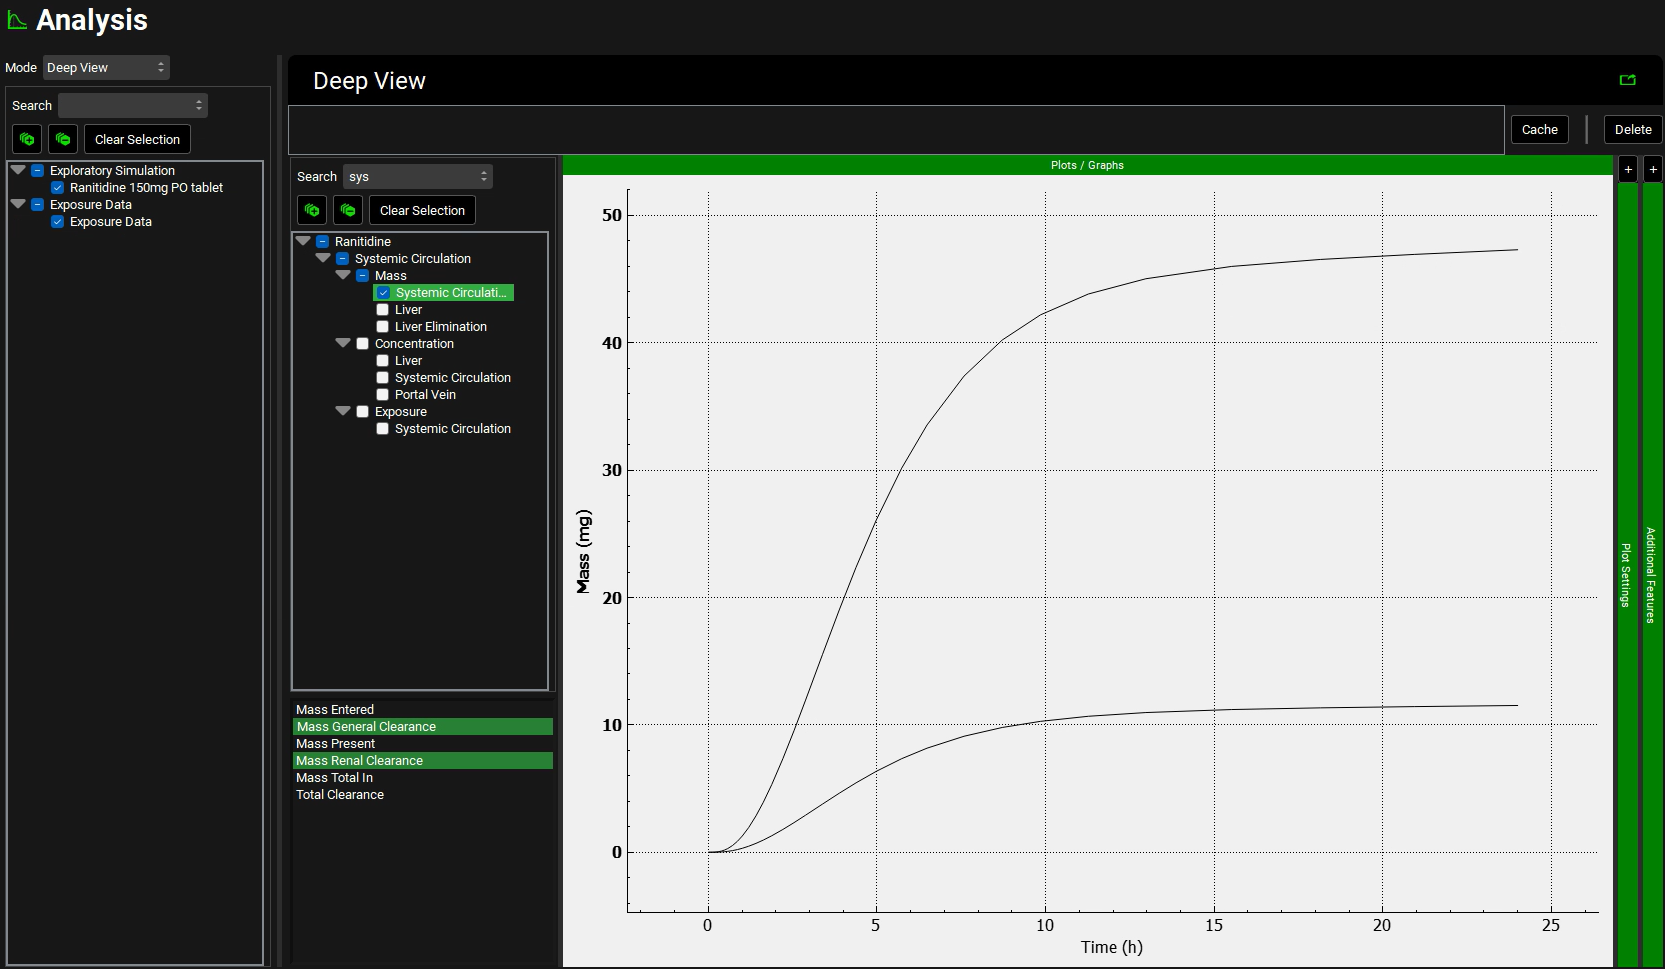
In the Analysis view select Deep View from the Mode drop-down list.

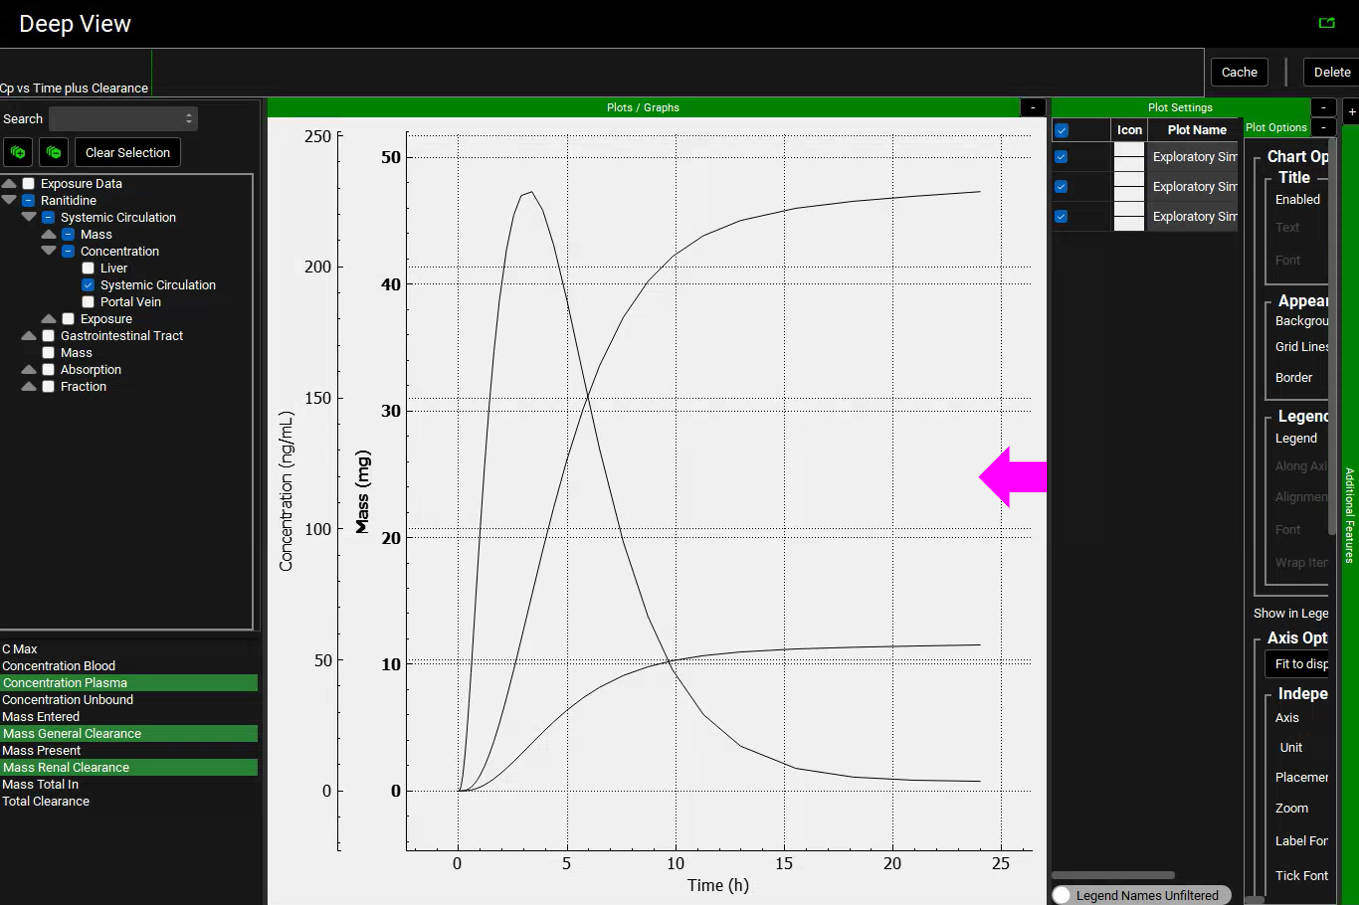
In the Deep View panel type “sys” into the Search box and press Enter.
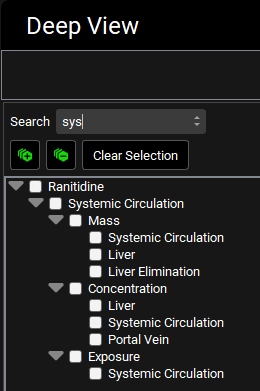
Select Systemic Circulation under Mass. Different options will appear at the bottom of the tree. Hold down Ctrl and click on Mass General Clearance and Mass Renal Clearance.
Delete “sys” from the Search box and press Enter to reset the list, then click on the “-” icon to collapse the list.
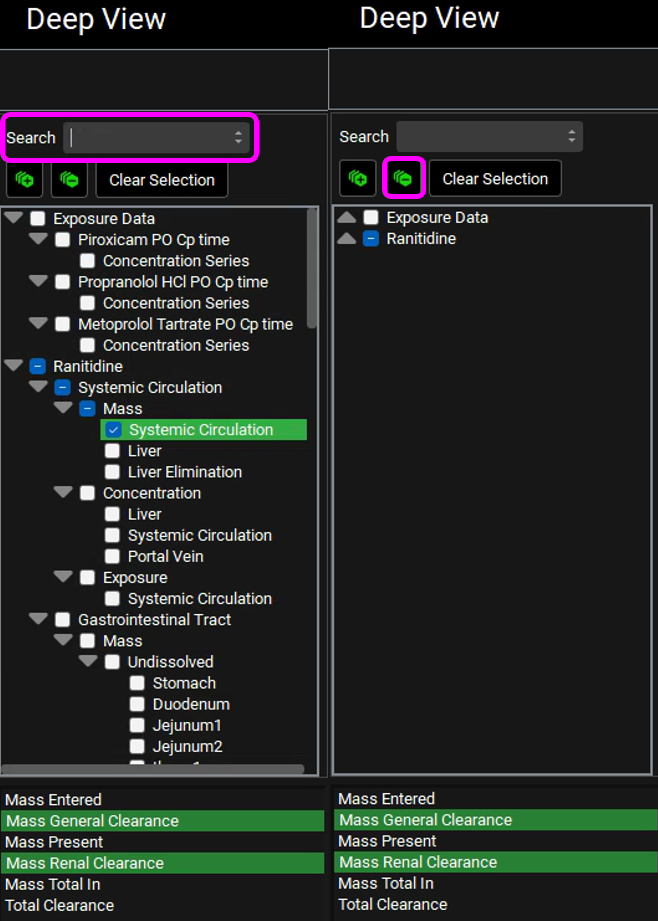
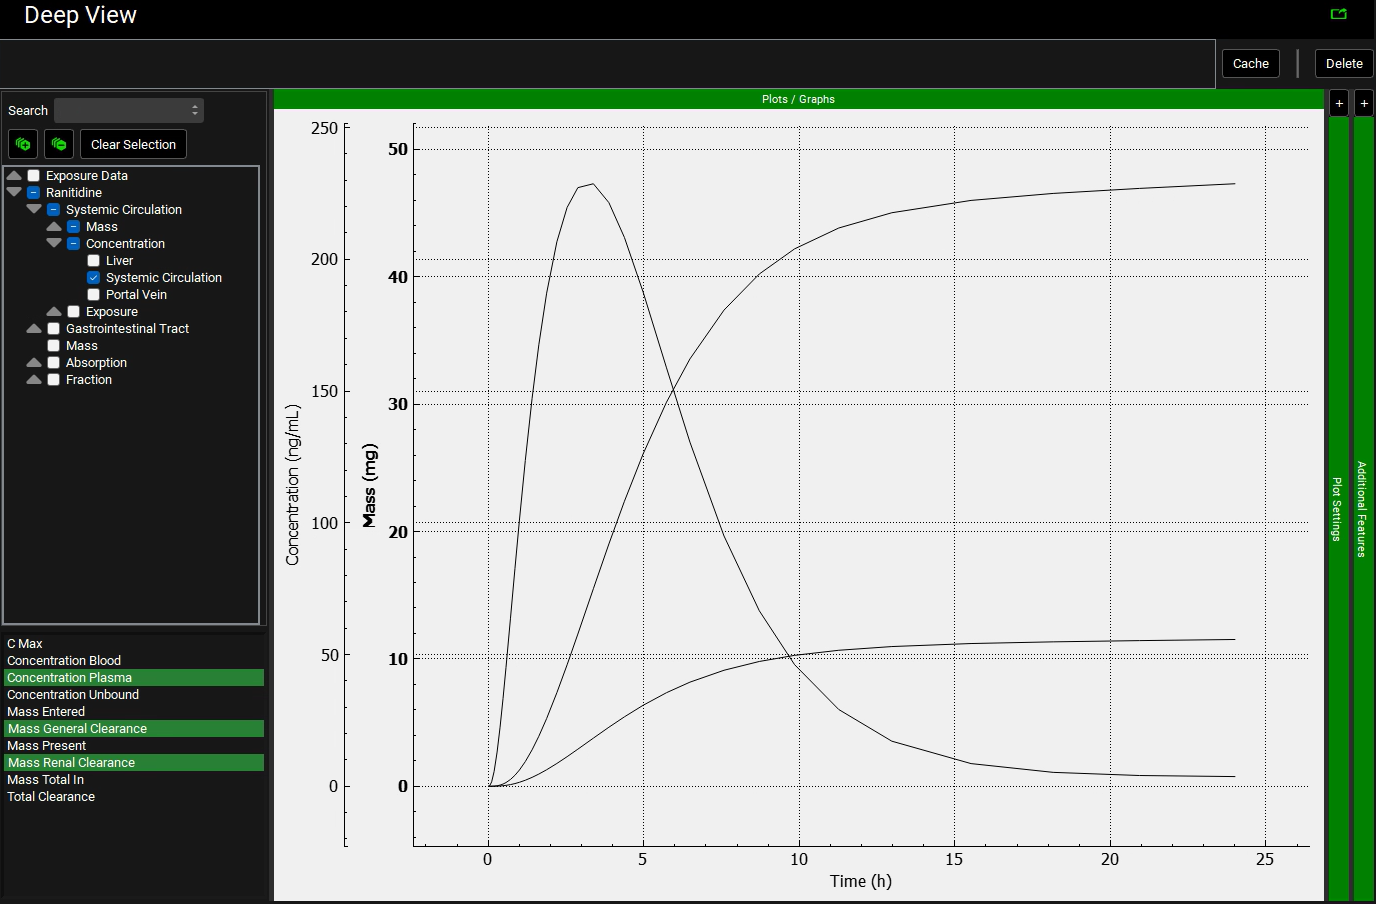
Expand the Ranitidine heading by double clicking on the heading or clicking on the grey arrow. Then expand the Systemic Circulation heading, then expand the Concentration heading and click on Systemic Circulation. New options will appear at the bottom of the tree. Hold down Ctrl and click on Concentration Plasma.
Click on Cache at the top-right of the plot. The Enter View Name dialog box will open and then type “Cp vs Time plus Clearance” and click on OK to store the curve selections for this simulation for the current GPX™ session. You can then recreate the plot with a click on the button when you re-run the “Ranitidine 150mg PO tablet” simulation.
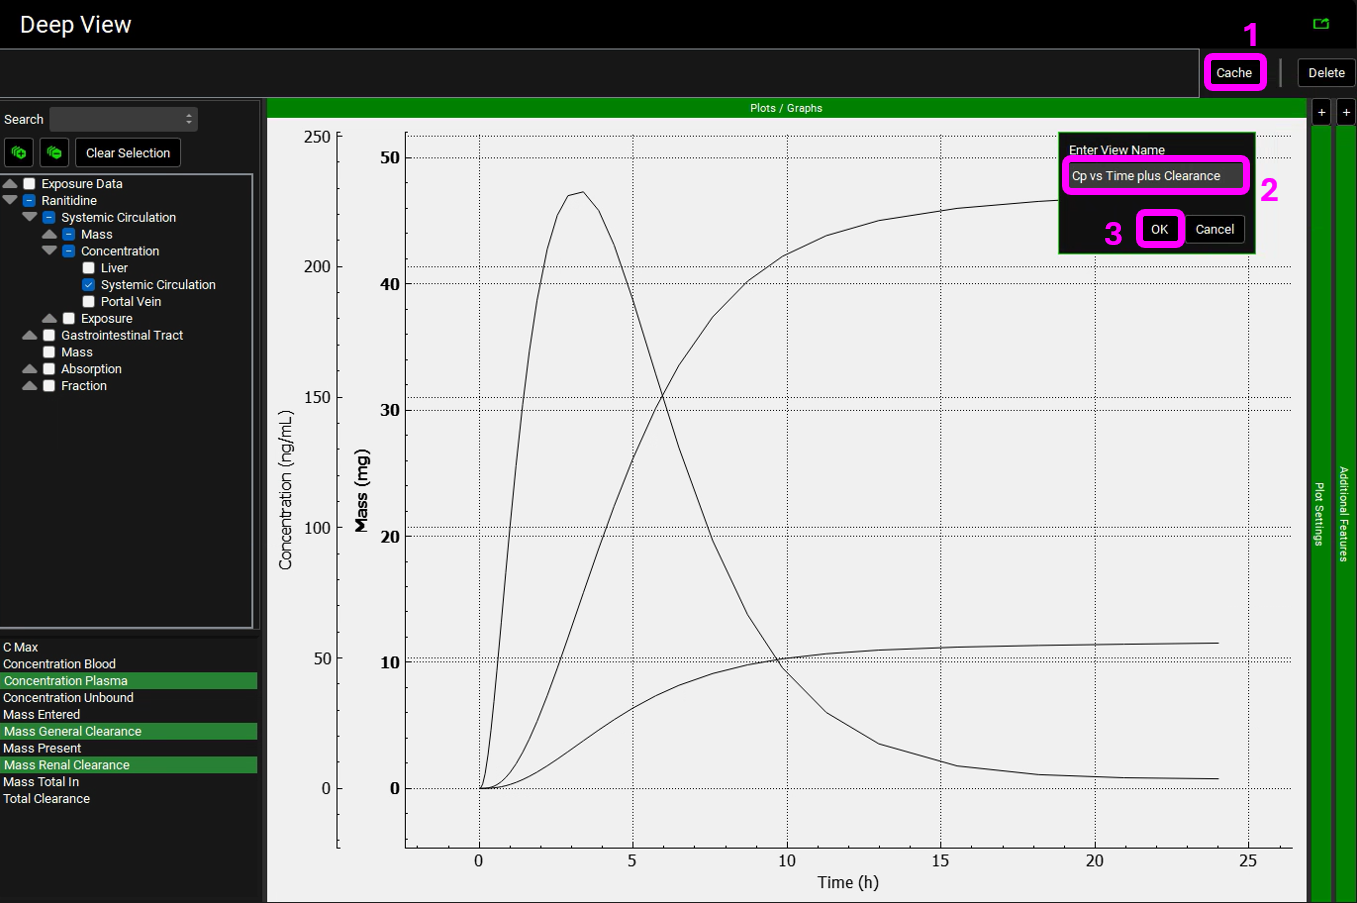

Personalized formatting settings (as detailed in the following section) are not currently stored when a simulation is re-run. Using Cache will allow certain selections to be reapplied to the new simulation results, for example, the title and coloring, although not the axis placement.
Formatting plots
Use the Deep View “Cp vs Time plus Clearance” cached plot for Ranitidine.
Expand Plot Settings by clicking on “+” and then expand Plot Options by clicking on “+”.
Expand the Plot settings and Plot Options by dragging the divider to the left.
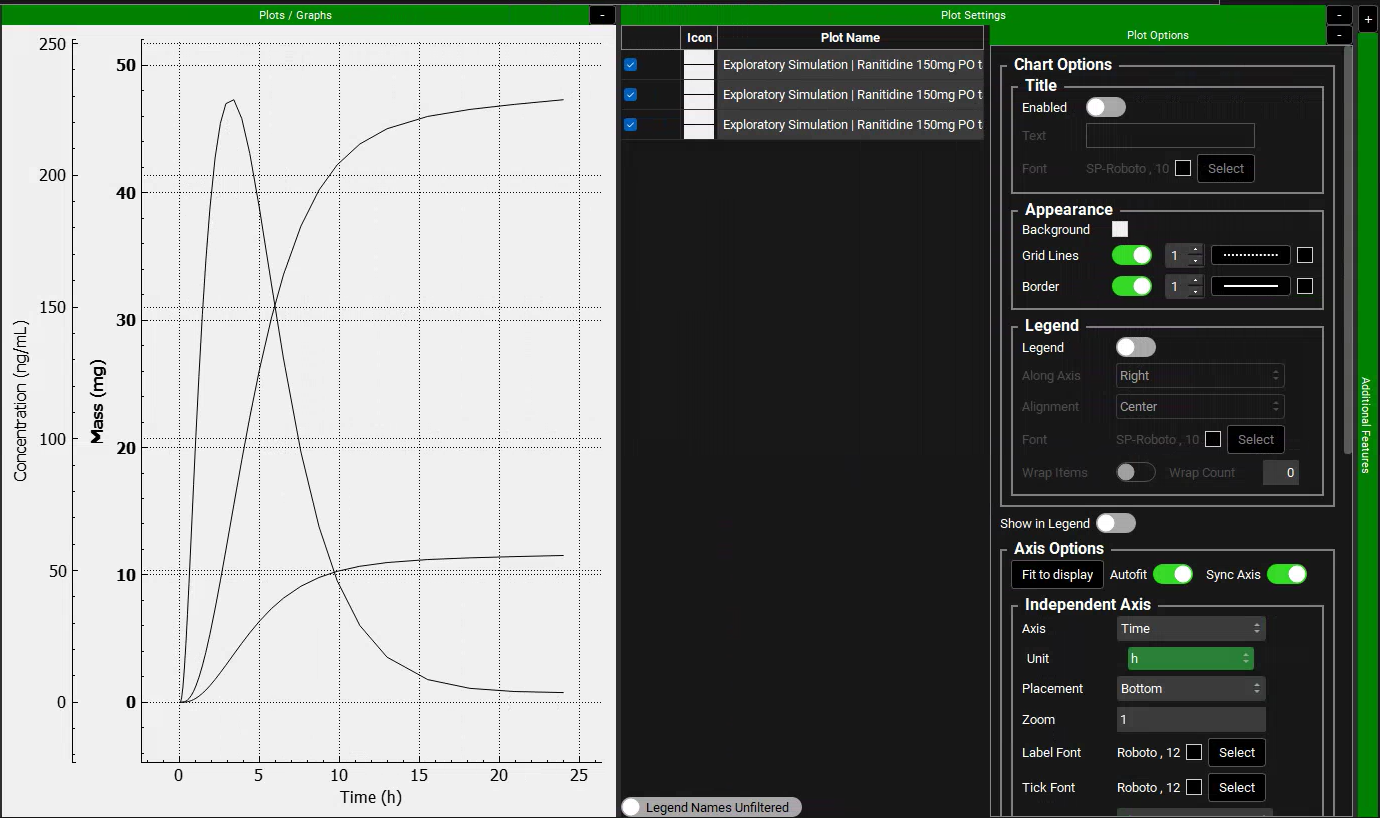
You can collapse the Modules Pane on the right side of the GPX™ interface by dragging its left edge all the way to the right. This increases the plotting display area on your screen.
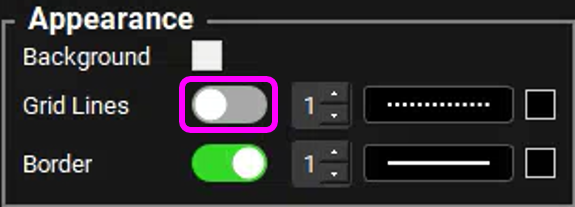
Disable Gridlines toggle in the Appearance settings.
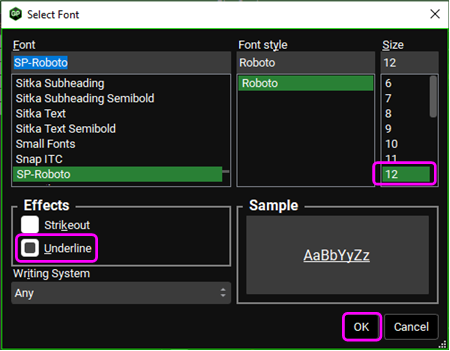
Enable the toggle under the Title settings, type “Cp vs Time plus Clearance” in the text field and click on Select next to Font.
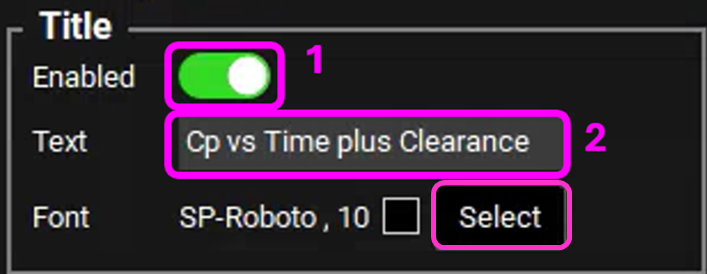
Underline and increase the font of the title via Select next to Font in Title settings.
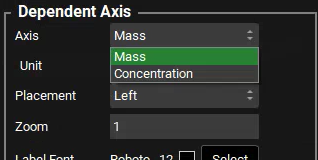
Scroll down to the Dependent Axis settings and select Mass (mg) from the drop-down.
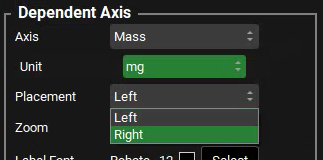
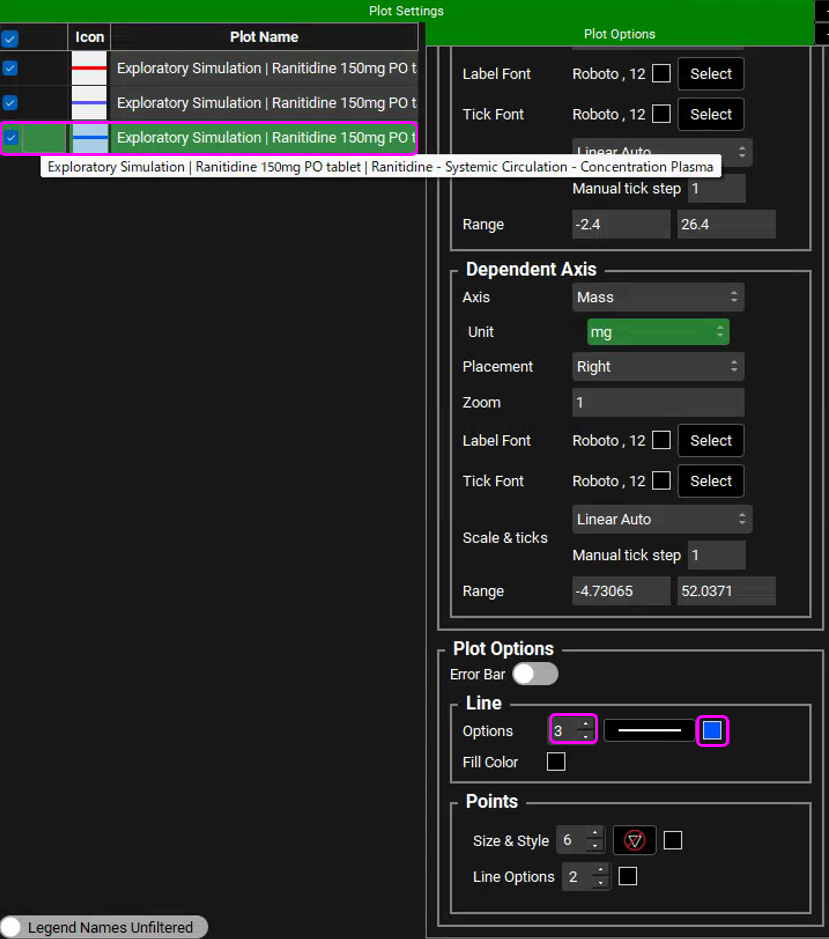
In the Dependent Axis settings select Placement Right.
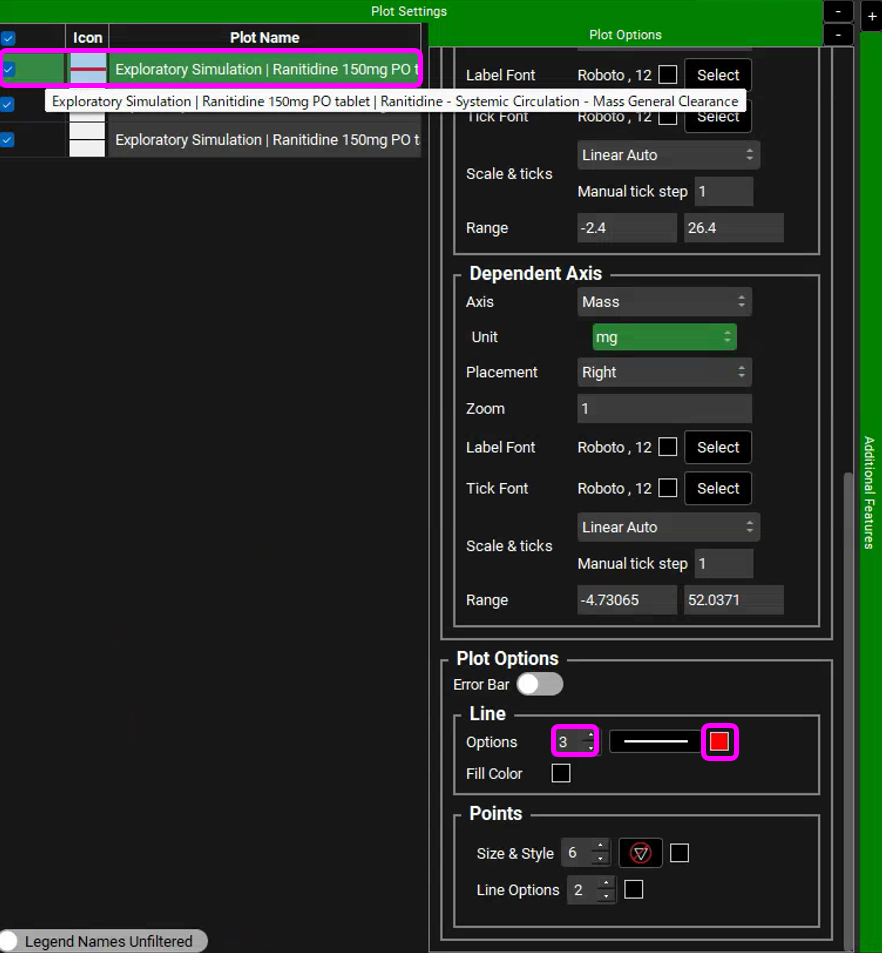
Select the “Systemic Circulation - Mass General Clearance” curve in Plot Name. In the Plot Options, scroll down to Line settings and set the Width to 3 and Color to red next to Options.
Select the "Systemic Circulation - Mass Renal Clearance" curve in Plot Name. In the Plot Options, scroll down to Line settings and set the Width to 3 and Color to purple next to Options.
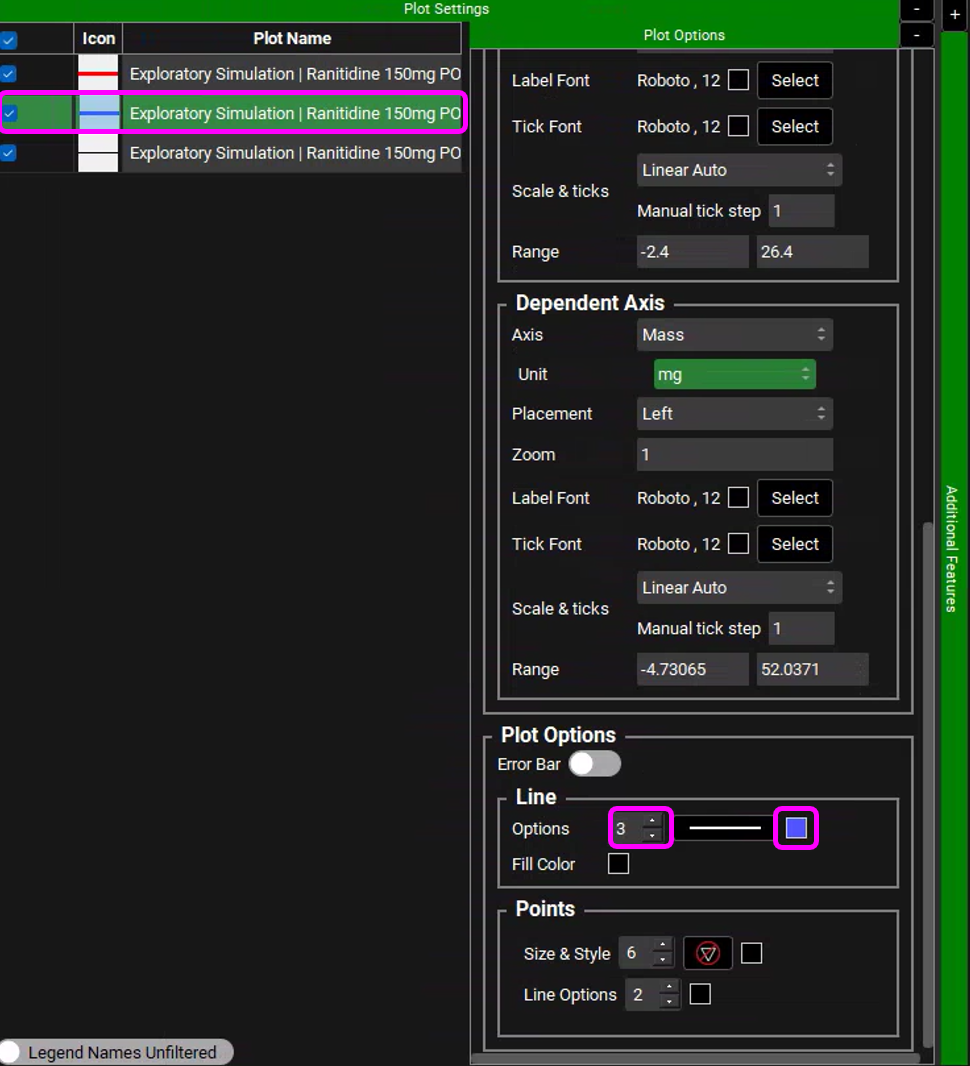
Select the "Systemic Circulation - Concentration Plasma" curve in Plot Name. In the Plot Options, scroll down to Line settings and set the Width to 3 and Color to blue next to Options.
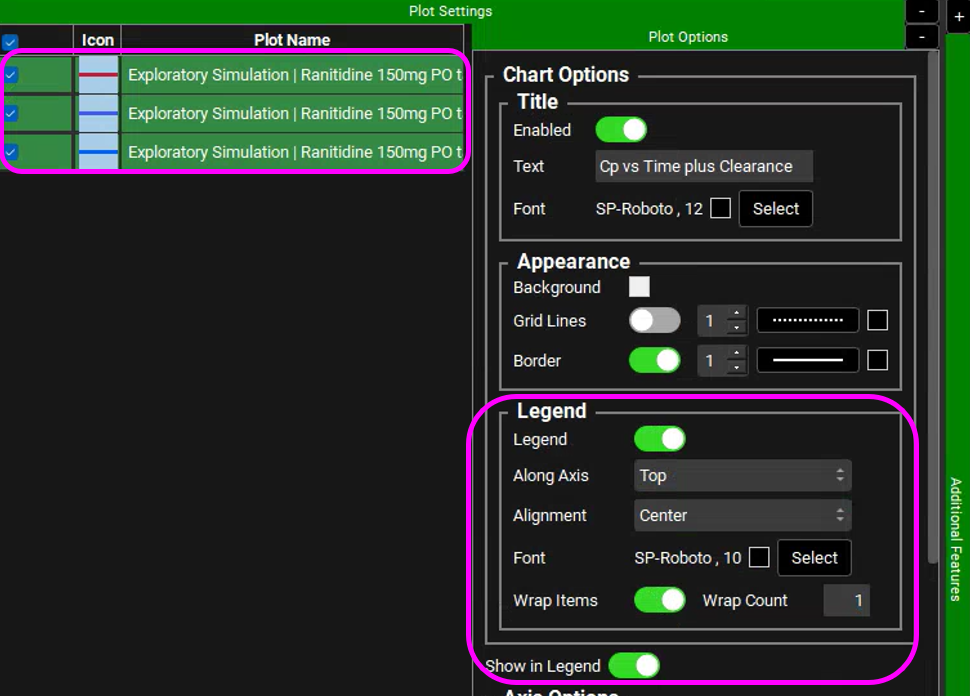
To add a legend to the plot, highlight all curves using a mouse (click on the first curve and hold Ctrl before clicking on the two other curves or click on the first curve and hold Shift before clicking on the last curve). In Plot Options, scroll back up to Legend settings and enable the toggle next to Legend, set Along Axis to Top, Alignment to Center, enable the Wrap Items toggle, set Wrap Count 1 and enable the toggle next to Show in Legend at the bottom of Legend settings.
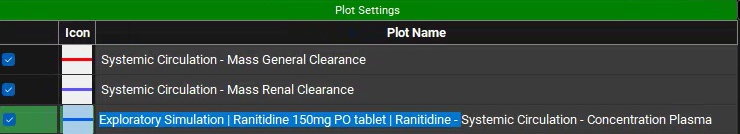
Close the Plot Options window via “-” and then double click in each Plot Name to edit the text. Delete “Exploratory Simulation | Ranitidine 150mg PO tablet | Ranitidine -” from all three curves.
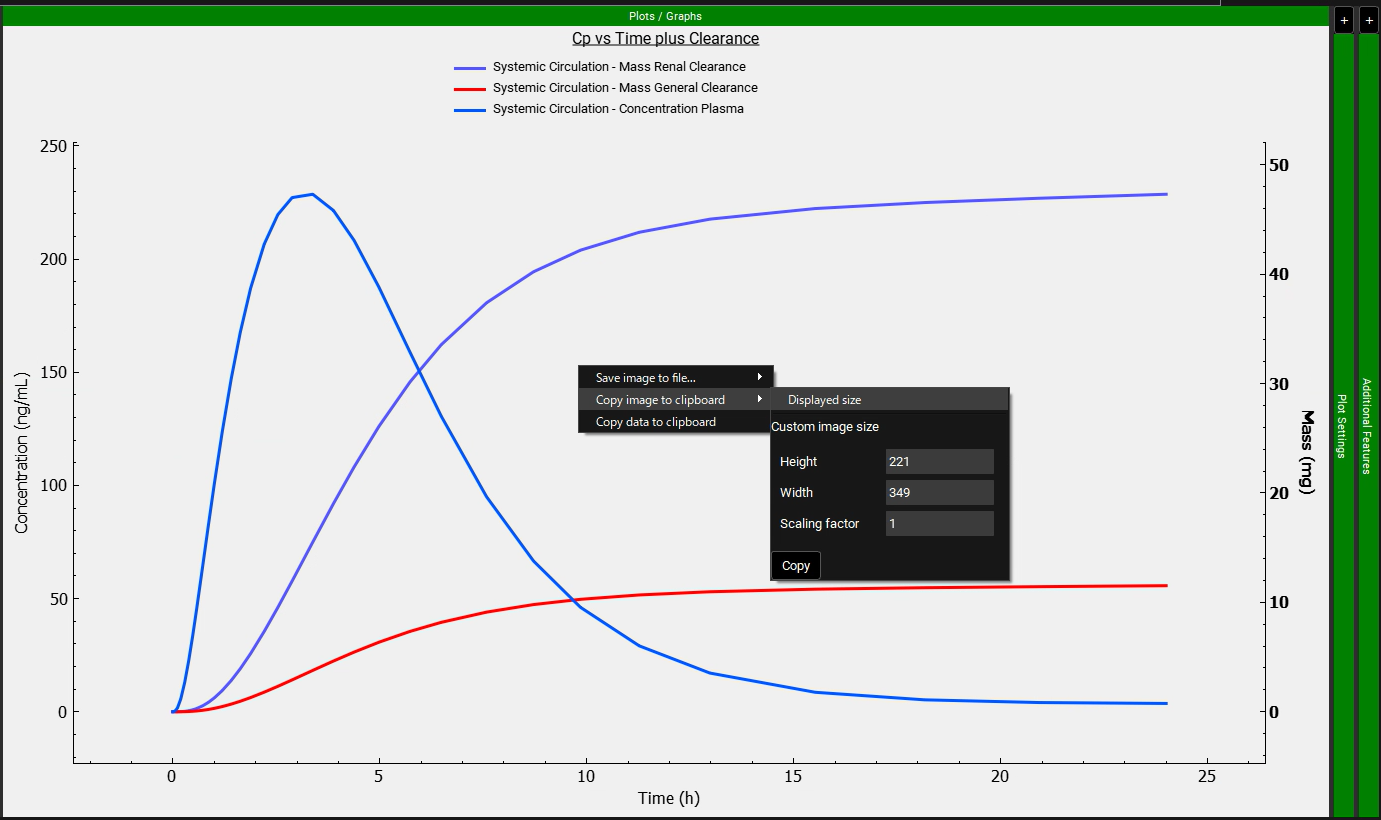
Close Plot Settings via “-”. You can Copy image to clipboard via a right mouse click.