GPX™ Paradigm Tutorial: Navigation Pane and Analysis View
In this tutorial, we will cover:
Creating a GPX™ project from scratch and adding assets
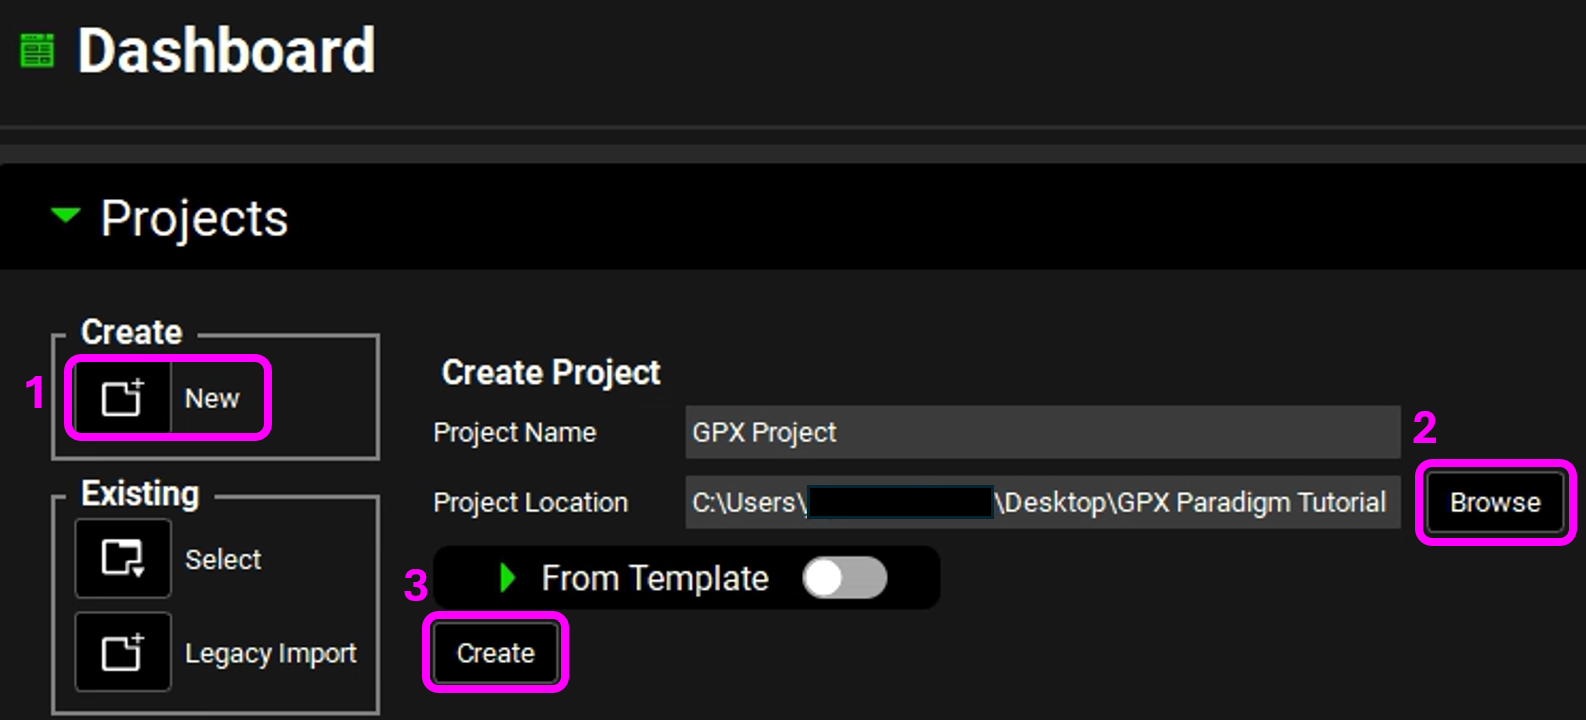
Open GPX™ and, in the Dashboard view, click on the icon next to New to create a new project.
Type in the Project Name “GPX Project” and via Browse navigate to/add a folder to save the project.
Click on Create, the name of the project should now be visible in the top right corner of the program.
Add assets while moving down the views in the Navigation Pane:
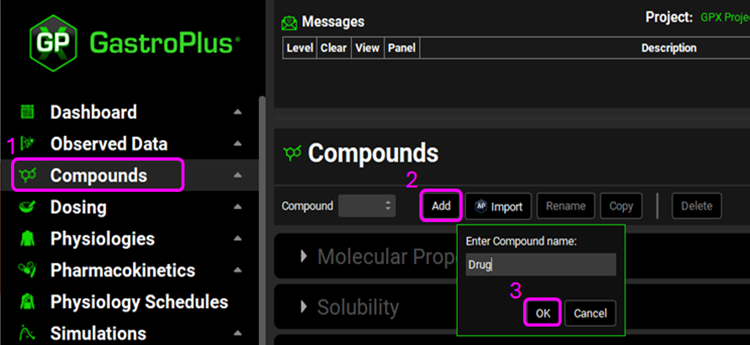
Click on the Compounds view.
Click on Add.
Type “Drug” then click on OK (or press Enter). All panels in the Compounds view are now enabled.
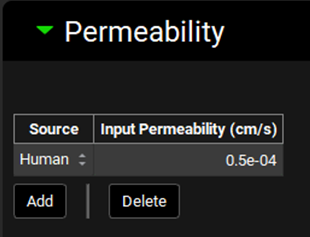
Expand the Permeability panel by clicking on the green arrow or double clicking on the panel bar and enter a value of 0.5e-4 cm/s in place of the default value of 1e-4.
Click on the Dosing view.
Expand the Formulations panel.
Click on Add.
Type "Tablet" then click on OK (or press enter). The Dosing Schedules panel is now enabled.
The formulation name is a free text field and so the entered name does not impact the value of any other parameter.
Expand the Dosing Schedules panel.
Click on Add.
Type "100mg Tablet" then click on OK (or press Enter). Leave the parameters at their default values.
Save the project and click on OK.
Click on the Physiologies view.
Click on Add.
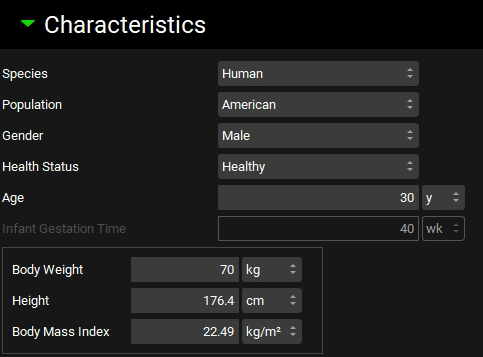
Type "Human 30y 70kg" as a Physiology name and leave species as human, then click on OK (or press Enter).
The physiology name is a free text field and so the entered name does not impact the value of any other parameter.
Update the Body Weight to 70kg in the Characteristics panel.
Save the project and click on OK.
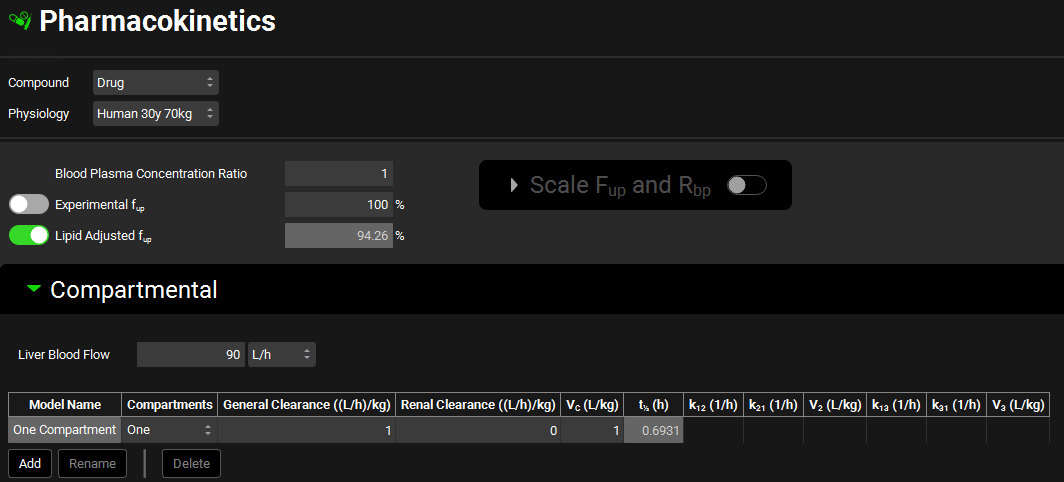
Click on the Pharmacokinetics view.
Expand the Compartmental panel to assess the parameters.
Click on the Physiology Schedules view to assess the schedule that was automatically created.
Click on the Simulations view.
Click on Add.
Type "100mg Tablet Human 30y 70kg" then click on OK (or press Enter).
Review the message in the Messages center and then click on Done.

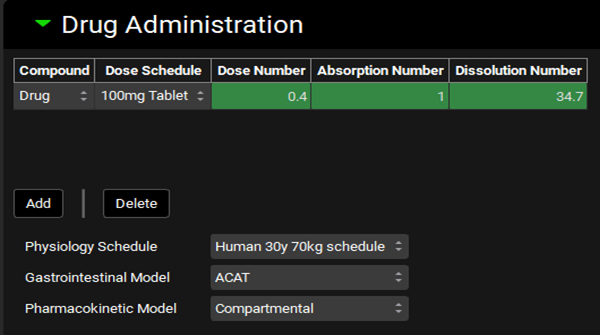
Expand the Drug Administration panel to assess the Dose Number, Absorption Number, and Dissolution Number.
Click on Check Warnings to see if there are any issues.
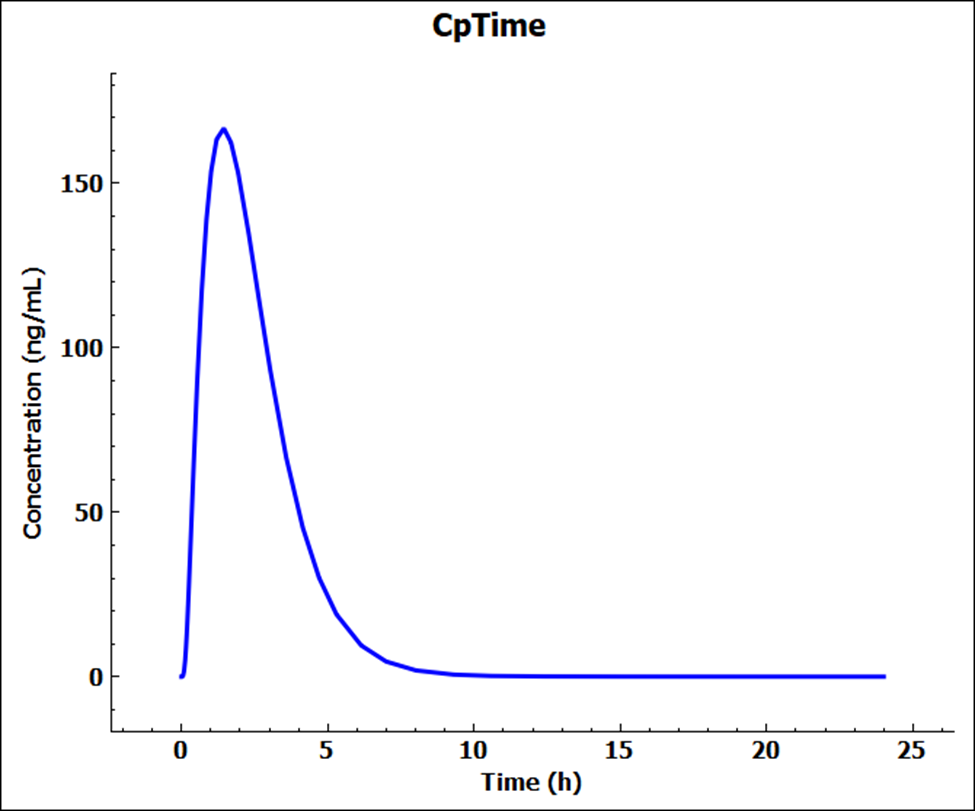
Click on Run Simulation. By default, the Analysis view opens in Key View mode.
Analysis view
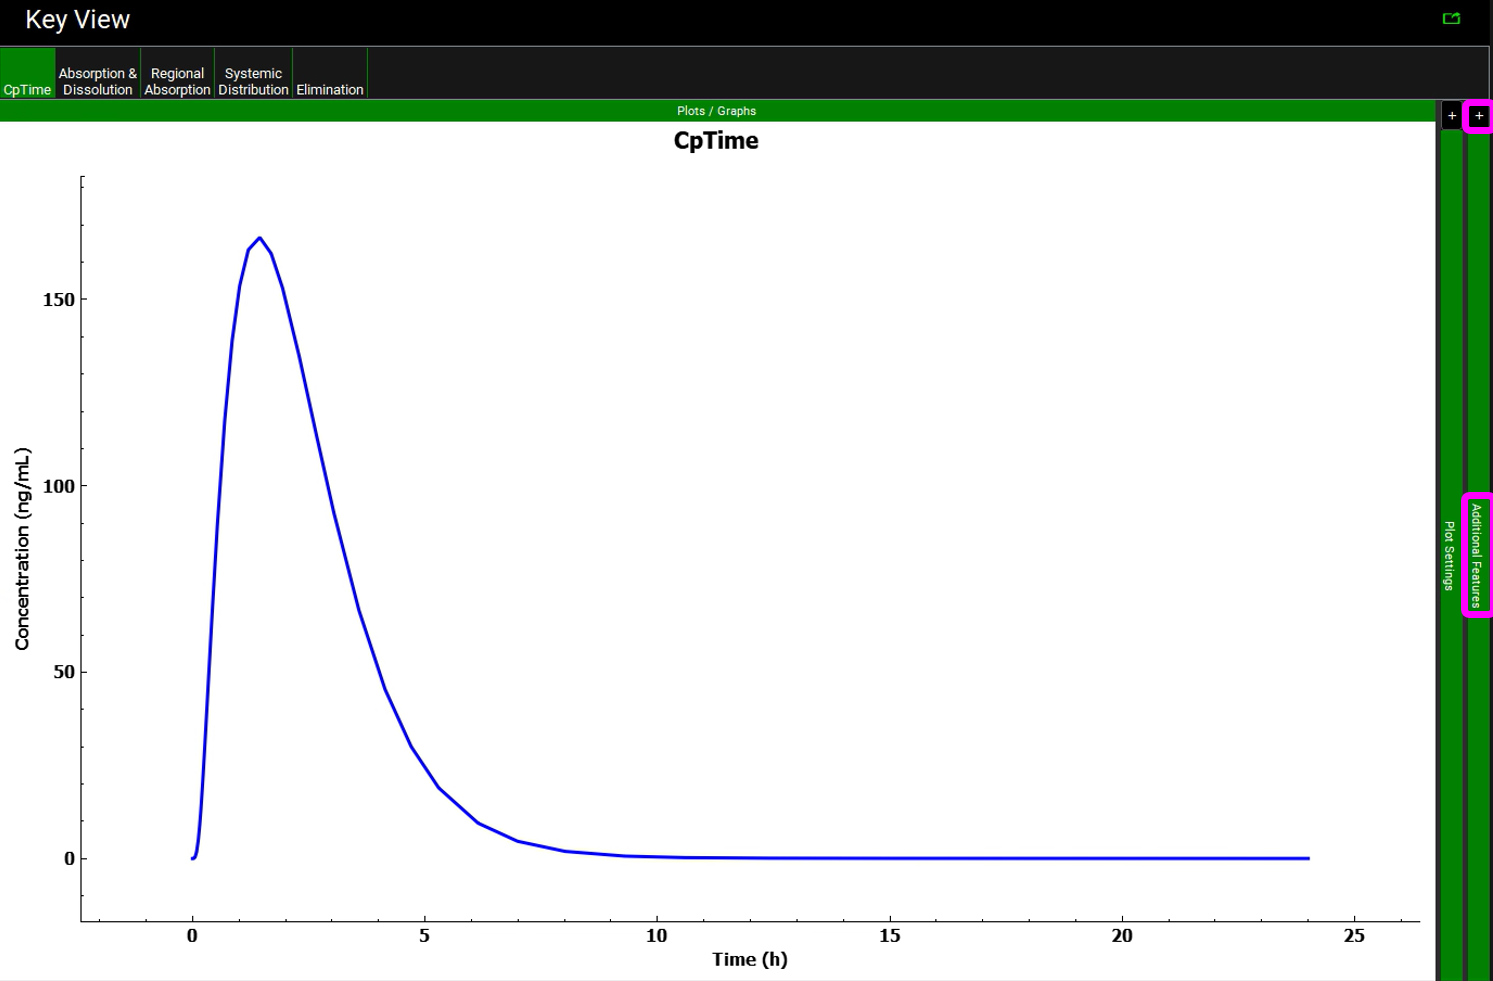
Assess the Cp-Time Key View plot.
To add the simulation results, expand Additional Features via “+” then select the desired simulation.
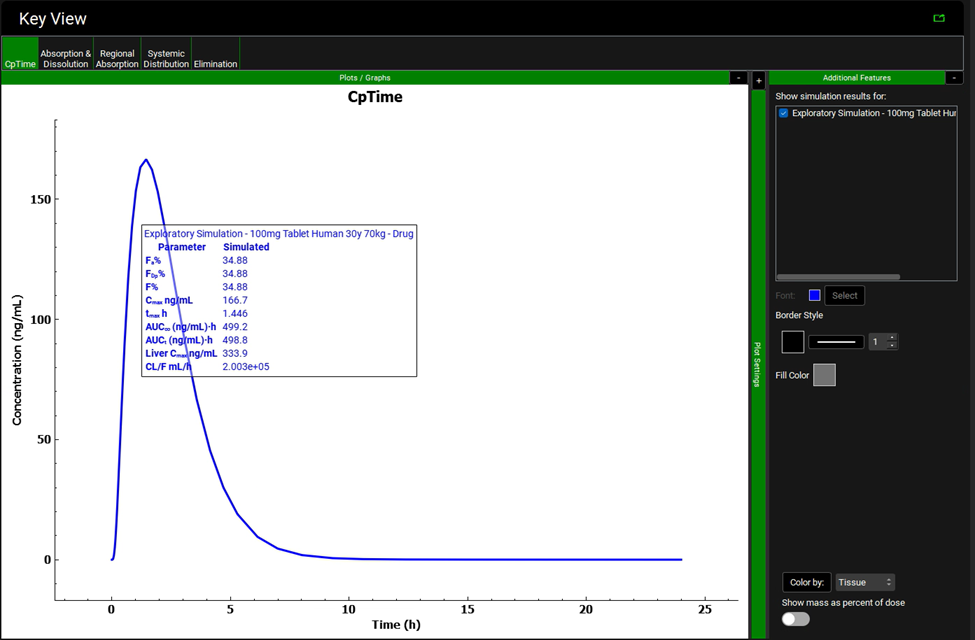
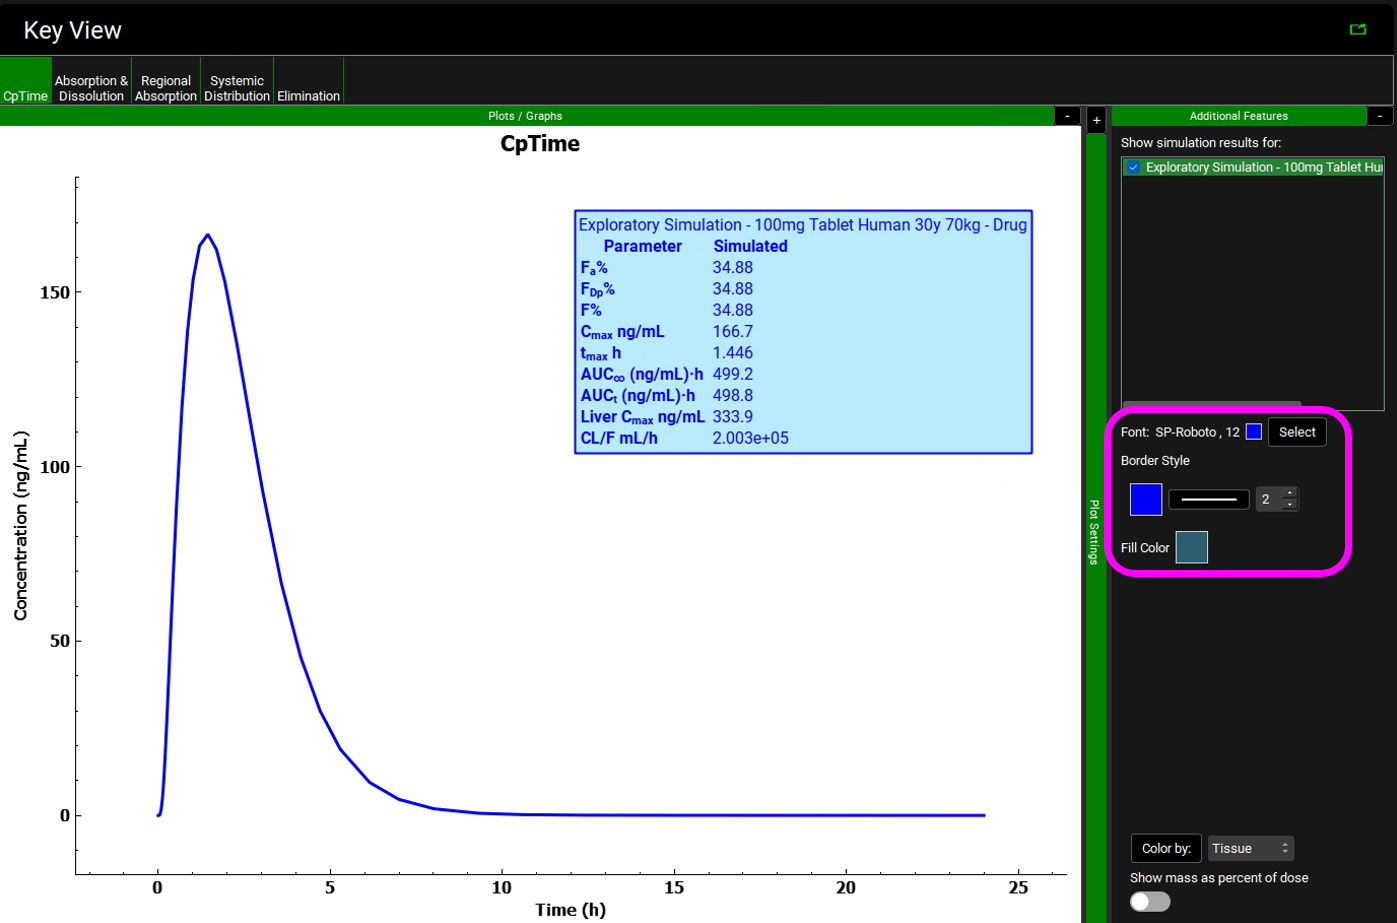
The simulation results panel can be dragged using a mouse to reposition it and the font, border and fill formatted via Additional Features.
Remove the simulations panel by deselecting the simulation in Additional Features.
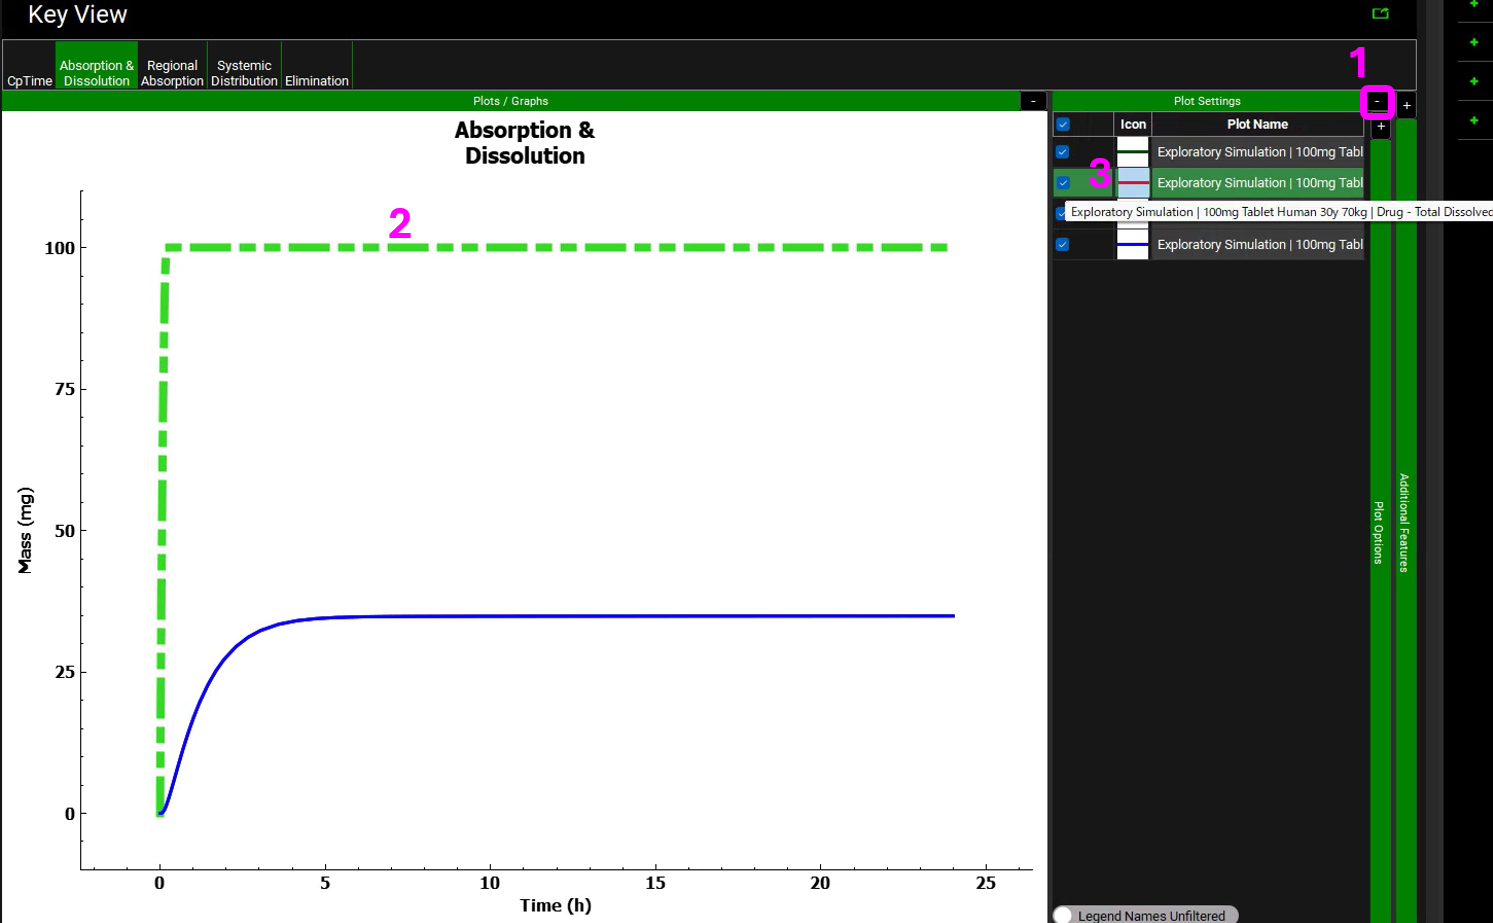
Click on the Absorption & Dissolution Key View plot to determine that permeability is limiting absorption.
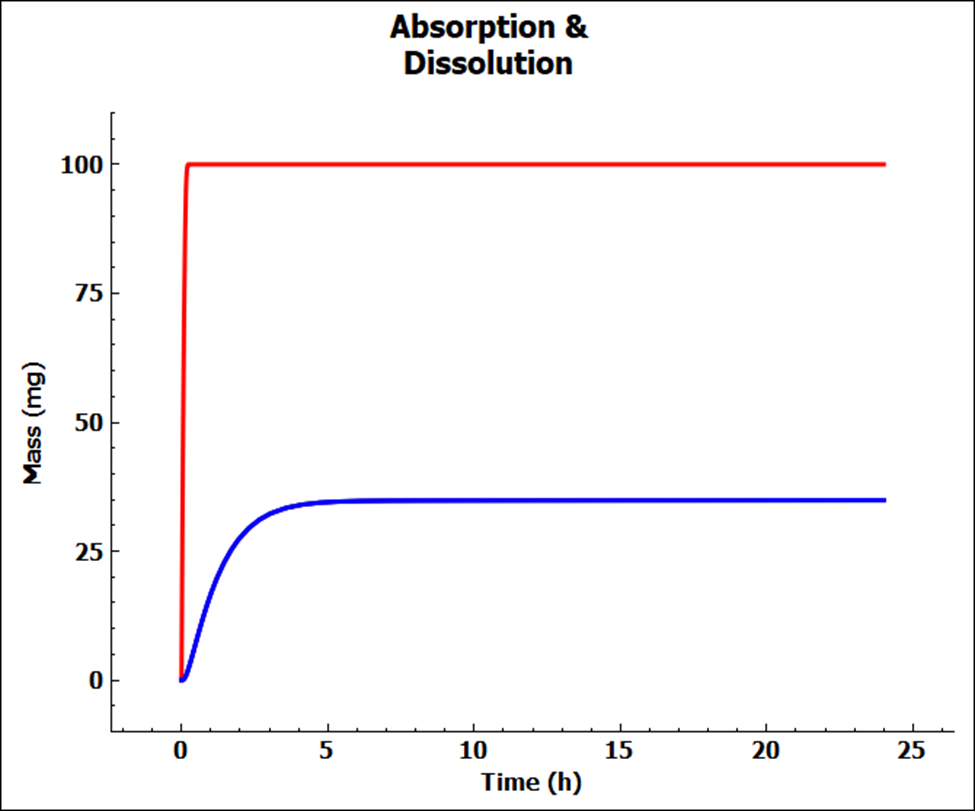
To see the legend, expand Plot Settings via “+” then click on a curve and hover over the highlighted Plot Name.
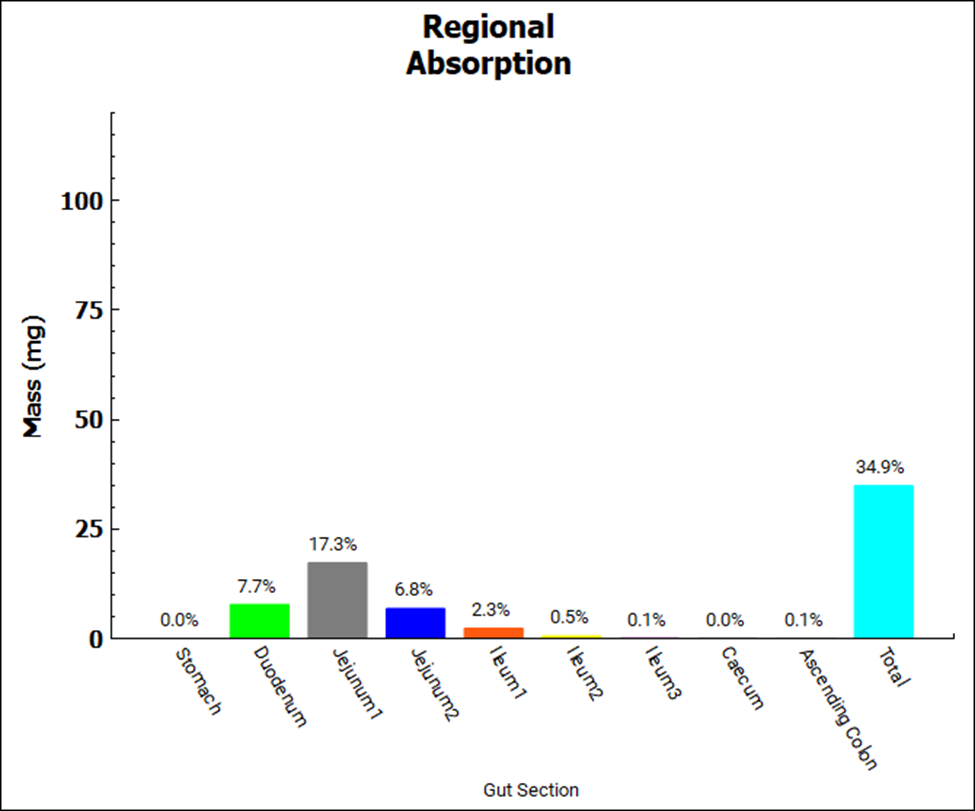
Click on the Regional Absorption Key View plot to determine that the absorption is mainly from the small intestine compartments.
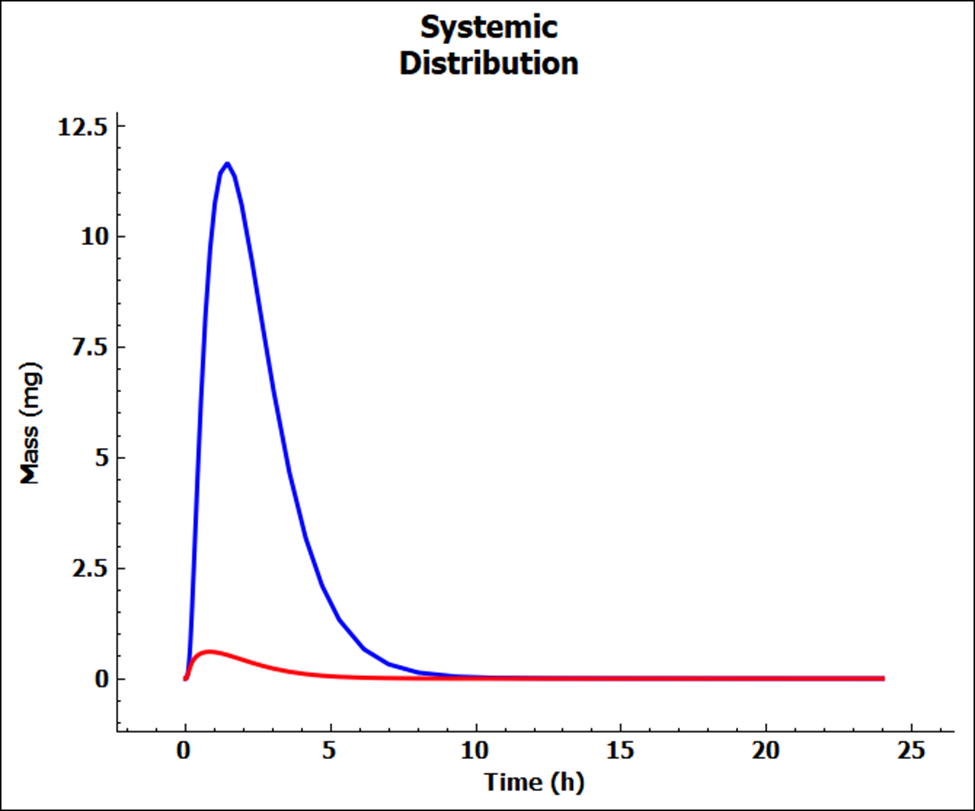
Click on the Systemic Distribution Key View plot to assess the mass in the systemic circulation (blue curve) and the liver (red curve).
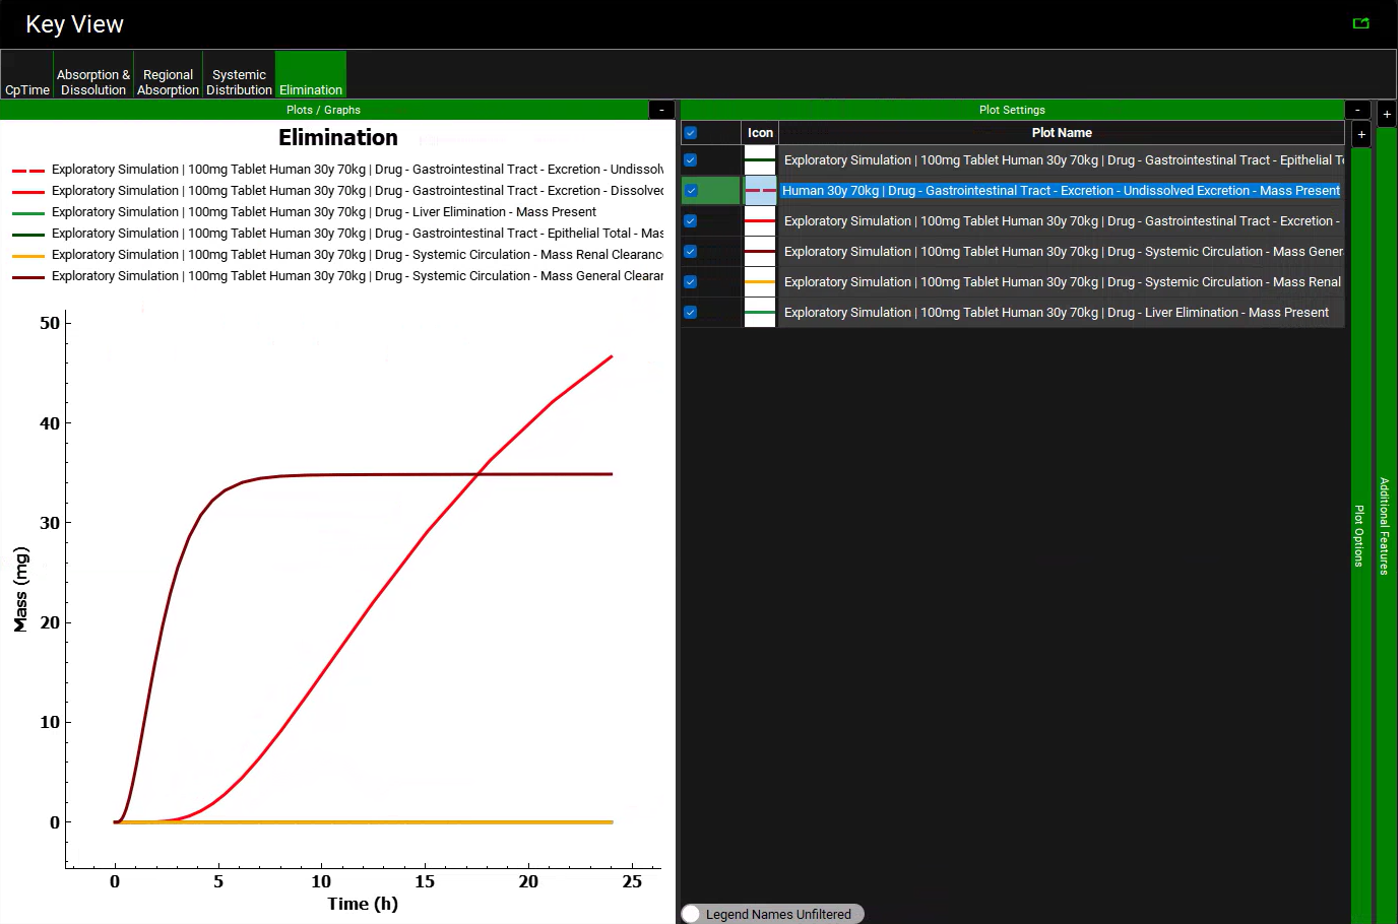
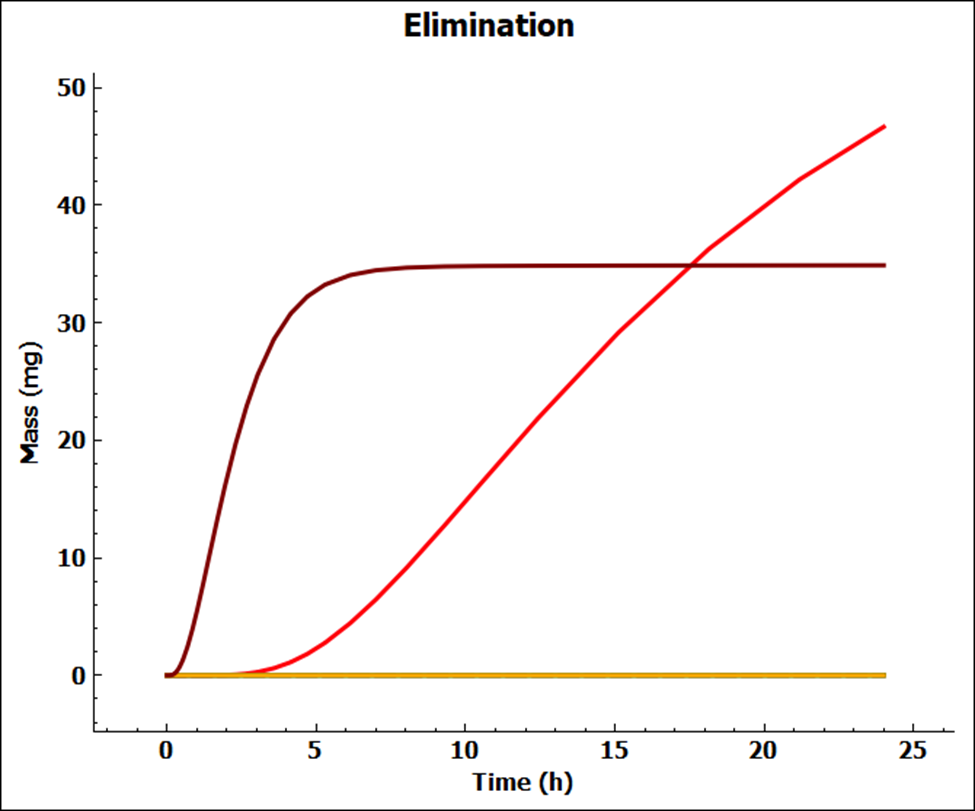
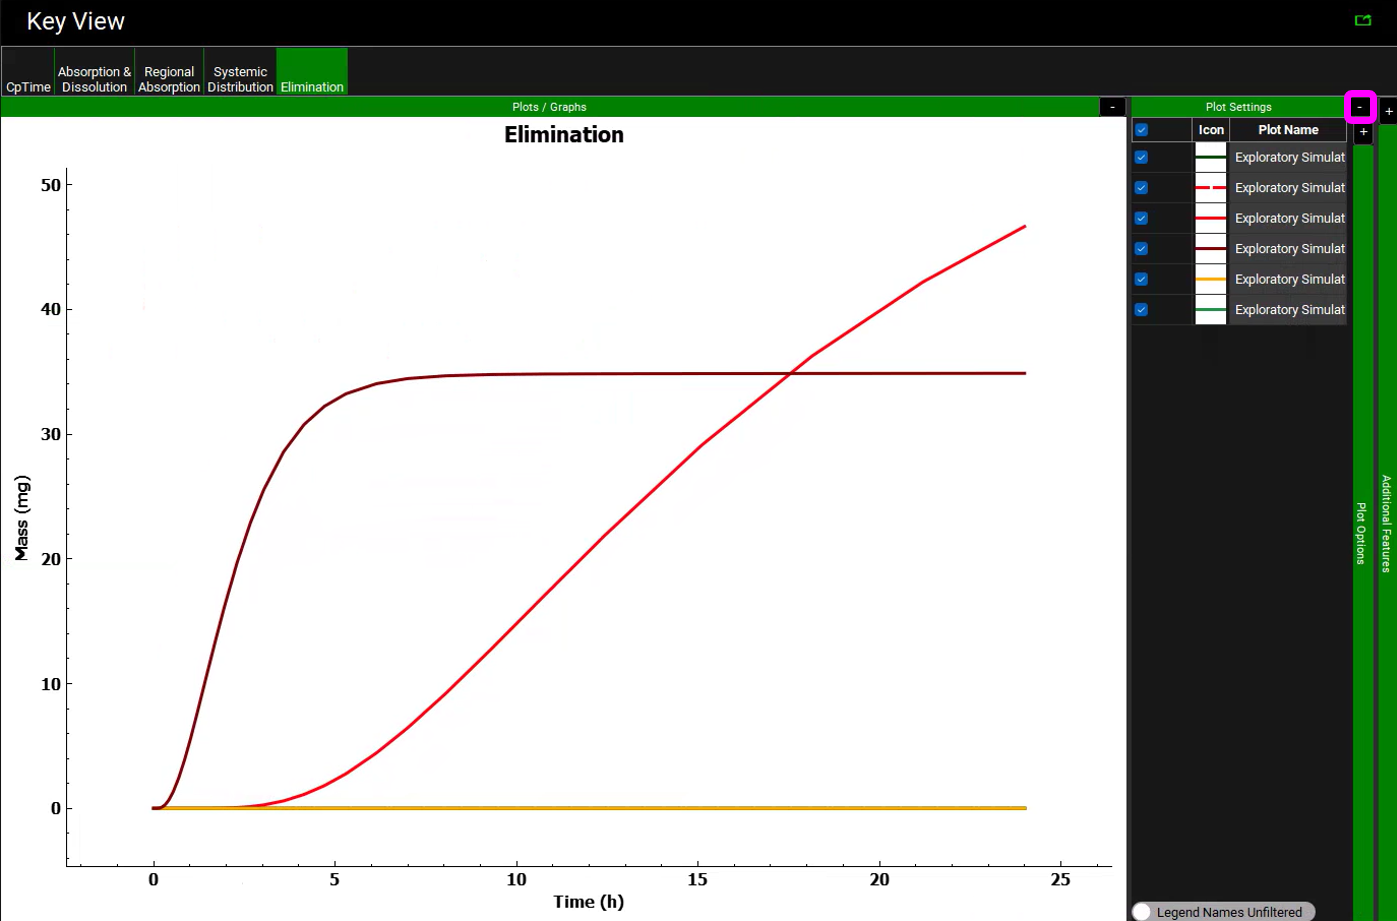
Click on the Elimination Key View plot to determine that the compound is eliminated via general clearance and excreted as dissolved drug.
To add a legend to the plot, expand Plot Settings via “+” and highlight all curves using a mouse (click on the first curve and drag the mouse down to the last curve or click on the first curve and hold down Shift while clicking on the last curve).
Expand Plot Options for a second time via “+”.
Enable Legend toggle, select Along Axis Top, Wrap Items ON, Wrap Count 1, and enable Show in Legend toggle.
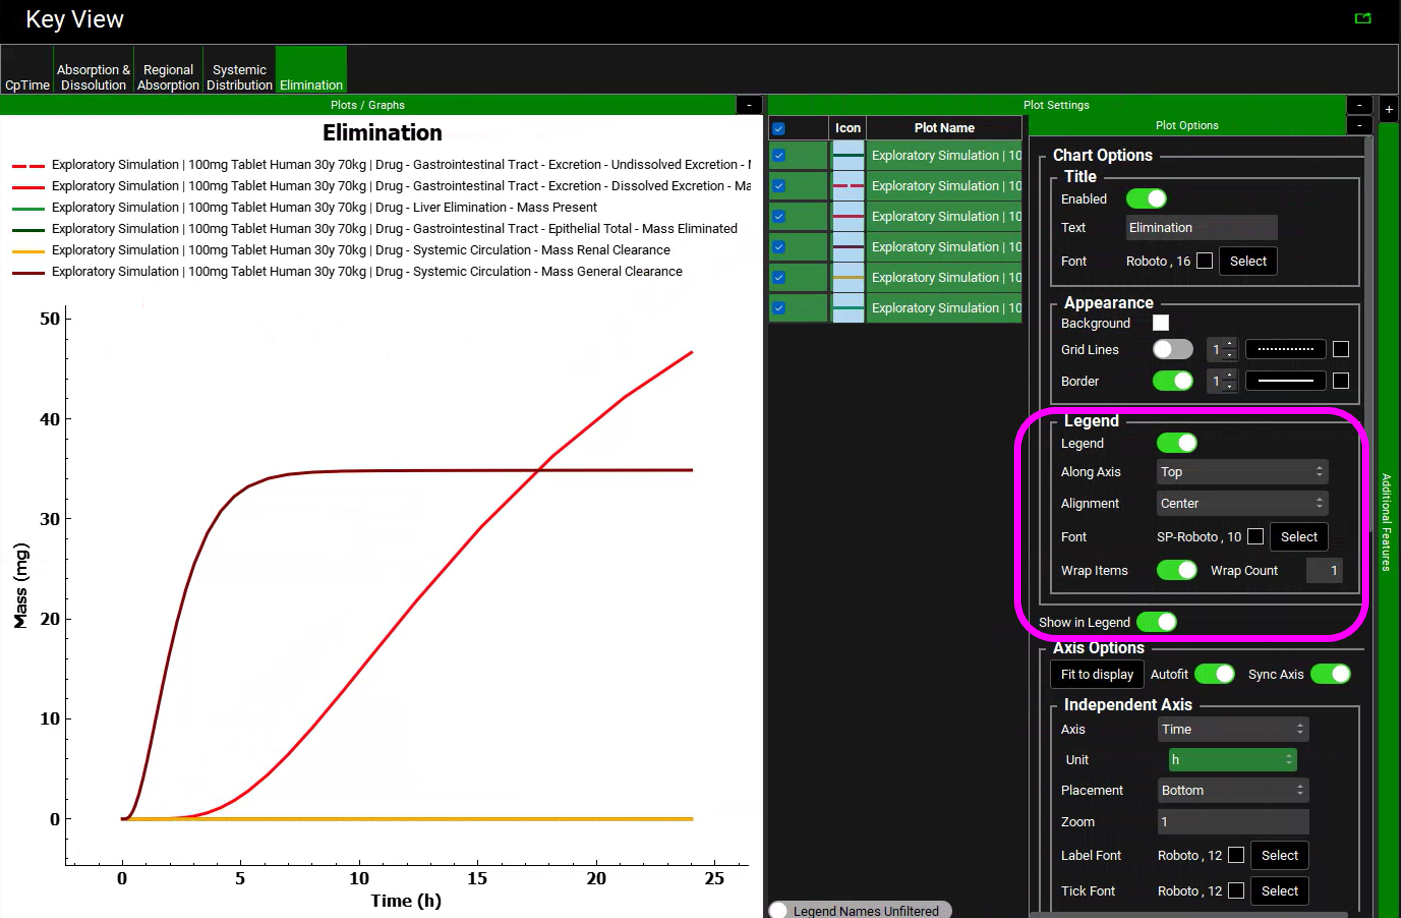
The Plot Names can be edited by double clicking in the name of interest.