
GPX™ Run Modes Tutorial: Population Simulations Using GPX™ Library Project
The Population Simulator feature in GastroPlus® is a powerful capability that allows you to assess the combined effects of variations in physiology and pharmacokinetics (PK) within populations, as well as formulation variables that are not precise values, but for which distributions of values can be estimated. A population simulation is a simulated clinical trial in which each subject is randomly (“Monte Carlo”) generated to have a unique set of transit times, gastrointestinal pH’s, PK parameters, plasma protein binding, small intestine length and radius, stomach volume, caecum length and radius, colon length and radius, hepatic blood flow rate, and PK parameters. The variations in each variable are generated by random sampling of each variable within its defined distribution for each simulated virtual subject.
In this tutorial, we will cover:
Running a population simulation for Brick Dust in the GPX™ Library project
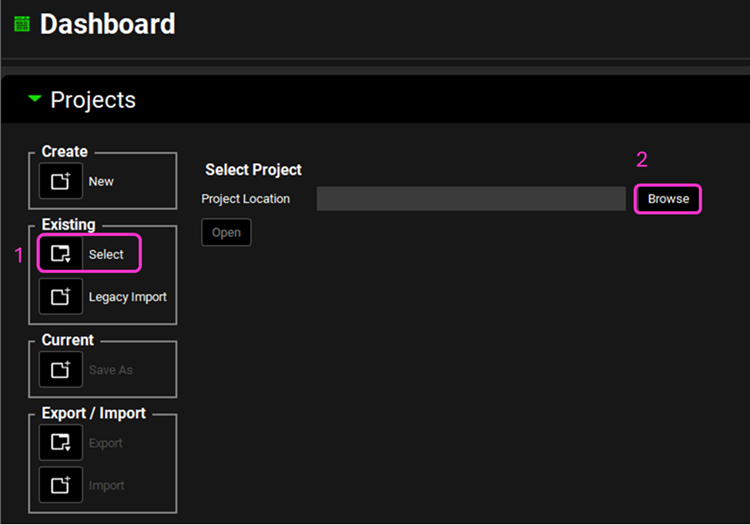
Open GPX™ and, in the Dashboard view, click on the icon next to Select to open an Existing project.
Click Browse and navigate to the C:\Users\<user>\AppData\Local\Simulations Plus, Inc\GastroPlus\10.2\Tutorials\GPX Library folder and select the project file GPX Library.gpproject by clicking on it and clicking Open.
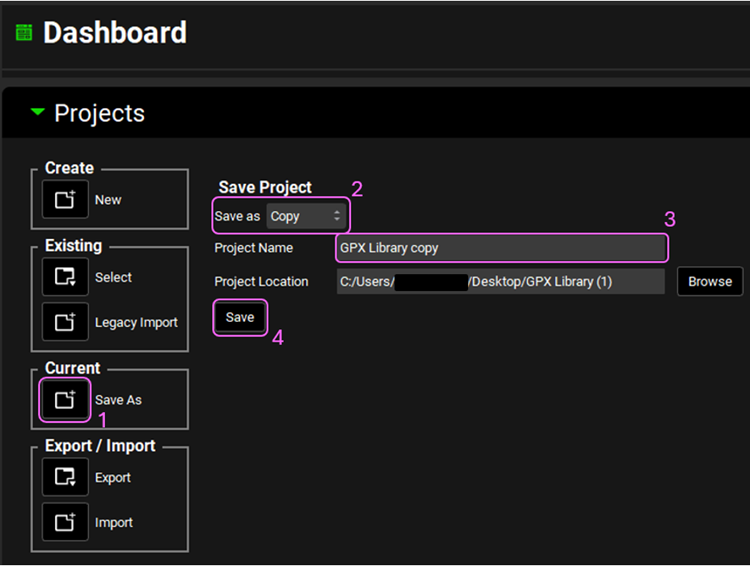
Now we will save a copy of the Library project to keep the original project unaltered. In the Dashboard view, click on the icon next to Save As under the Current frame. From the Save as drop-down, select Copy. Type “GPX Library copy” as the Project name and click Browse to navigate to/add a folder to Save the project in. Click Save - you will see an information message in the Messages Center indicating that the project has been successfully copied. This message will disappear once you click 'Yes' on the pop-up window that also appears. Note that the name of the project visible in the top right corner of the interface is the one that has just been created.
Move through the views on the navigation pane from Compounds to Simulations, observing the information that has been entered in this project.
In the Simulations view, select the “Brick Dust 10mg PO tablet” simulation. Click on Check Warnings and then on Run Simulation.
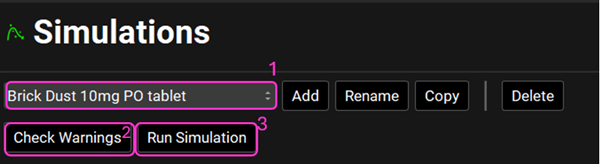
NB – numbers reflect the order of the steps in the screenshot, rather than corresponding to the steps in the tutorial.
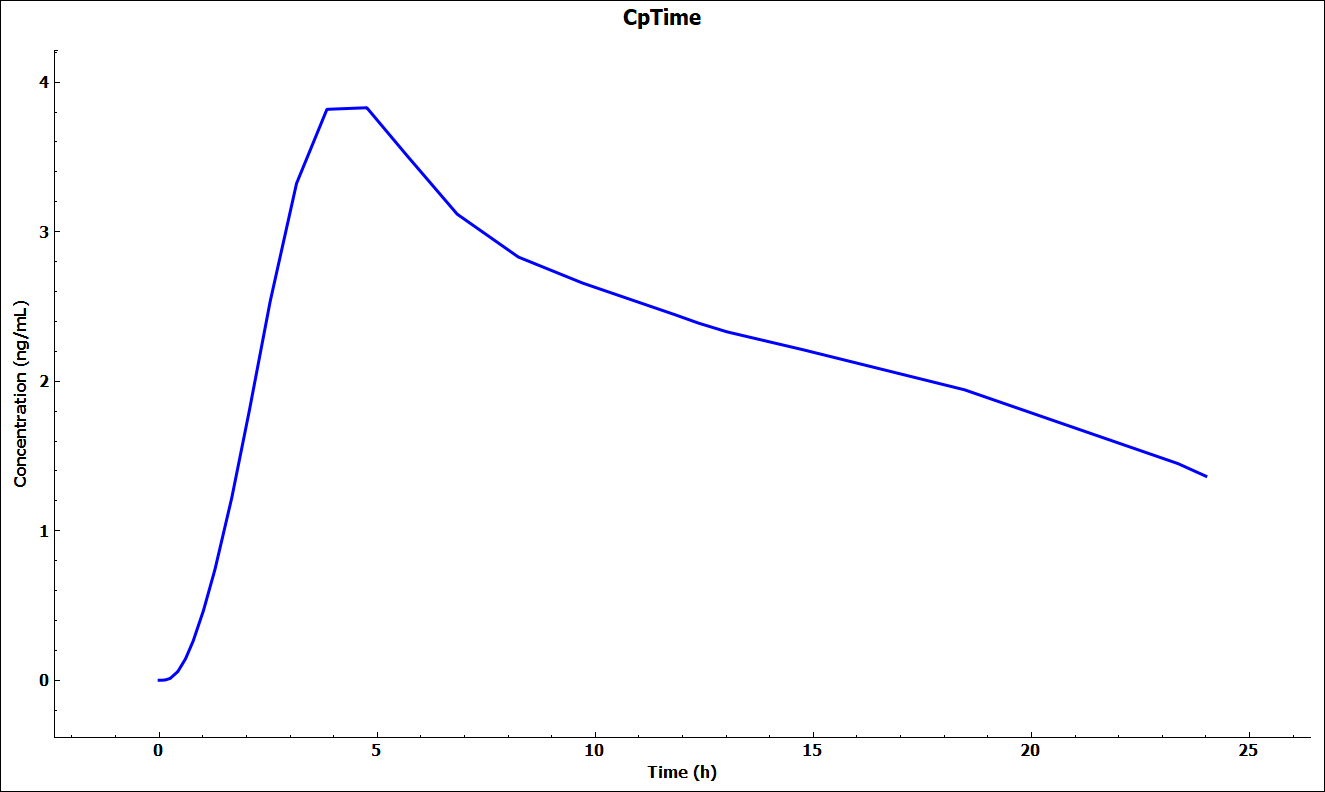
A single simulation has now been run and when it completes it will automatically switch to the Analysis view and the Cp-Time plot.
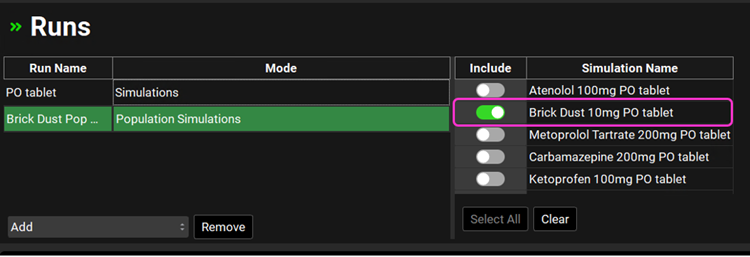
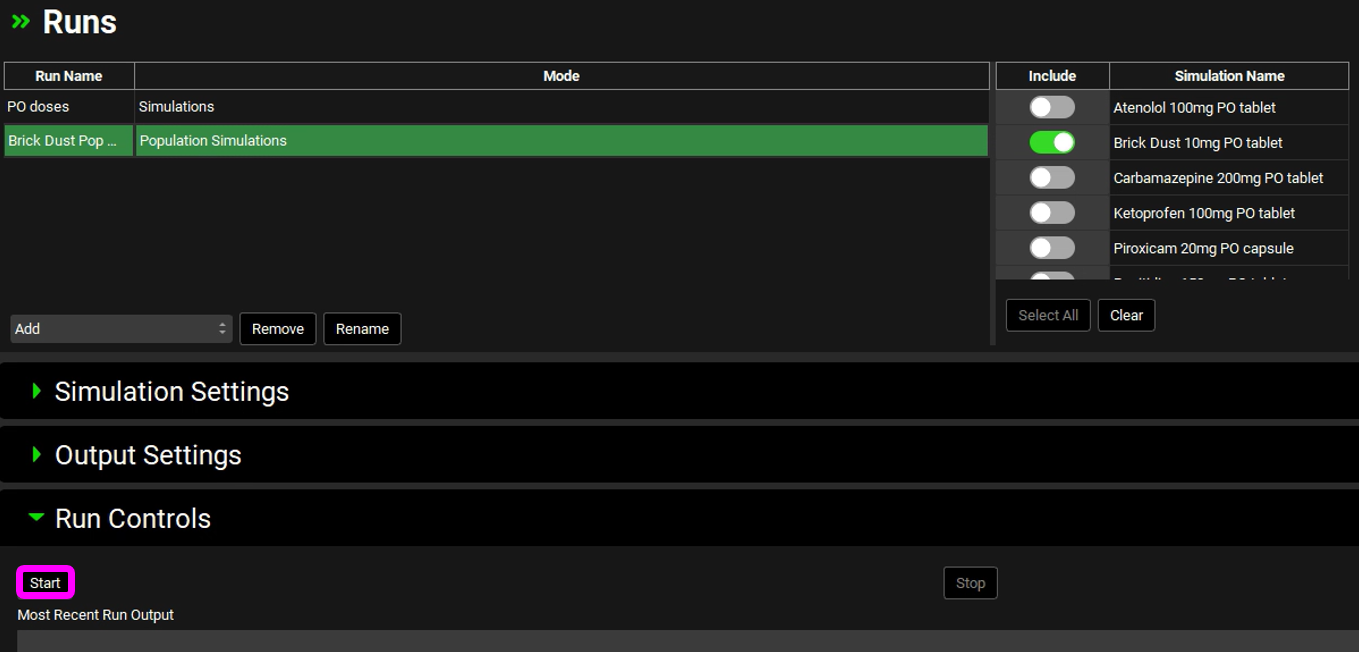
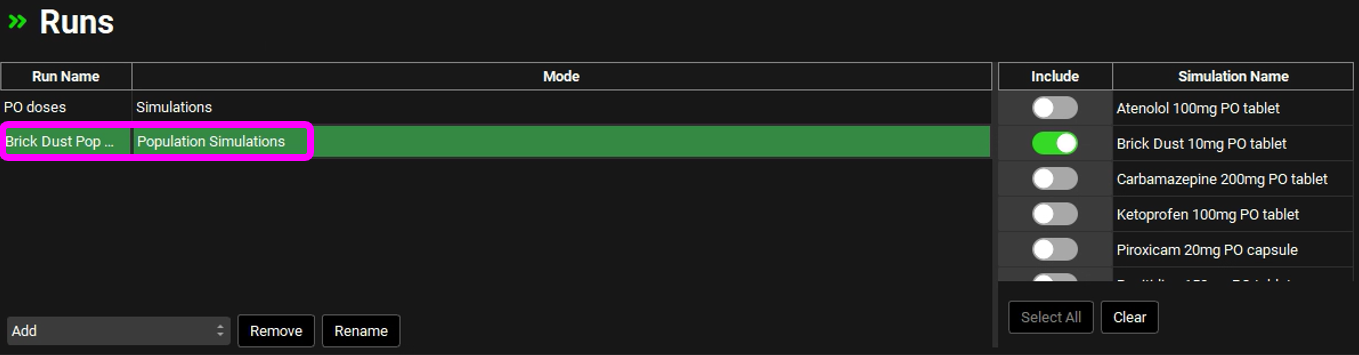
Navigate to the Runs view, click on Add (which is at the bottom of the first column called Run Name), select Population Simulations and name your run (e.g., Brick Dust Pop Sim) and click on OK. A new row will be added to the Runs table with the name you have entered and the Mode as Population Simulations.
Move to the right-hand side and click on the Include Toggle in front of “Brick Dust 10mg PO tablet” Simulation Name.
The Simulation Settings panel will be enabled. At the top of the panel is where you can specify the Species, Ethnicity, Health Status, Population Size, Repeated Trial Size and Population Type (if the simulation has both compartmental pharmacokinetics and PBPK, you can make the selection here). If the baseline simulation is PBPK, the Human PEAR Settings panel will be enabled.
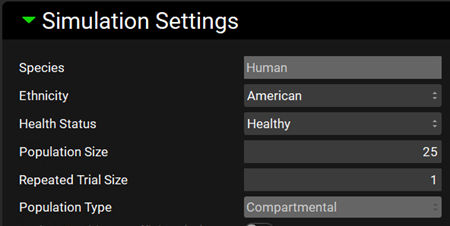
For this tutorial we will leave as default: Species: Human, Ethnicity: American, Health Status: Healthy, Population Size: 25, Repeated Trial Size:1 and Population Type: Compartmental.
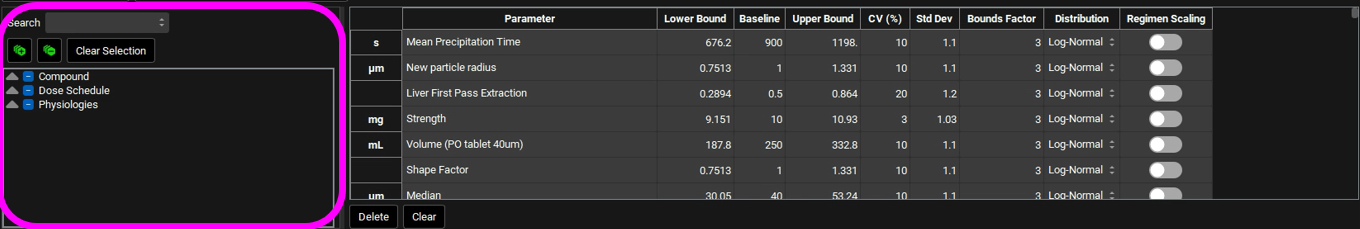
Scroll down to the parameters table wherein the default parameters are selected. Default coefficients of variation and distribution types are also shown. You can use the parameters list on the left-hand side to change the selection of variables by expanding the list or typing the variable name in the Search box.
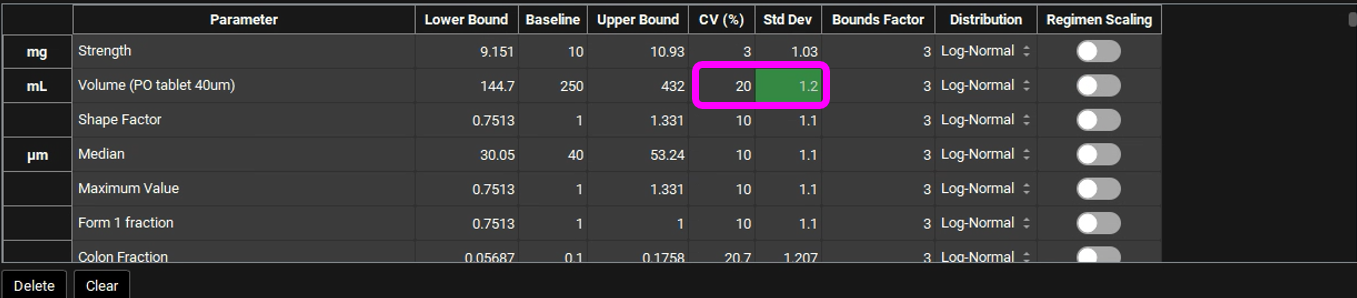
You can change each CV (%) if you wish by directly editing it in the table. Select the type of distribution you want for each variable (Normal, Log-Normal, or Uniform), and enter the CV for that distribution (for Log-Normal, enter the CV of the log of the variable).
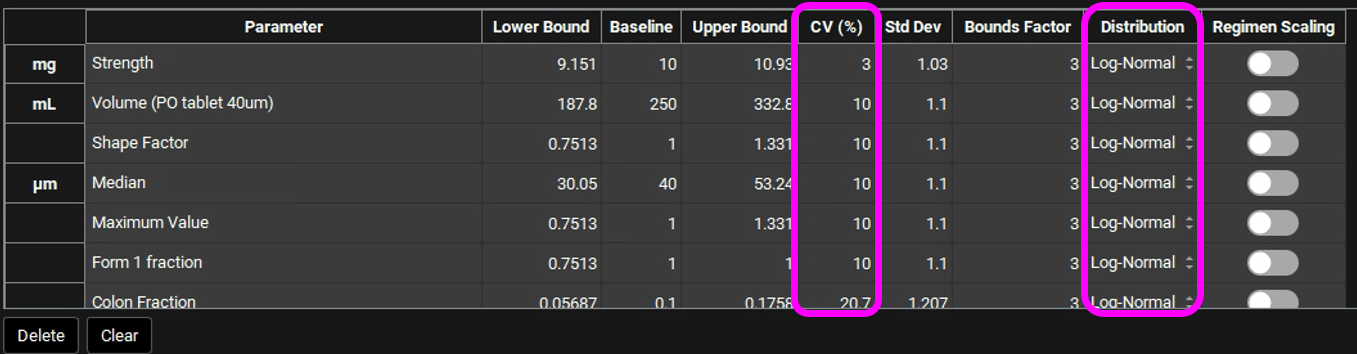
In GPX™ you also have the flexibility of adjusting the standard deviation (Std Dev). For example, you could set the Std Dev to 1.2 to get a CV% of 20% for a Log-Normal distribution.
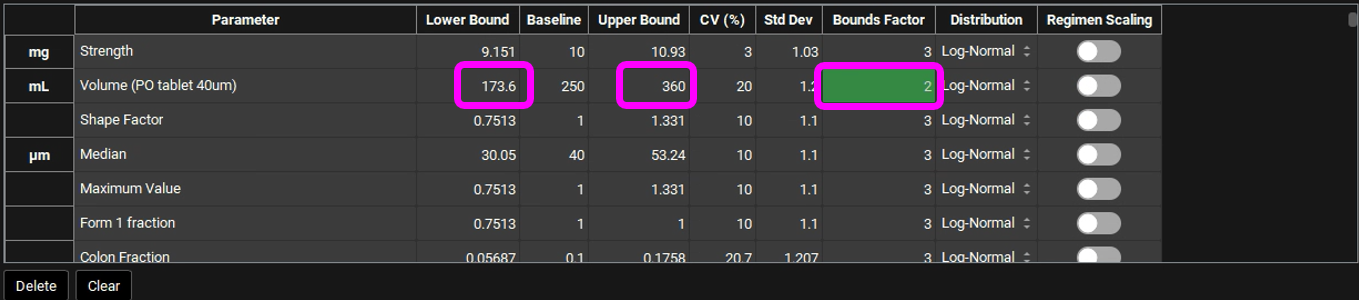
The Bounds Factor defines the constraints for the lower and upper bounds. For example, if the Bounds Factor is 3 (default), that means the lower and upper bound are 3 standard deviations. If you wish to constrain everything to 2 standard deviations, you can set the Bounds Factor to 2 and so on.

Regimen Scaling refers to adjusting gut physiological parameters—such as transit times, intestinal fluid volume, pH values, and bile salt concentrations for each gut section—during the second period of physiology. When more than one physiology is assigned in the physiology schedules, the corresponding toggles will be enabled by default to allow the population simulation to adapt to changes in physiology.
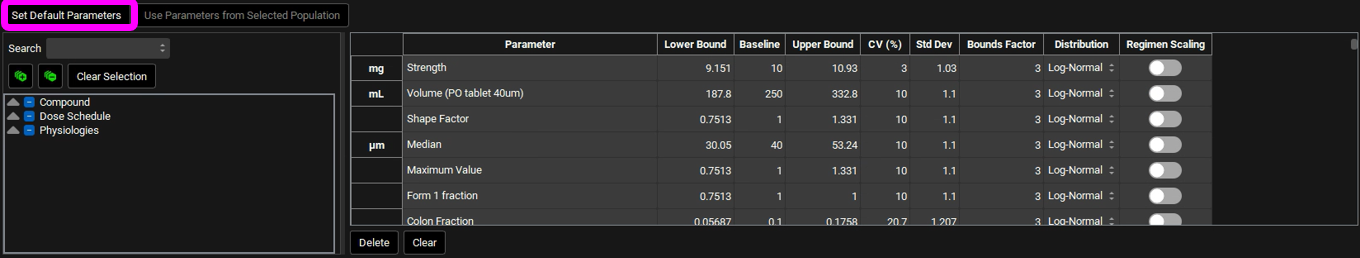
If you have made changes but would like to go back to the default values, you can click on the Set Default Parameters button to restore the selection and values to the default values. In this tutorial we will run a population simulation with all default parameters and CVs. If you have changed the parameters, click on Set Default Parameters before continuing.
If you have made your own set of selections and/or changed the CVs, you can save these settings in the run by saving the project.
Scroll down to the Run Controls panel and click on Start.
The Analysis view will automatically be activated when the Run has completed.
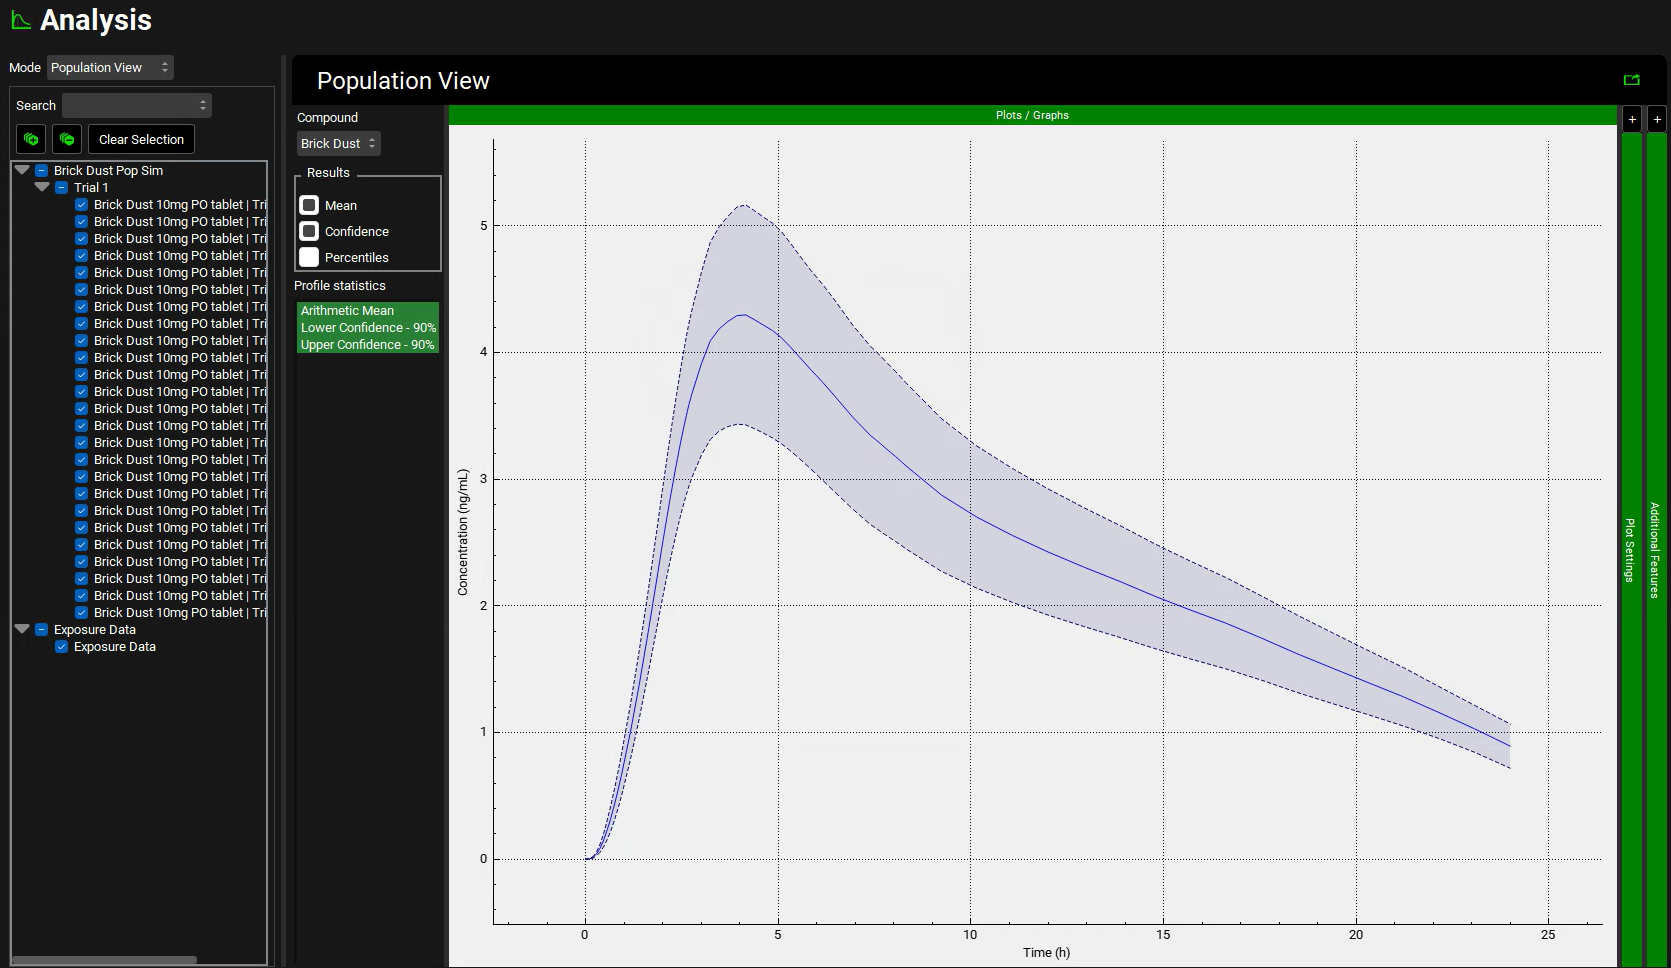
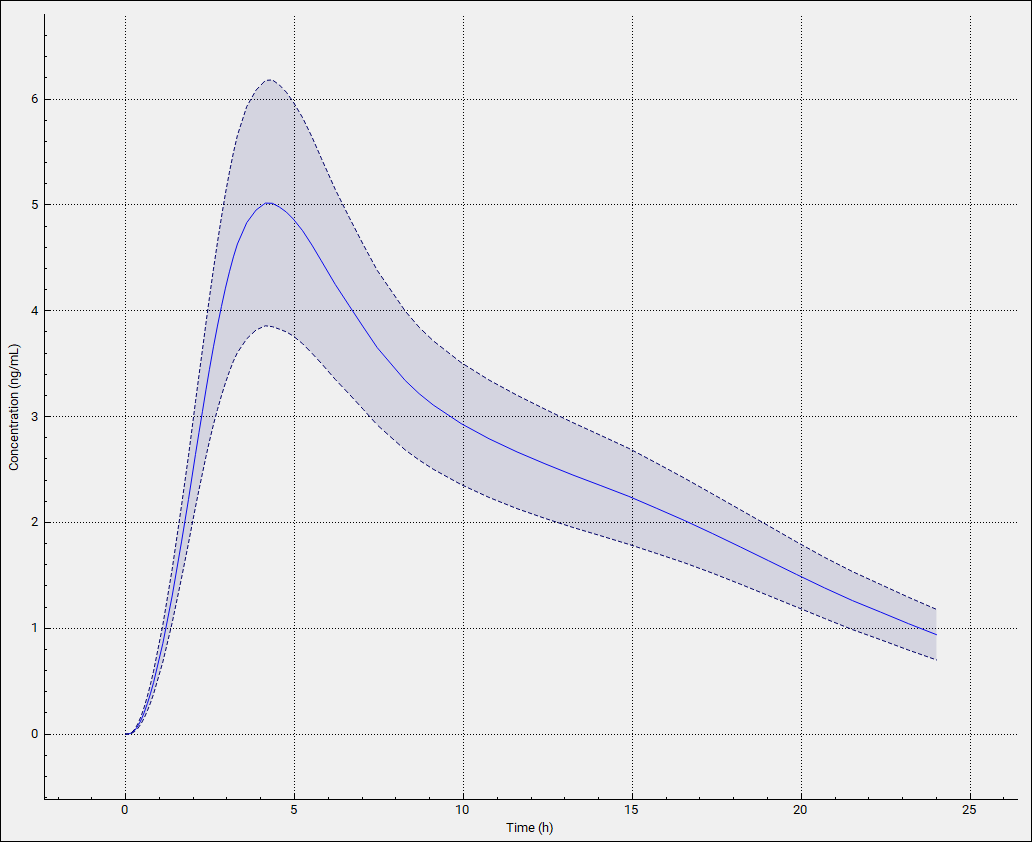
The Population View mode is automatically selected for a population simulation and will display the mean Cp-Time curve (dark blue line) and the 90% confidence interval around it from the population simulation (light blue band).
The light blue band 90% confidence interval will get narrower as the number of subjects is increased.
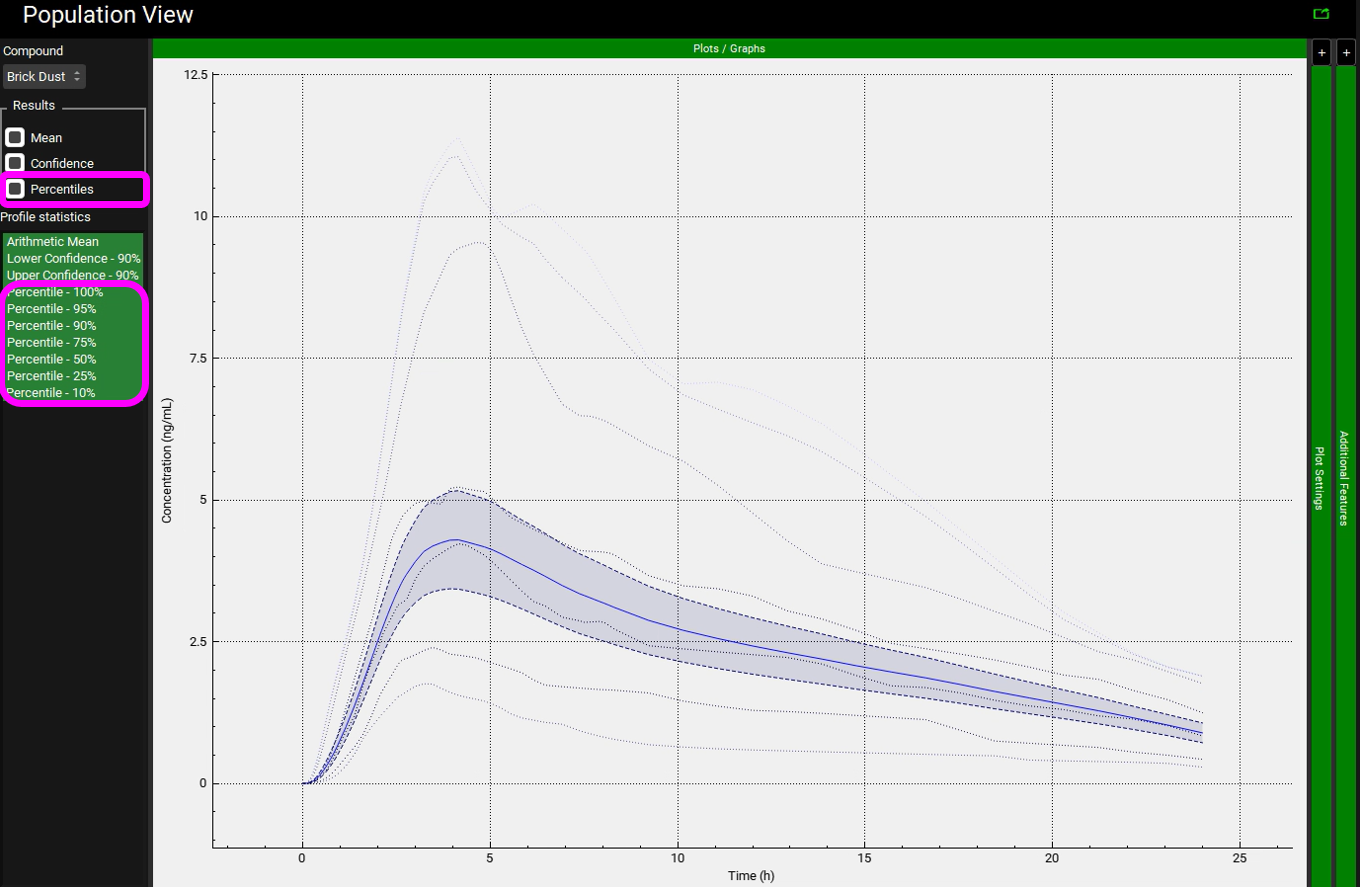
In the Results section under the Population View panel, click on the box next to Percentiles. The percentiles that go from 10% to 100% will appear under Profile statistics. Hold the Ctrl key, select the Percentile 100% and drag the mouse down to select all the other percentiles.
The percentiles reflect the spread of the actual Cp-Time profiles for the virtual population. The 100% percentile represents the highest concentrations at each time point in the virtual population (it does not reflect any particular subject).

Because Population Simulator is based on random samples, your results will most likely be somewhat different than the results shown above.
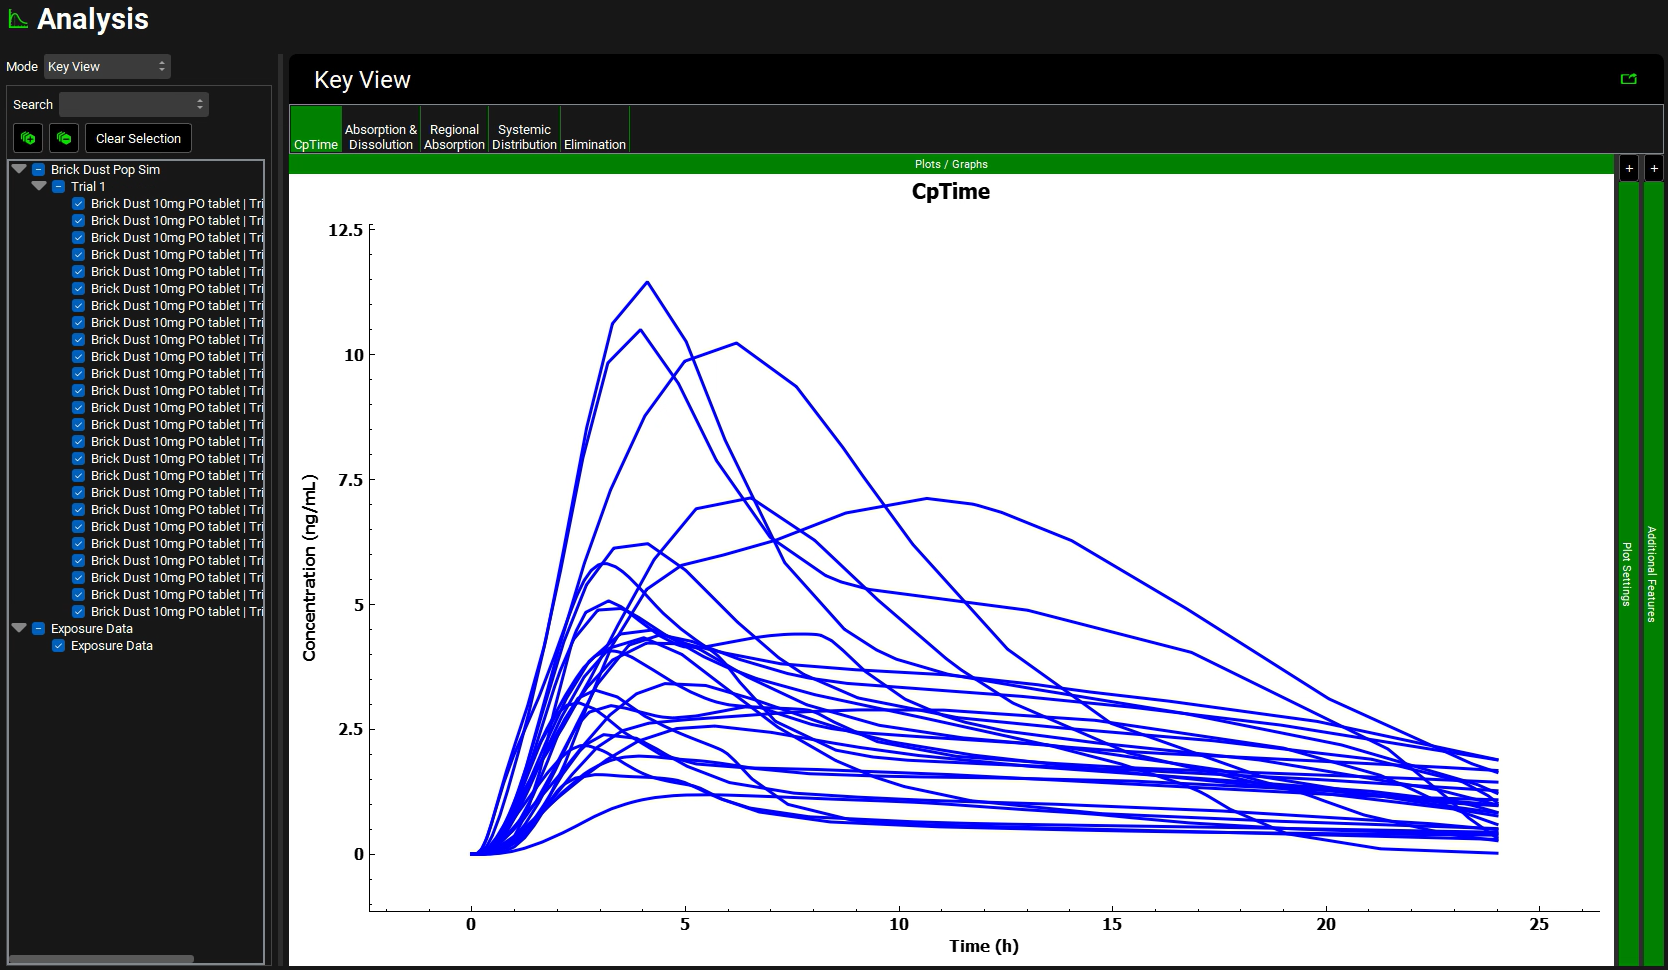
Switch the Mode to Key View and select the Cp-Time plot if it is not already selected.
The Cp-Time profile for each individual is plotted. Click across the Key View ribbon to see the other plots (they will be very busy since all the curves for each subject are plotted).
While on the Cp-Time plot expand the Plot Settings to see the legend. Click on the curve with the highest Cmax on the graph. The legend for that curve will be highlighted, hover over the highlighted legend to see the full name with the trial and subject number.
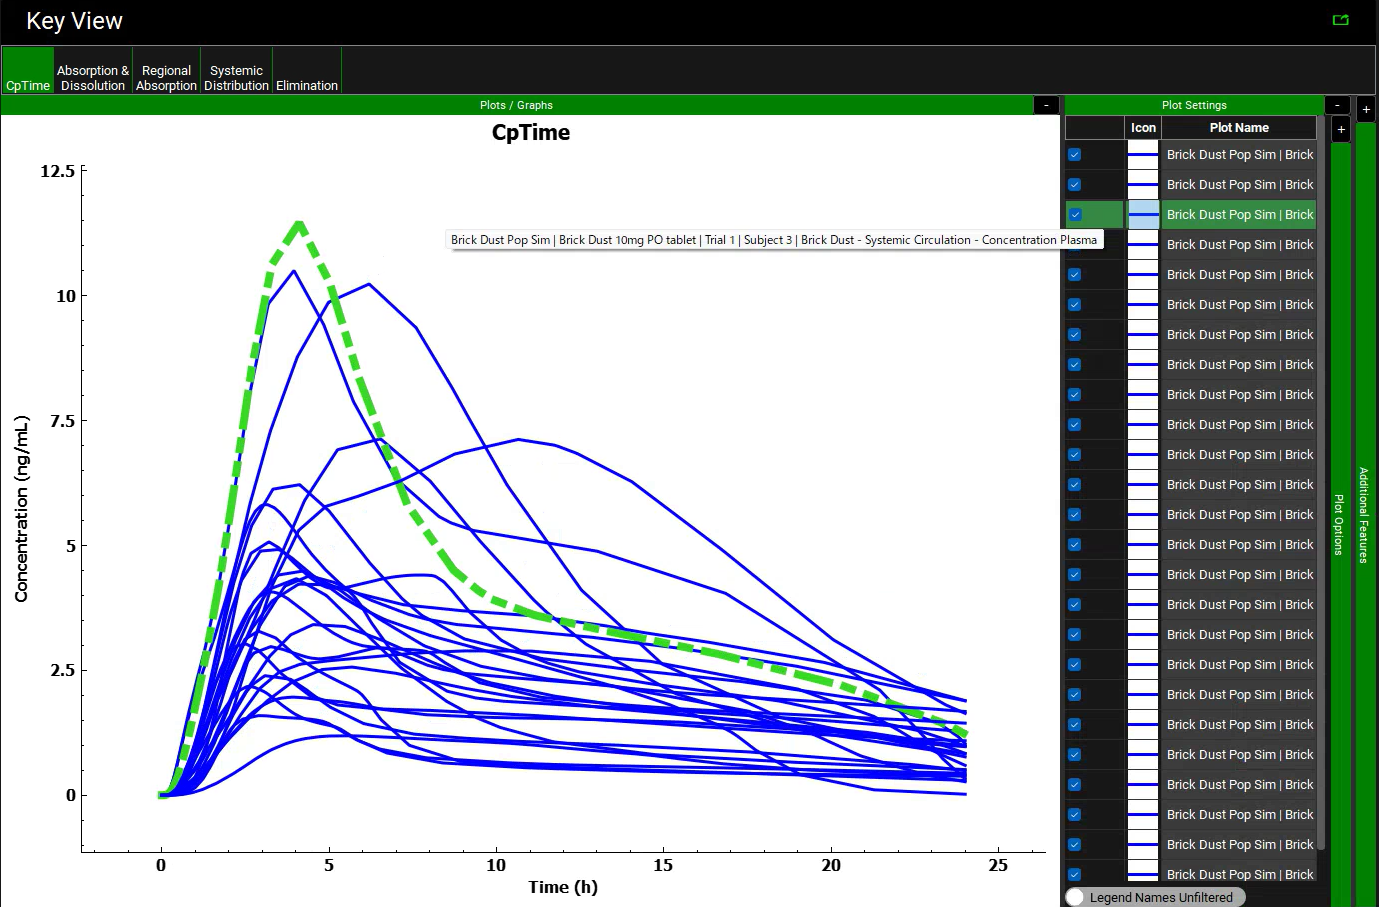

Because Population Simulator is based on random samples, your results will most likely be somewhat different than the results shown above. In this Population Simulation, subject 3 had the highest Cmax.
On the simulation list located left of the Key View panel, unselect all the curves by clicking twice on the box next to Trial 1. Once the selection has been cleared, select the subject that had the highest Cmax (in this population it was Subject 3). You may need to drag the simulation list panel to the right to be able to see the full simulation name.
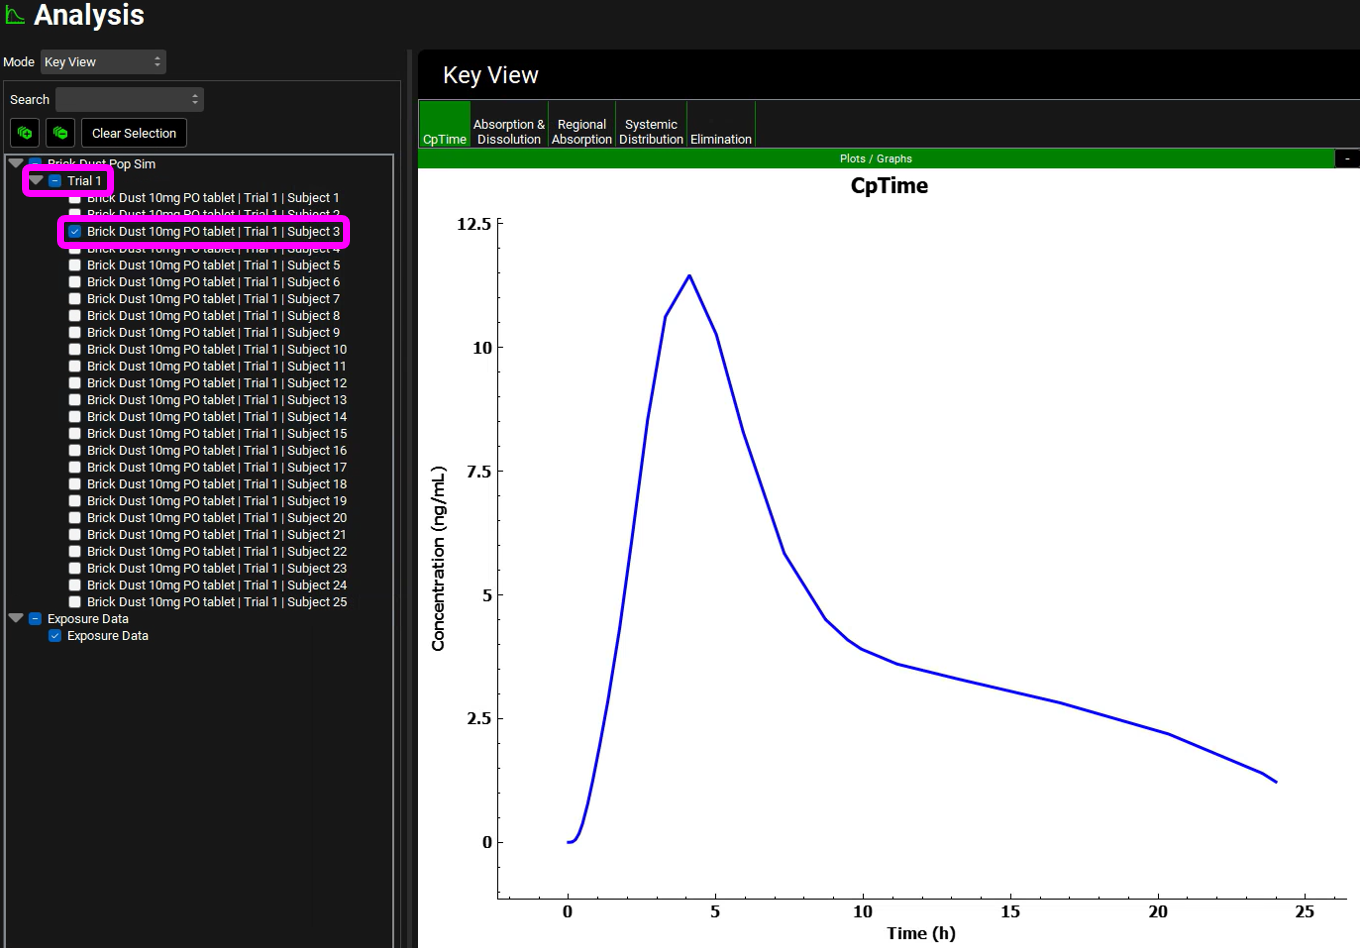
Now each plot in the Key view and Deep View will reflect only Subject 3. Click across the plots in the ribbon and analyze the results.
Click on the check box next to Trial 1 again to reselect all subjects.
Switch the Mode to Summary View, which enables you to compare the Fa, FDp, F, Cmax, Tmax, AUC, Liver Cmax, and CL/F for each subject in this population.
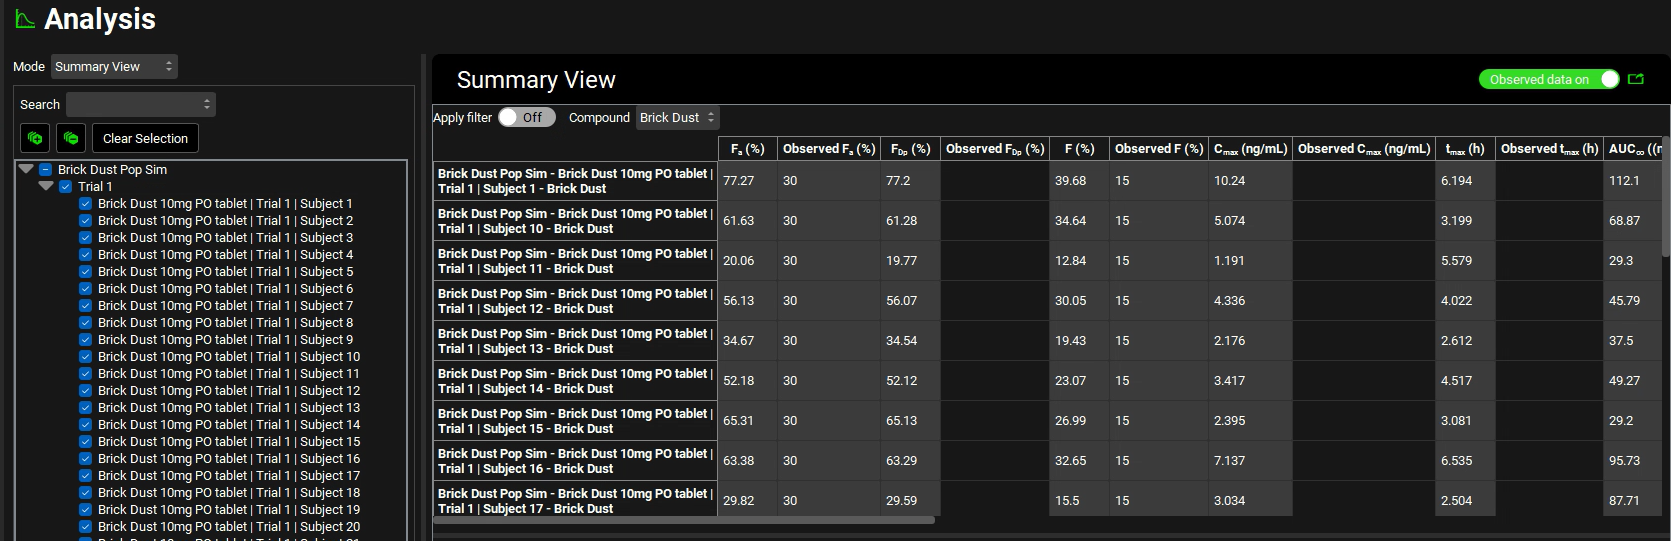
For easier viewing, pop the table out into its own window using the green icon next to the Observed data on toggle.

To pop it back in, click the close button (X) in the top right corner of the window.
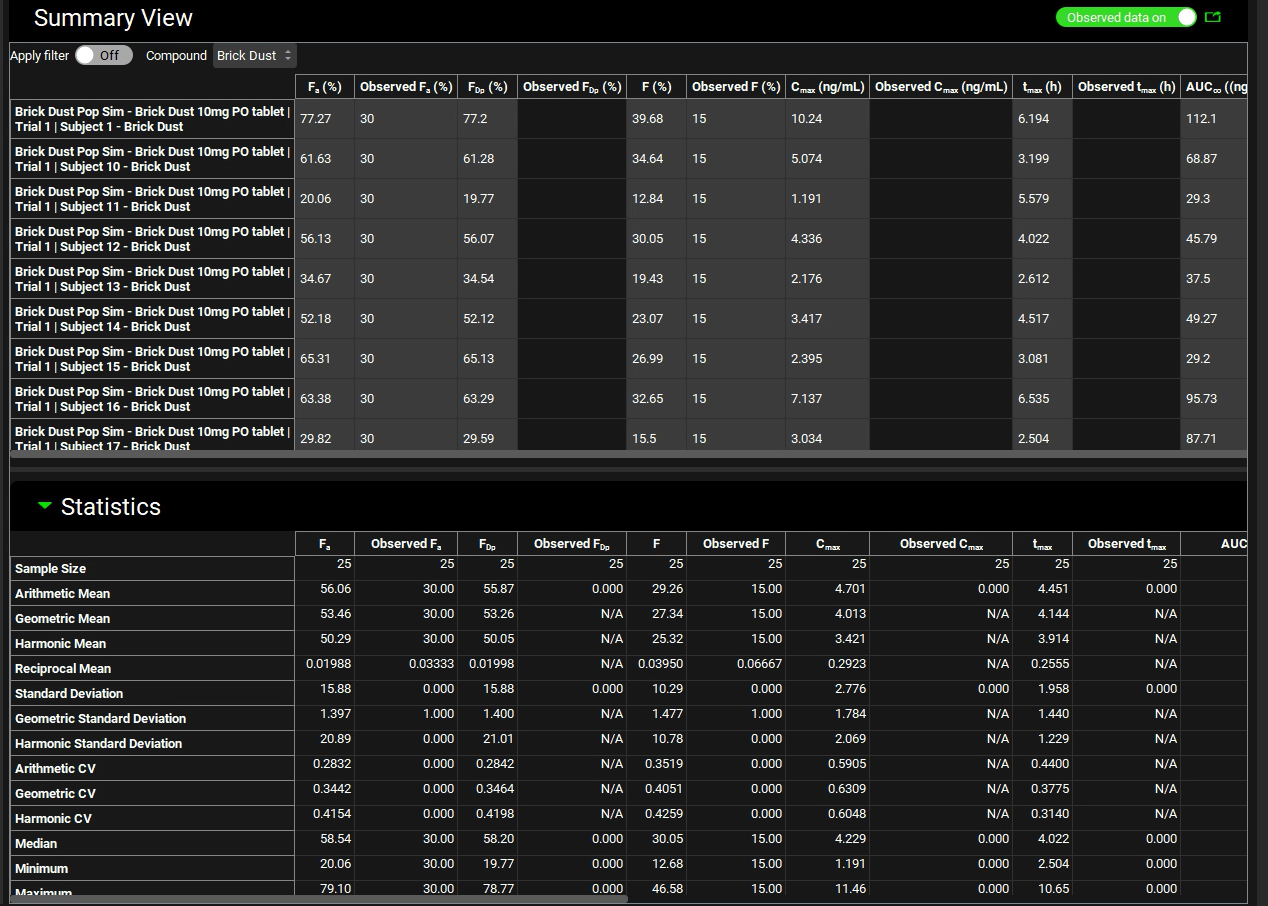
Scroll down to the Statistics panel and expand it by double-clicking the panel header bar or clicking on the green arrow.
You can examine the automatically generated output file that is saved in the population run project folder (Brick Dust 10mg PO tablet iterations trial-1.xlxs) for more details on the individual variable values chosen during the simulation.
Saving Generated Populations
By using Generated Population Settings section, generated populations can be saved and utilized for future Population Simulation within the same Run. This will prevent GastroPlus® generating a new population each time the Run is executed.
Navigate to the Runs View and select Brick Dust Pop Sim which was created in the previous section of this tutorial.
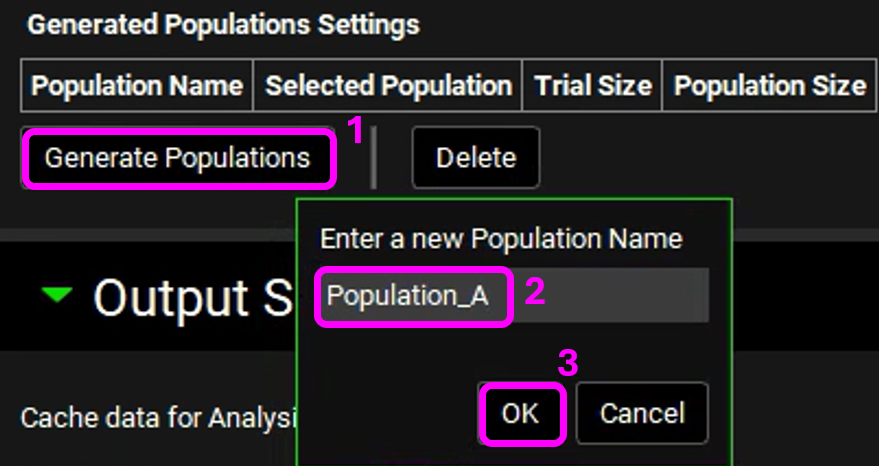
Expand the Simulation Settings Panel and scroll down to Generated Populations Settings. Click on Generate Populations button, type Population_A, and click OK. This will generate a population based on the population settings and parameter statistics given above.
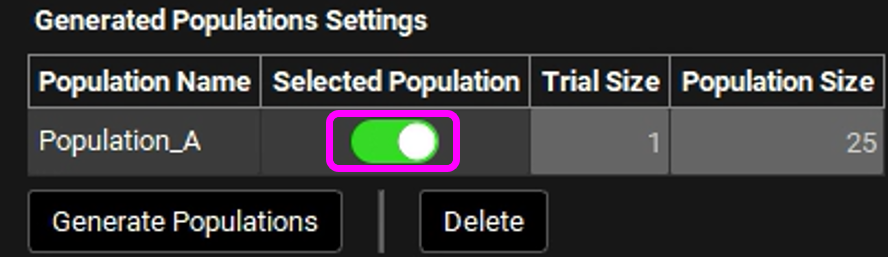
A row for Population_A will be created with respective details. Enable the Selected Population toggle. This will utilize the generated population instead of creating a new one.
Scroll down to Run Controls and click on Start.
The Analysis view will automatically be activated when the Run has completed.
For each execution of Brick Dust Pop Sim with Population_A selected, you will get the same results as the population is not regenerated using random sampling.