
Tutorial: PBPKPlus™ Module
Physiologically Based Pharmacokinetics Module
In this tutorial, we will cover:
IVIVE application
Physiologically Based Pharmacokinetic (PBPK) modeling is a science-based, mechanistic approach that accounts for tissue sizes, perfusion rates, and partitioning of unbound drug into physically relevant compartments. PBPK models can integrate data compiled from in vitro measurements and in silico estimates and make early predictions of the expected plasma and tissue concentration versus time profiles.
This example highlights how PBPK models can be used for interspecies scaling from rat to make an early prediction of the pharmacokinetics in human. The first step is to successfully verify the PBPK model in rat and then translate to human using automatically re-sized tissue volumes and perfusion rates, and the assumption of similar tissue partitioning between species.
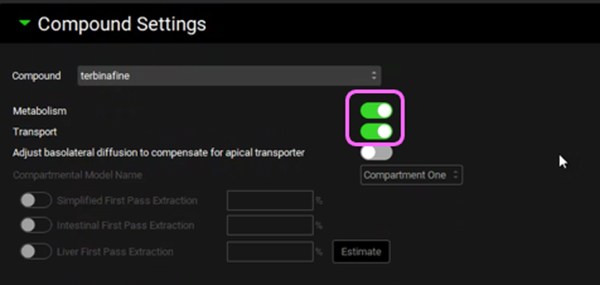
If you do not have a license to Metabolism and Transporter, switch off the toggles for both Metabolism and Transport in the Compound Settings panel in the Simulations view.
Preclinical verification in rat
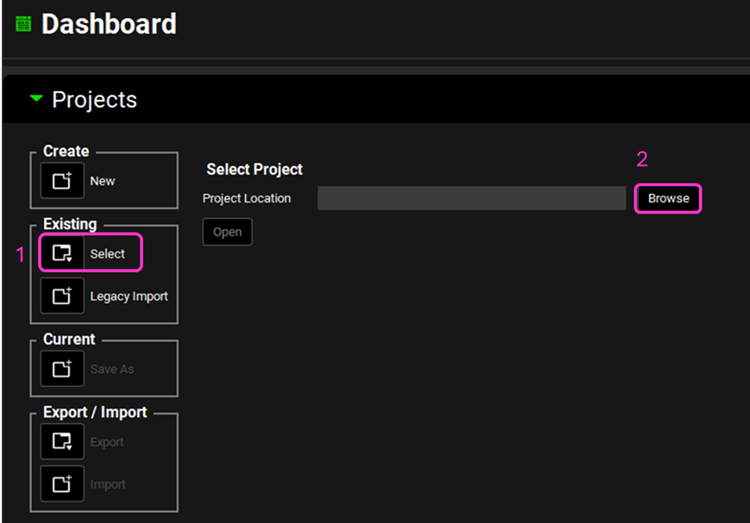
Open GPX™ and, in the Dashboard view, click on the icon next to Select to open an Existing project.
Click Browse and navigate to the C:\Users\<user>\AppData\Local\Simulations Plus, Inc\GastroPlus\10.2\Tutorials\Terbinafine GPX folder and select the project terbinafine.gpproject by clicking on it and clicking open.

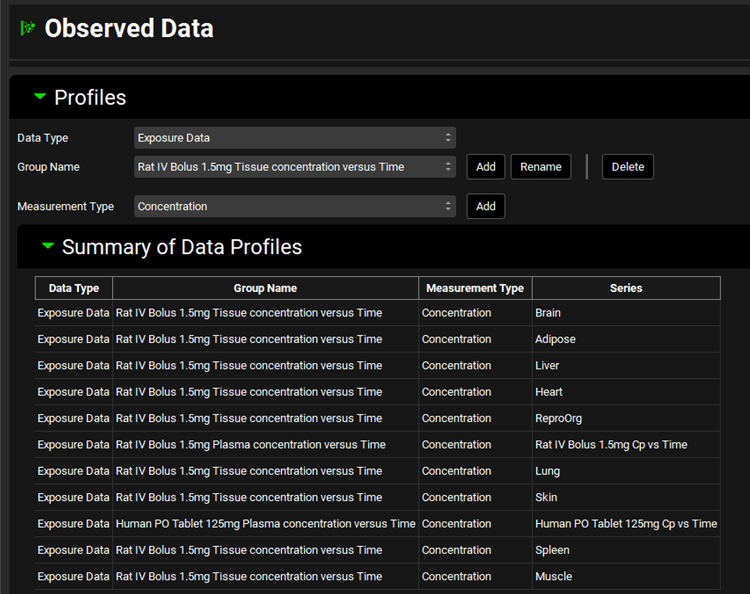
Click on the Observed Data view in the navigation pane and then review the Exposure Data. This project contains Exposure Data series of plasma concentration versus time profiles for rat and human as well as tissue concentration versus time profiles for rat adipose, brain, heart, liver, lung, muscle, reproductive organs, skin, and spleen.
Click on the Compounds view in the navigation pane and review the inputs in each panel for terbinafine. Note that terbinafine is a lipophilic base (logP = 5.78; pKa = 7.504) with low solubility and high permeability.
Click on the Dosing view in the navigation pane and review the two Dosing Schedules, “Rat IV Bolus 1.5mg” and “Human Oral IR Tablet 125mg”.
Click on the Physiologies view in the navigation pane and confirm that there are physiologies for both rat and human. Leave the physiology set to “Rat 0.25kg”.
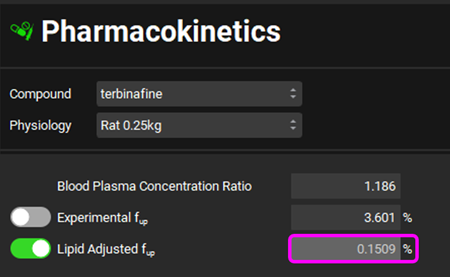
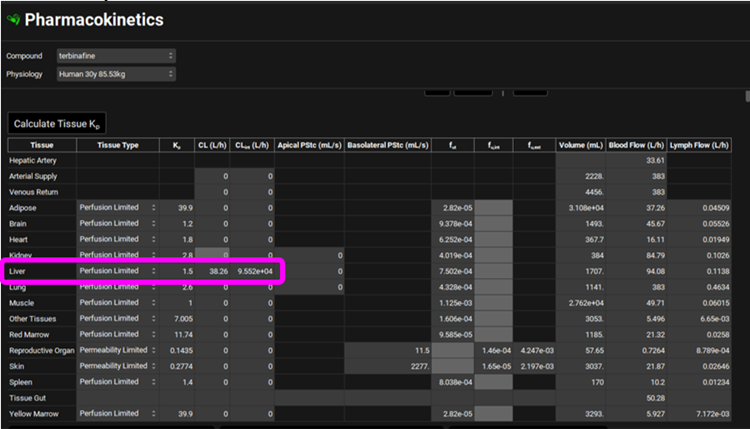
Click on the Pharmacokinetics view in the navigation pane, as you can see from the comparison of the values for Experimental Fup and Lipid Adjusted Fup, the Lipid Adjusted Fup is estimated to be only about 0.15% due to the lipophilic nature of the compound predicting extensive binding to plasma lipids.
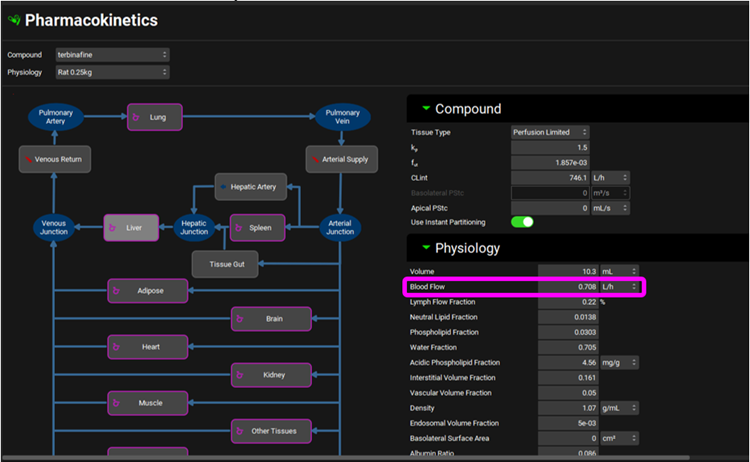
Expand the PBPKPlus™ panel by clicking on the green arrow or double clicking on the panel header bar and review the PBPK model. Scroll down below the PBPK table and expand the Perfusion Limited Tissues sub-panel and check that the Kp Method is set to User Defined as measured values from the Hosseini-Yeganeh & McLachlan article 1 have been entered for all tissues except Red Marrow and Other Tissues. The Kp for the Yellow Marrow was not experimentally measured, but since it is a fatty tissue, we will approximate it with the value of the Adipose Kp.
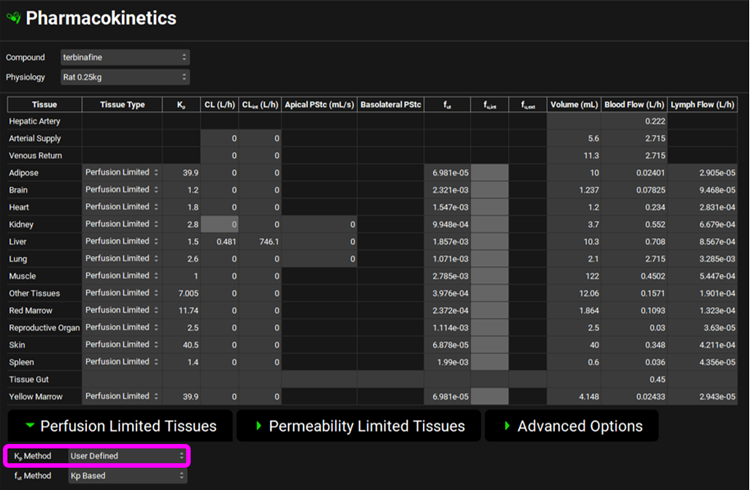
Hosseini-Yeganeh 1 also measured hepatic extraction ratio (ER) to be 0.68 which was converted to systemic clearance as “CL= Q x ER”. Q represents Liver blood flow in L/h and if you click on the Liver tissue in the PBPK diagram you will see the liver blood flow of 0.708 L/h displayed in the Physiology sub-panel on the right-hand side. The calculated systemic clearance as CL = 0.708 L/h * 0.68 = 0.481 L/h has been entered in the PBPK summary table.
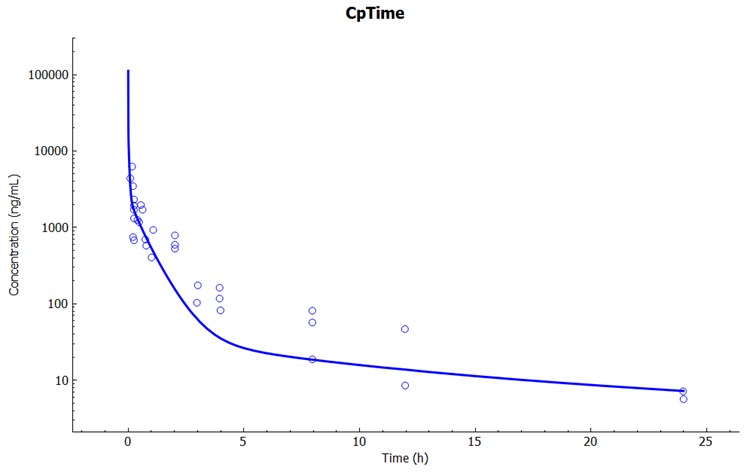
Click on the Simulations view in the navigation pane and then click on Run Simulation for “terbinafine Rat IV Bolus perfusion-limited PBPK”.
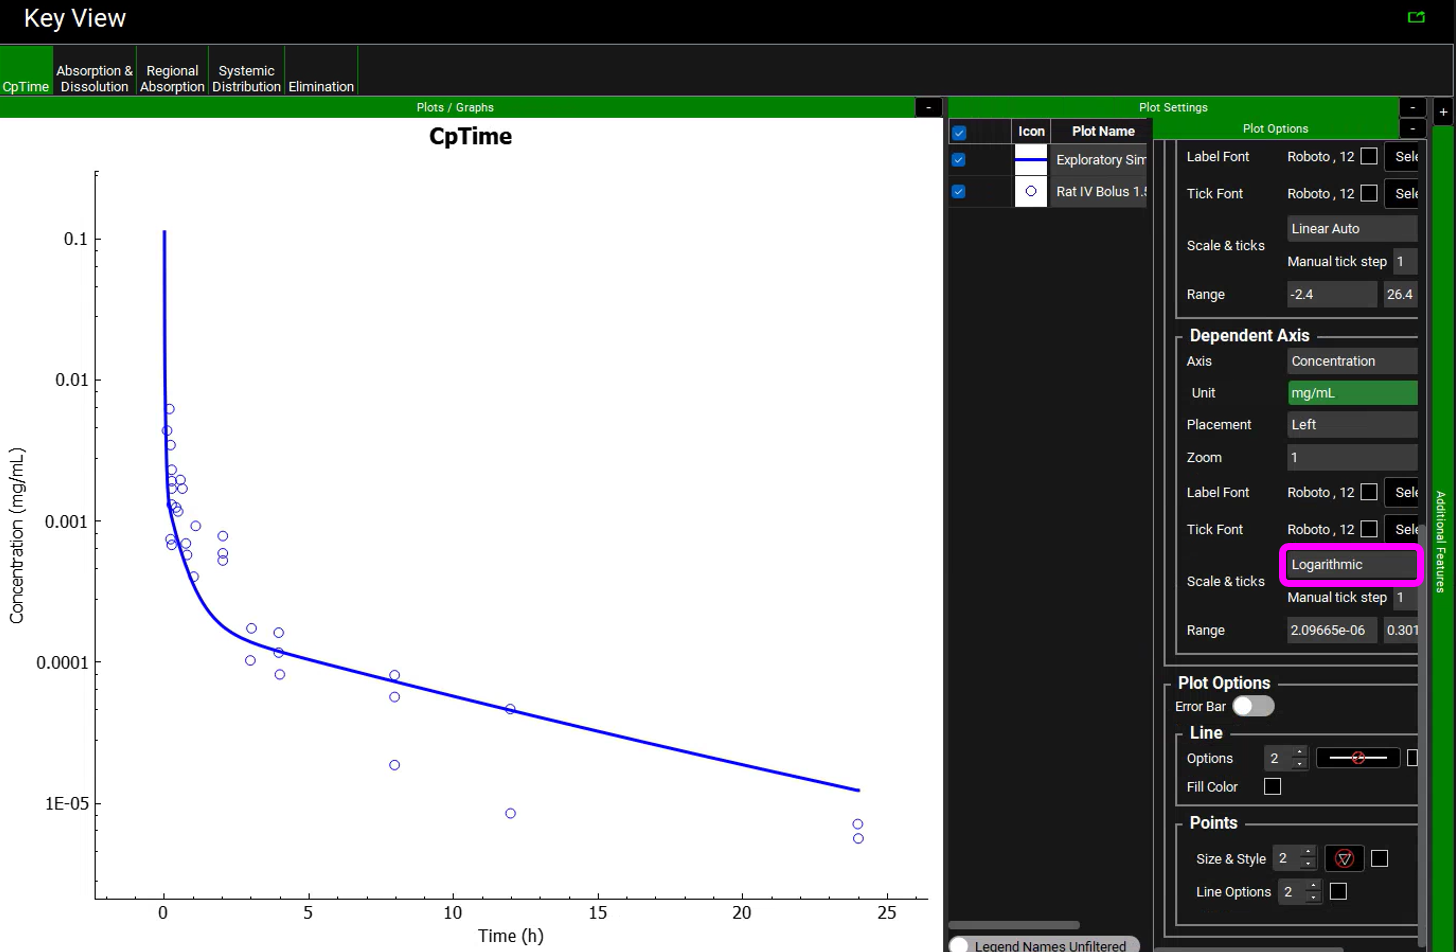
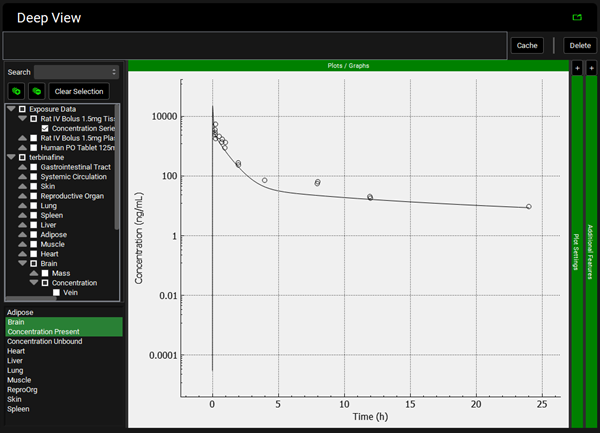
In the Key View set the Concentration axis to be Log for the Cp-Time plot. The Plot Options are opened by clicking on the two “+” icons. See that the simulated plasma concentration profile is similar to the experimental results until about 4 h.
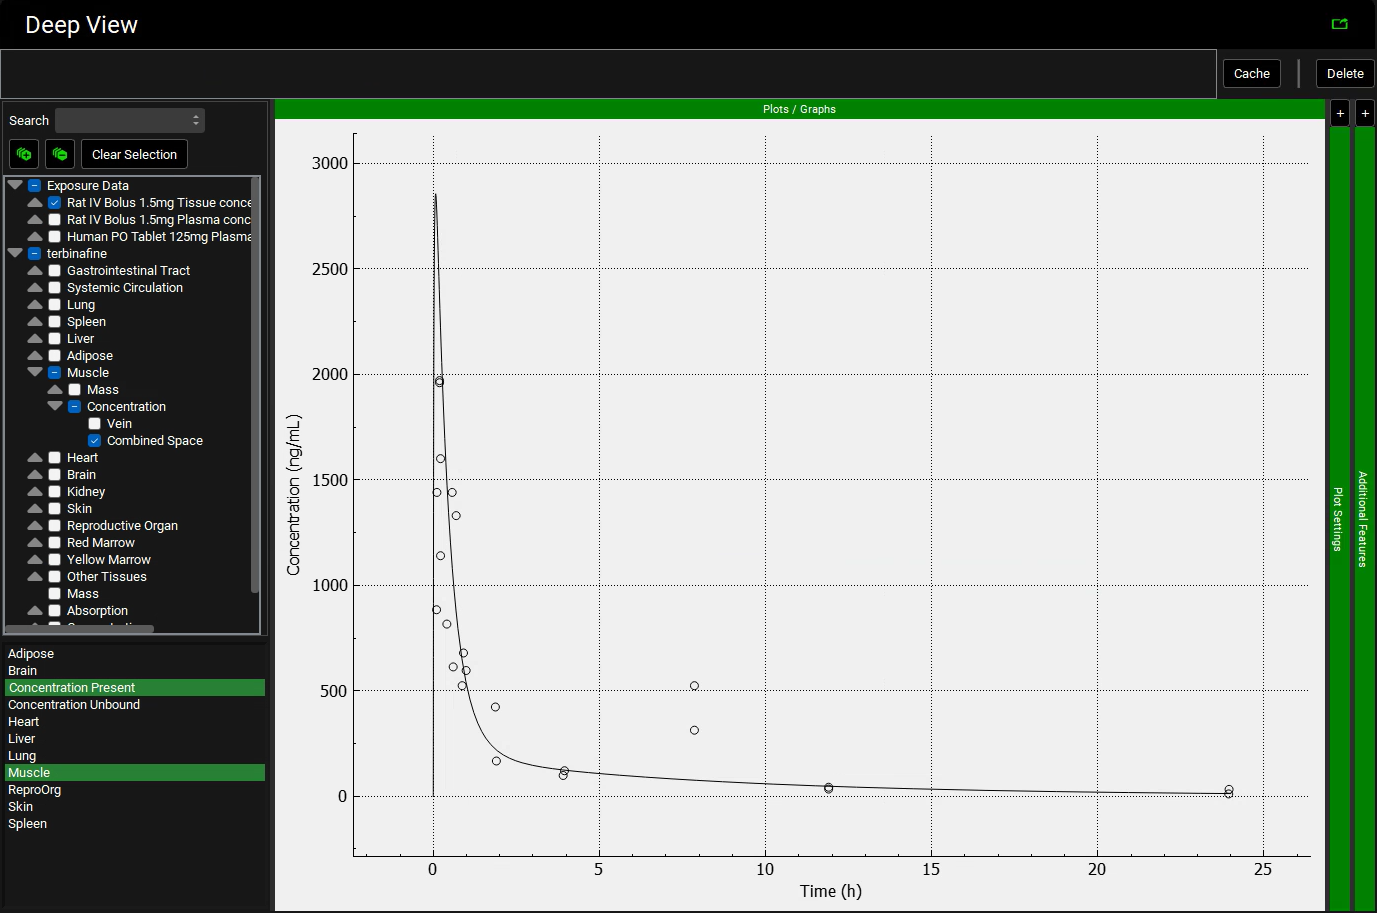
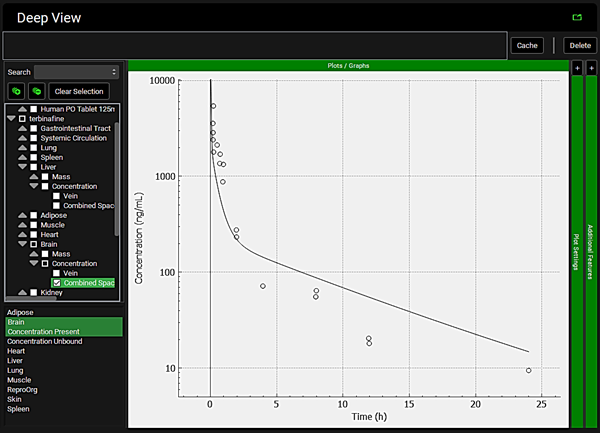
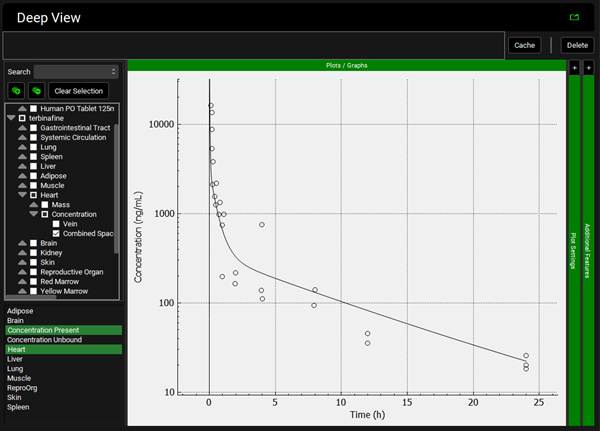
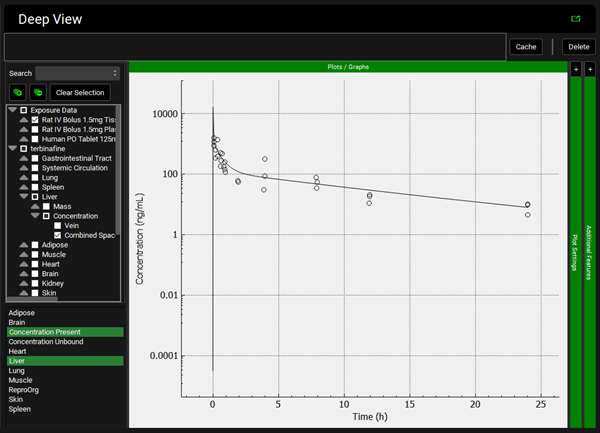
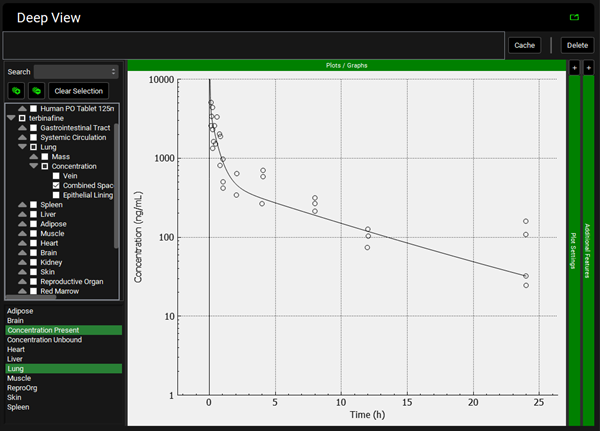
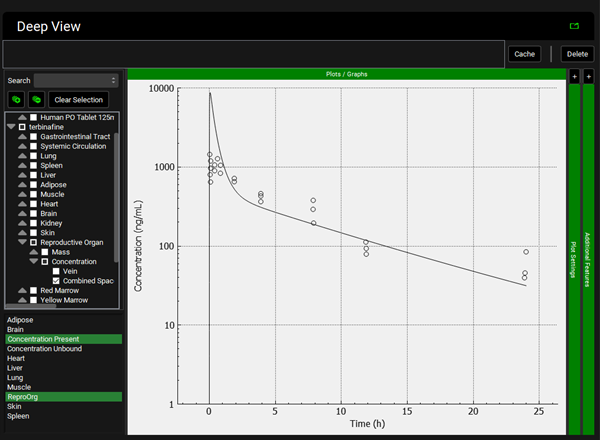
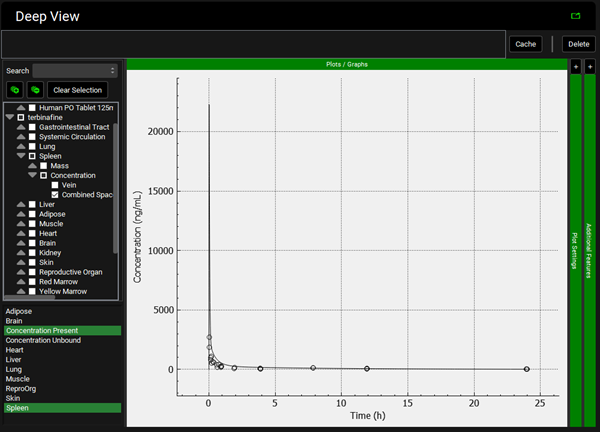
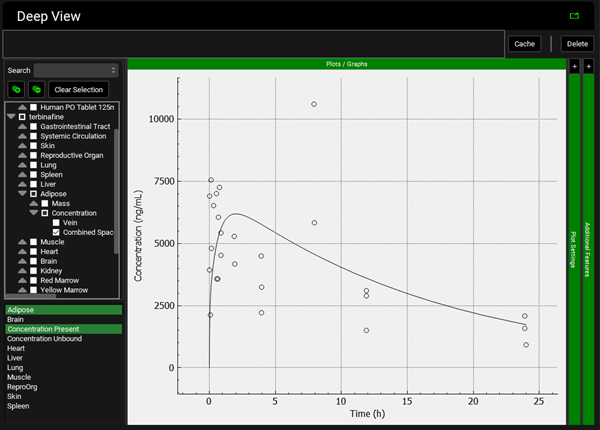
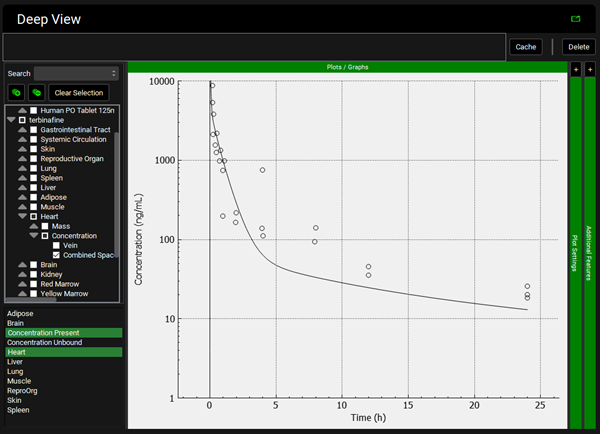
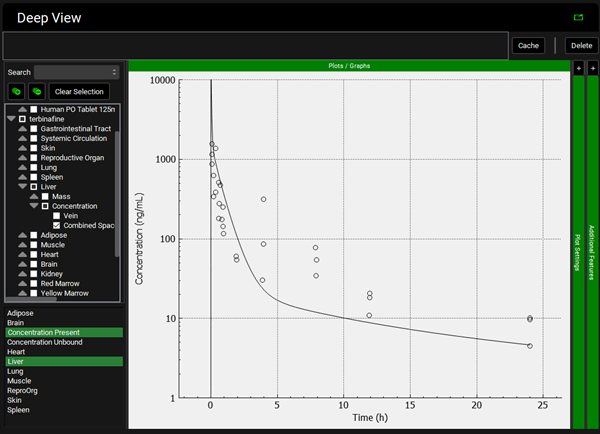
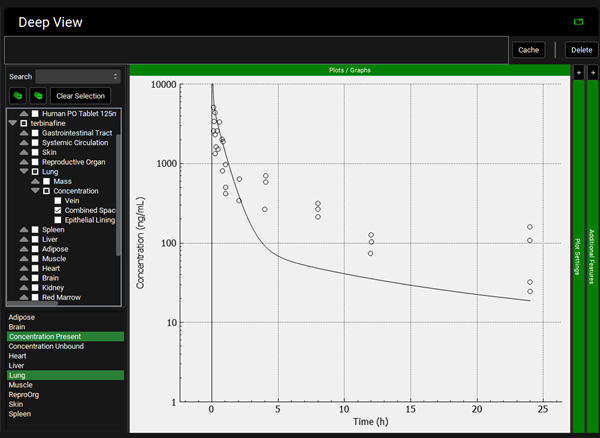
To view the simulated data for the tissues, select the Mode called Deep View in Analysis. Select the Exposure group “Rat IV Bolus 1.5mg Tissue concentration versus Time” as the experimental measured data and Concentration > Combined Space as the predicted data for the tissue of interest e.g., Muscle. In the lower list select ‘Muscle” and hold down Ctrl while selecting “Concentration Present”. Via Plot Options you can format the plot as you desire.
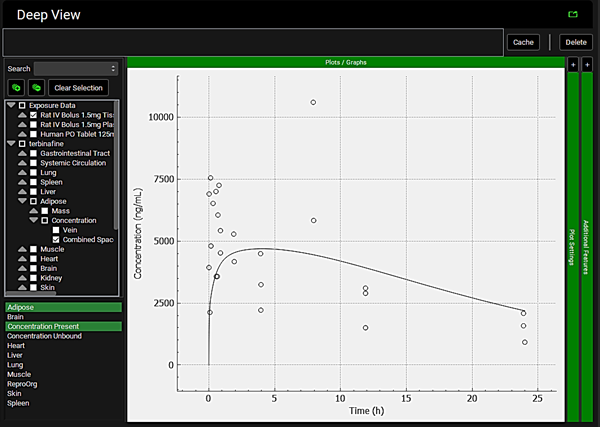
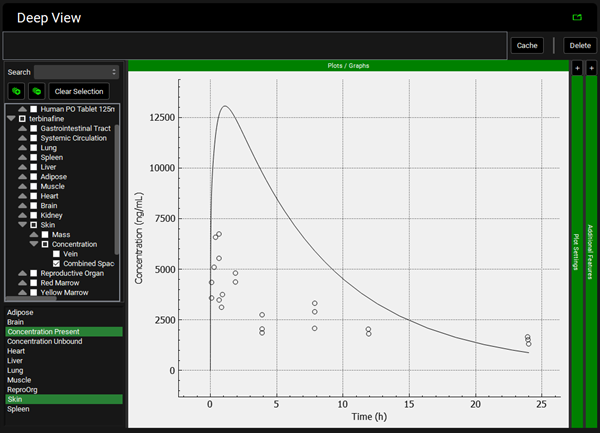
Repeat step 12 for the other tissues. You can see that even though in general there is a good match between experimental and simulated data, the simulated curves for Skin and Reproductive Organ overestimate the experimental concentrations in the first few hours. This indicates that the perfusion-limited model allows drug to partition into these tissues too quickly. From the data measured, the authors noted that the Skin and Reproductive Organ compartments would be better represented by a permeability-limited model.
Adipose
Brain
Heart
Liver
Lung
Reproductive Organ
Skin
Spleen
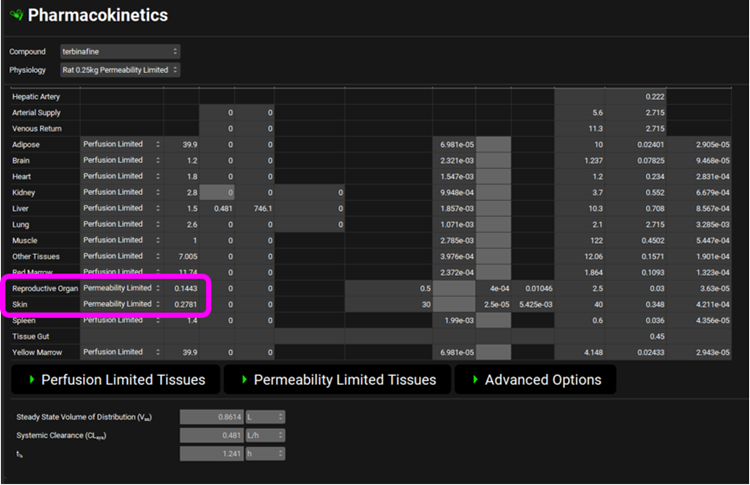
To improve the concentration prediction in Skin and Reproductive Organ, the different tissue model type will be explored. Click on the Physiologies view in the navigation pane and select the physiology “Rat 0.25kg Permeability Limited”.
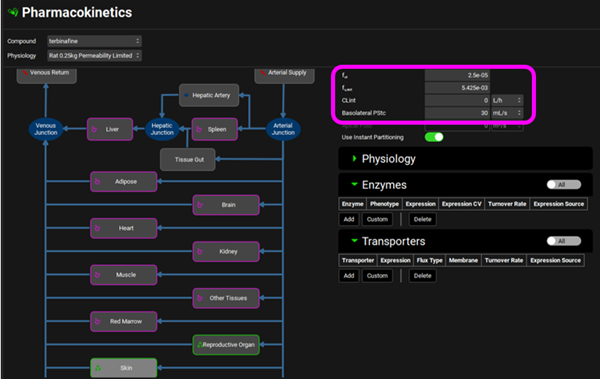
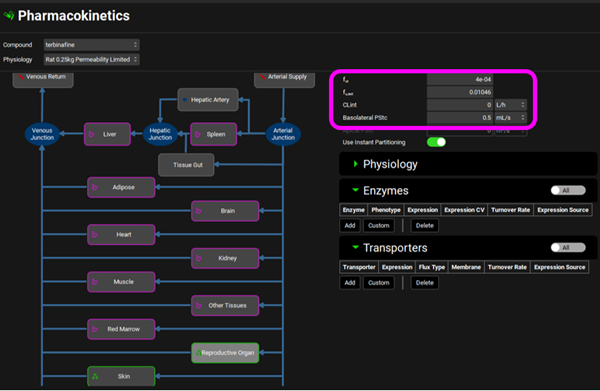
Click on the Pharmacokinetics view in the navigation pane and expand the PBPKPlus™ panel. Notice that the Skin and Reproductive Organ compartments have been set to Permeability Limited as they have a green border and a different tissue icon, the tissue type was switched via the menu obtained with a right mouse click. In the Compound sub-panel on the right-hand side there is a Basolateral PStc of 30 mL/s for the Skin and 0.5 mL/s for the Reproductive Organ. This is the permeability-surface area product, a parameter which determines the diffusion rate of drug across the cellular membrane separating the extracellular and intracellular tissue spaces. Since Skin is the target organ for terbinafine, we can expect a stronger binding to target proteins (rather than just albumin) and the fraction unbound in tissue may be lower than would be expected for non-target tissues. The fut for Skin is 2.5e-05 and for Reproductive Organ is 4e-04. These are previously fitted values.
Skin
Reproductive Organ
As the Skin and Reproductive Organ are now permeability-limited the Kp values are a measure of the drug’s partitioning between plasma and extracellular space in the tissue (unlike the perfusion-limited tissues where the Kp is a measure of drug partitioning between plasma and the whole tissue). The calculated values should be 0.2781 for Skin and 0.1443 for Reproductive Organ.
Click on the Simulations view in the navigation pane and select the simulation “terbinafine Rat IV Bolus permeability-limited PBPK”. Check the Physiology Schedule is “Rat 0.25kg Permeability Limited Schedule”. Click on Run Simulation. Notice the better fit to the shape of the plasma (venous) Cp-Time data with this model in the Key View Cp-Time plot.
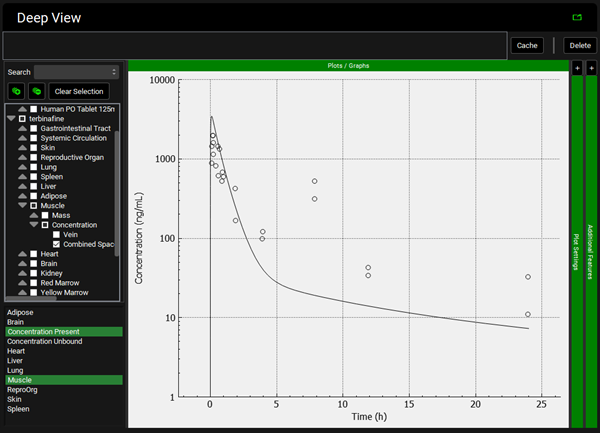
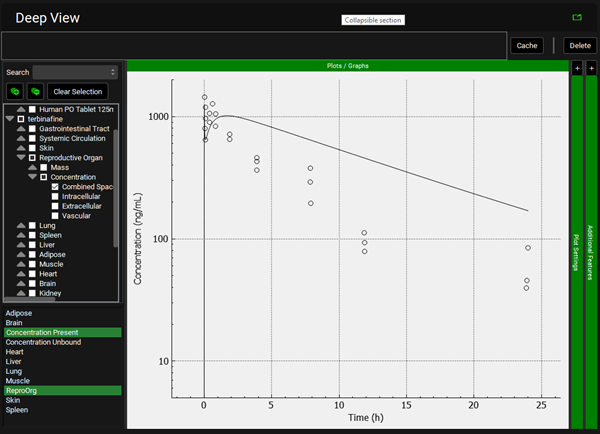
To view the simulated data for the tissues, select the Mode called Deep View in Analysis. Plot Concentration Present and Exposure Data for each tissue. Notice the differences in the simulated profiles for the Skin and Reproductive Organ concentrations with the permeability-limited model.
Adipose
Brain
Heart
Liver
Lung
Muscle
Reproductive Organ
Skin

Spleen

Translation to Human
Click on the Physiologies view in the navigation pane. Select the physiology “Human 30y 85.53kg” to explore its physiological parameters.
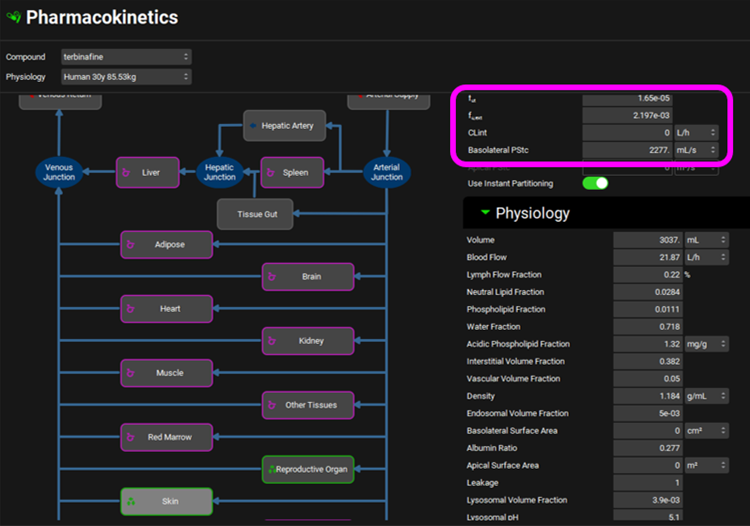
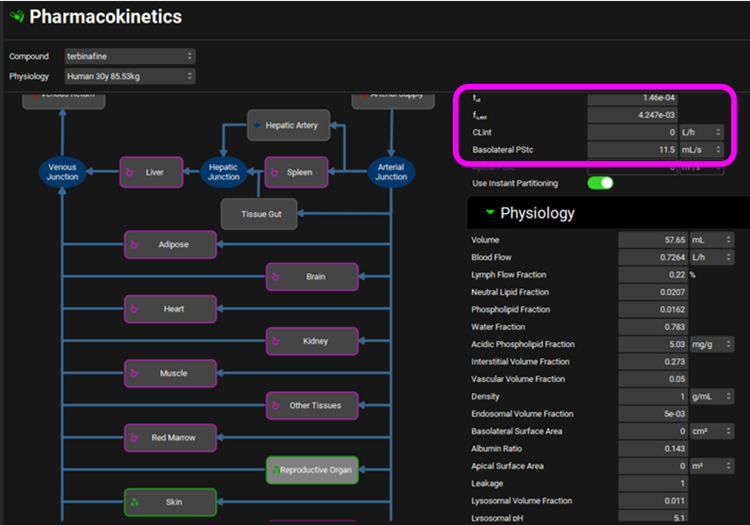
Click on the Pharmacokinetics view in the navigation pane and in the PBPKPlus™ Panel check that the Kp values are the same as for the rat. Check that the Skin and Reproductive Organ are permeability-limited tissues. The Skin calculated Kp should be 0.2774 and Reproductive Organ should be 0.1435.
To scale rat PStc values to human, we use the ratio of tissue volumes as an approximation. For Skin, the volume ratio is 3037/40 = 75.9, and for Reproductive Organ, the volume ratio is 57.65/2.5 = 23. These ratios were used to multiply the respective rat PStc values to obtain the human values. For human Skin PStc = 75.9*30 = 2277 and Reproductive Organ PStc = 23*0.5 = 11.5.
For rat, the values for both PStc and fraction unbound in Skin and Reproductive Organ tissues were fitted. Because we have no human data, we will estimate the fraction unbound in human tissues by scaling the default (calculated) fractions unbound in the same ratio as the optimized rat values to the default rat values. The default (calculated) intracellular fut in rat skin was 1.36e-4 and the optimized value was 2.5e-05 which is only 18% of the default value. The default (calculated) intracellular fut in human skin was 9.182e-5, so 18% of that is 1.65e-5. The optimized fut in rat of 4e-04 for Reproductive Organ is 2.4-times higher than the than the default (calculated) fut of 1.698e-4 so we increased the fut in human Reproductive Organ of 6.078e-5 by the same ratio to 1.46e-4 for fut.
Skin
Reproductive Organ
Using the ¾ power law and assuming 0.25 kg and 85.53 kg for rat and human body weights, respectively, the 0.481 L/h systemic clearance in rat can be converted into 38.26 L/h systemic clearance in human. Observe this value for the Liver CL in the PBPK summary table.
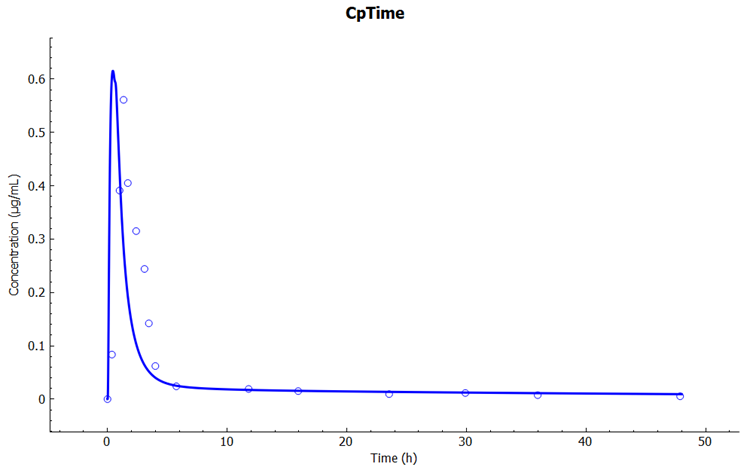
Click on the Simulations view in the navigation pane and select the simulation "terbinafine Human PO Tablet 125mg permeability-limited PBPK". Check the Dose Schedule is “Human Oral IR Tablet 125mg” and the Physiology Schedule is “Human 30y 85.53kg Schedule”. Click on Run Simulation. Notice the adequate fit to the shape of the plasma (venous) Cp-Time data with this model in the Key View Cp-Time plot.
Pregnancy
Physiologically Based Pharmacokinetic (PBPK) modeling enables the translation between populations. This example describes how to predict the pharmacokinetics for pregnant subjects after the PBPK model for healthy subjects has been verified.
Cefuroxime is completely cleared via the kidneys as unchanged drug through glomerular filtration and tubular secretion. Tubular secretion will be modeled via transporters with OAT3 influx on the basolateral membrane and MRP4 efflux on the apical membrane of the kidney.
Verification of the PBPK model for healthy subjects
Open GPX™ and, in the Dashboard view, click on the icon next to Select to open an Existing project.
Click Browse and navigate to the C:\Users\<user>\AppData\Local\Simulations Plus, Inc\GastroPlus\10.2\Tutorials\Cefuroxime GPX folder and select the project cefuroxime.gpproject by clicking on it and clicking Open.
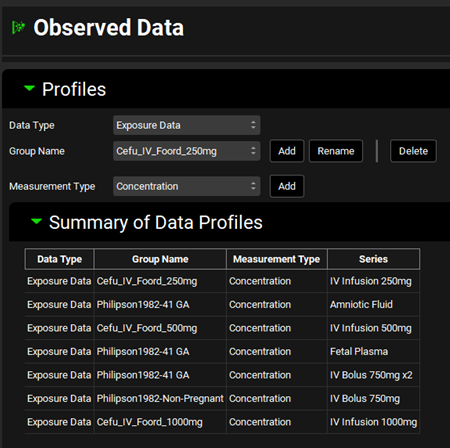
Click on the Observed Data view in the navigation pane and then review the Exposure Data. This project contains Exposure Data series for five plasma concentration versus time profiles, with additional data for Fetal Plasma and Amniotic Fluid for pregnant subjects.
Click on the Compounds view in the navigation pane and review the input data in each panel for cefuroxime. Note that cefuroxime is a hydrophilic acid with high solubility and good permeability. Review the Transporter Kinetics panel to see that MRP4 and OAT3 are present. Due to the lack of current literature data for the affinity of cefuroxime to these transporters, the Km values were set to be in the range of similar substrates and also to prevent saturation of the MPR4 efflux. The Vmax values were fitted simultaneously across all three dose levels included in the project, from 0.25 g to 1 g IV infusion administrations.
Click on the Dosing view in the navigation pane and review the five dosing schedules.
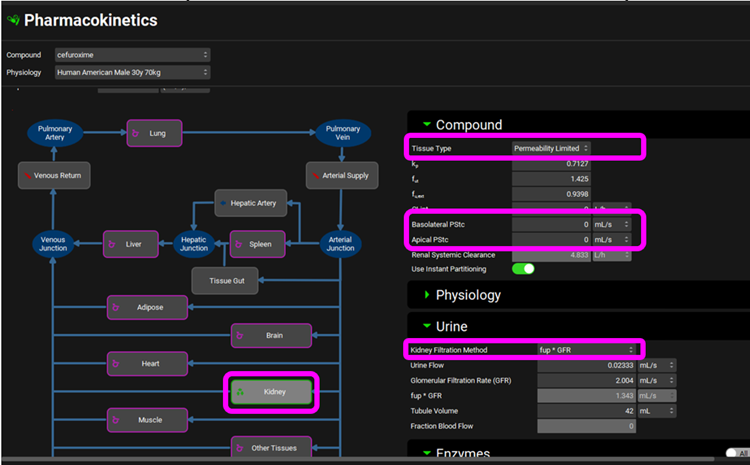
Click on the Physiologies view in the navigation pane and confirm that there are three human physiologies. Select the physiology “Human American Male 30y 70kg”.
Click on the Pharmacokinetics view in the navigation pane and open the PBPKPlus™ panel by clicking on the green arrow or double clicking on the panel header bar and review the PBPK model. Click on the Kidney and notice that it is a Permeability Limited tissue with no passive PStc, and that clearance is set to Fup * GFR in the Urine sub-panel.
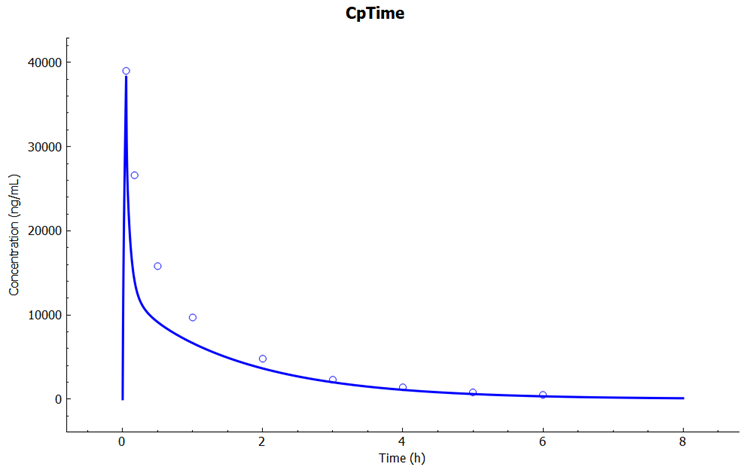
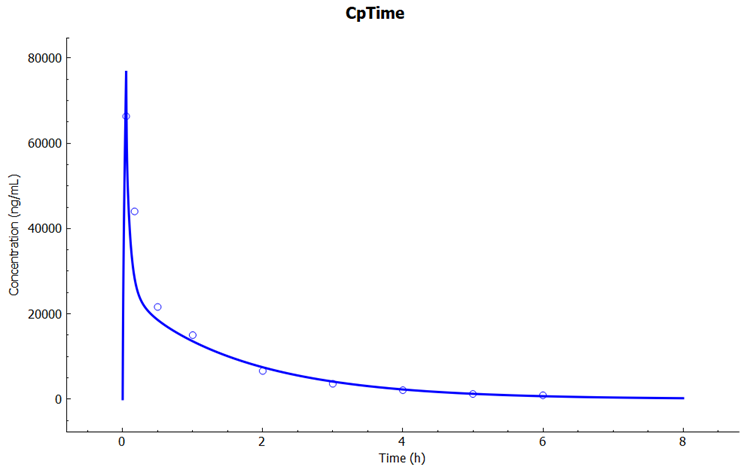
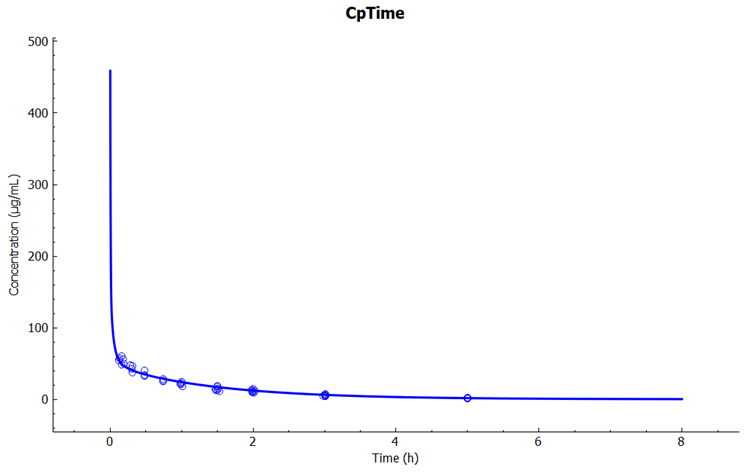
Click on the Simulations view in the navigation pane, select the simulation "Cefu_IV_Foord_250mg" and then click on Run Simulation.
In the Key View notice the adequate prediction of the Cp-Time observed data.
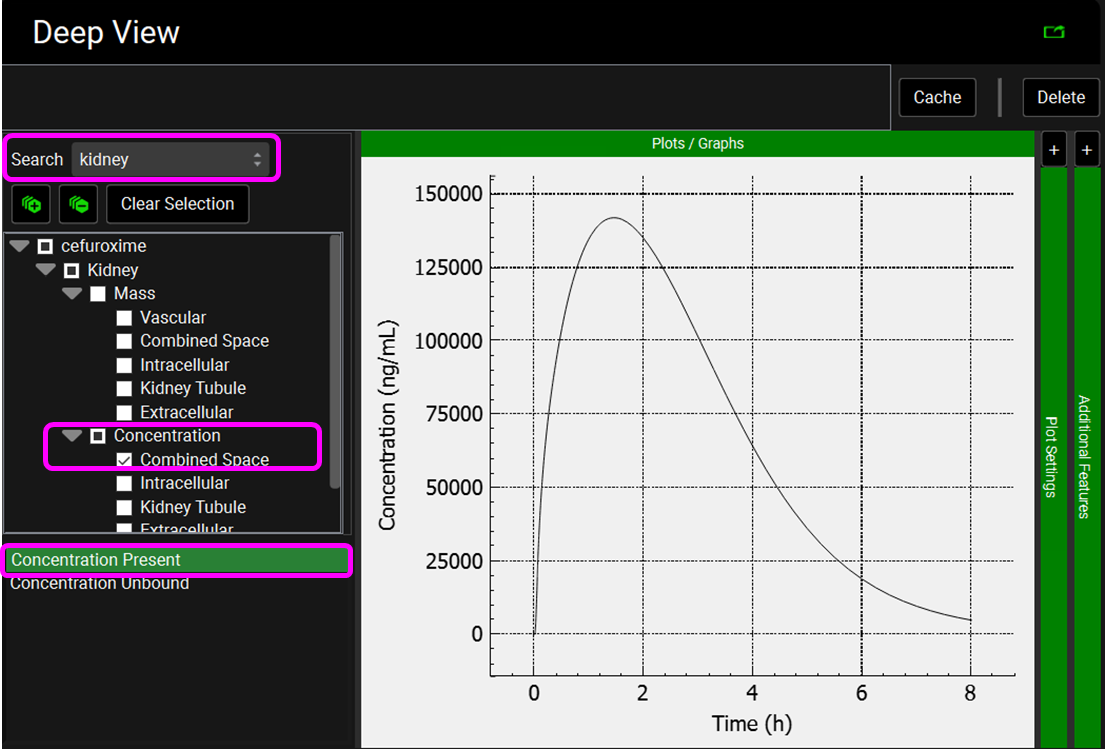
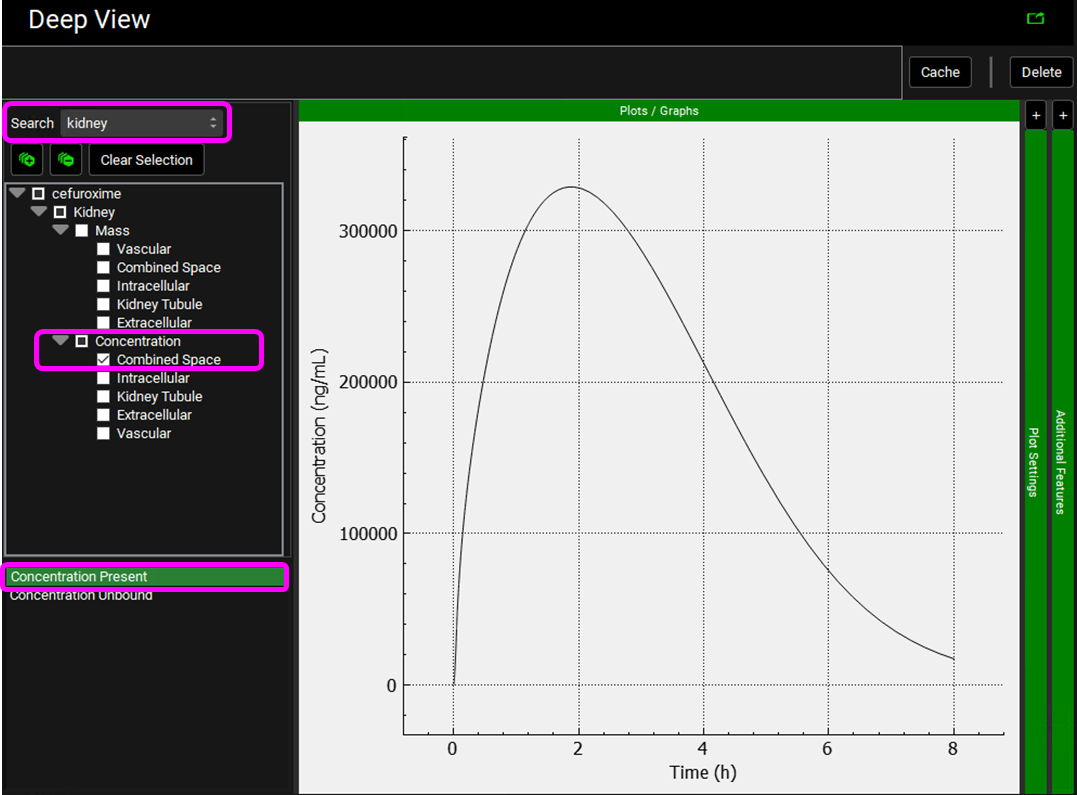
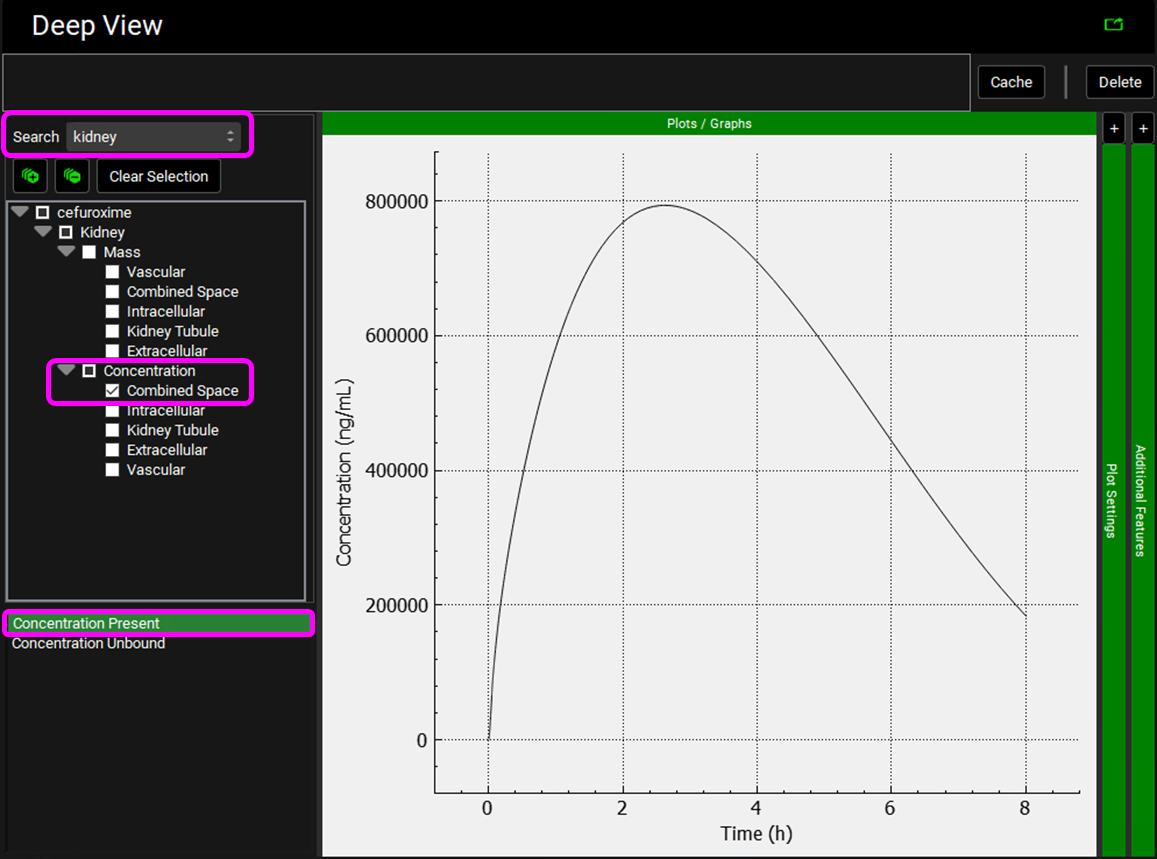
Select the Mode called Deep View in Analysis and type “kidney” in the Deep View Search box and then press Enter. Select Concentration > Combined Space from the tree and Concentration Present from the list to display the kidney concentration. Via Plot Options you can format the plot as you desire.
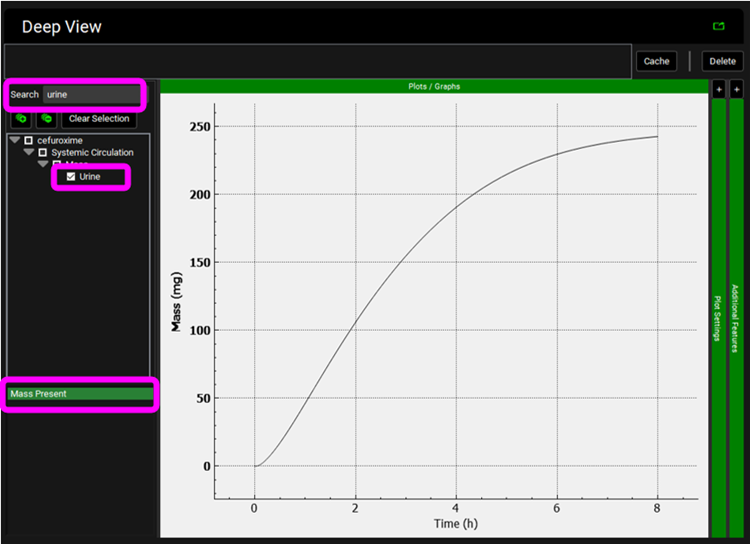
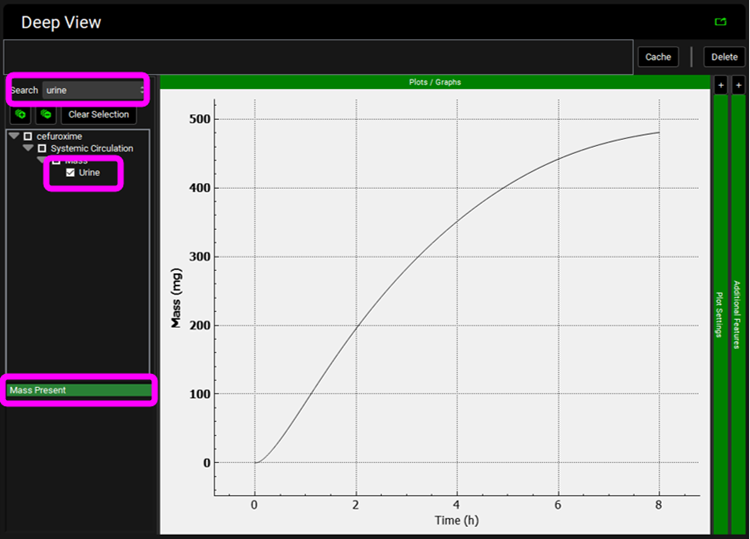
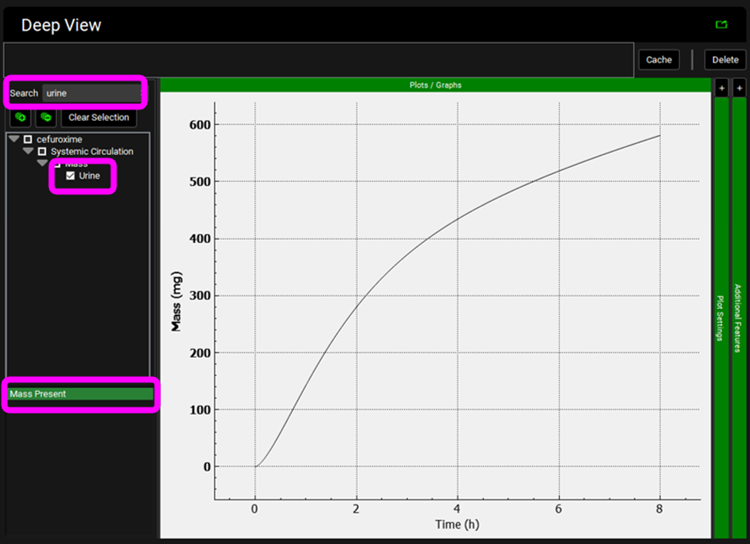
Click on Clear Selection and type “urine” in the Deep View Search box and then press Enter. Select Urine from the tree and Mass Present from the list to display the excreted unchanged amount of compound in the urine.
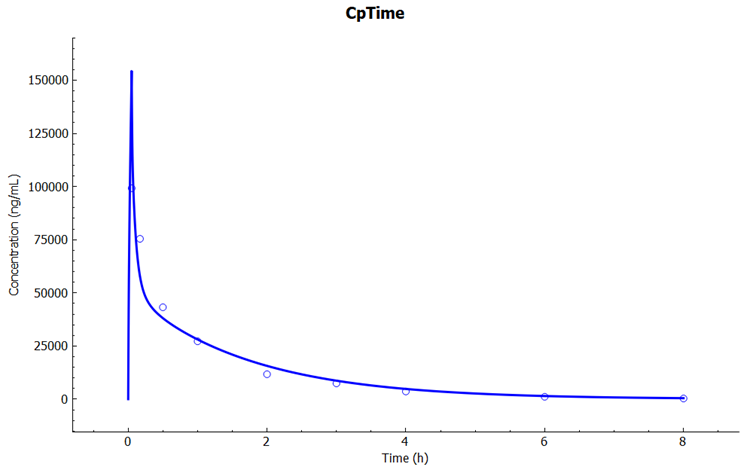
To explore the baseline model performance with other dose levels, click on the Simulations view in the navigation pane, select simulation "Cefu_IV_Foord_500mg" and then click on Run Simulation.
In the Key View notice the adequate prediction of the Cp-Time observed data.
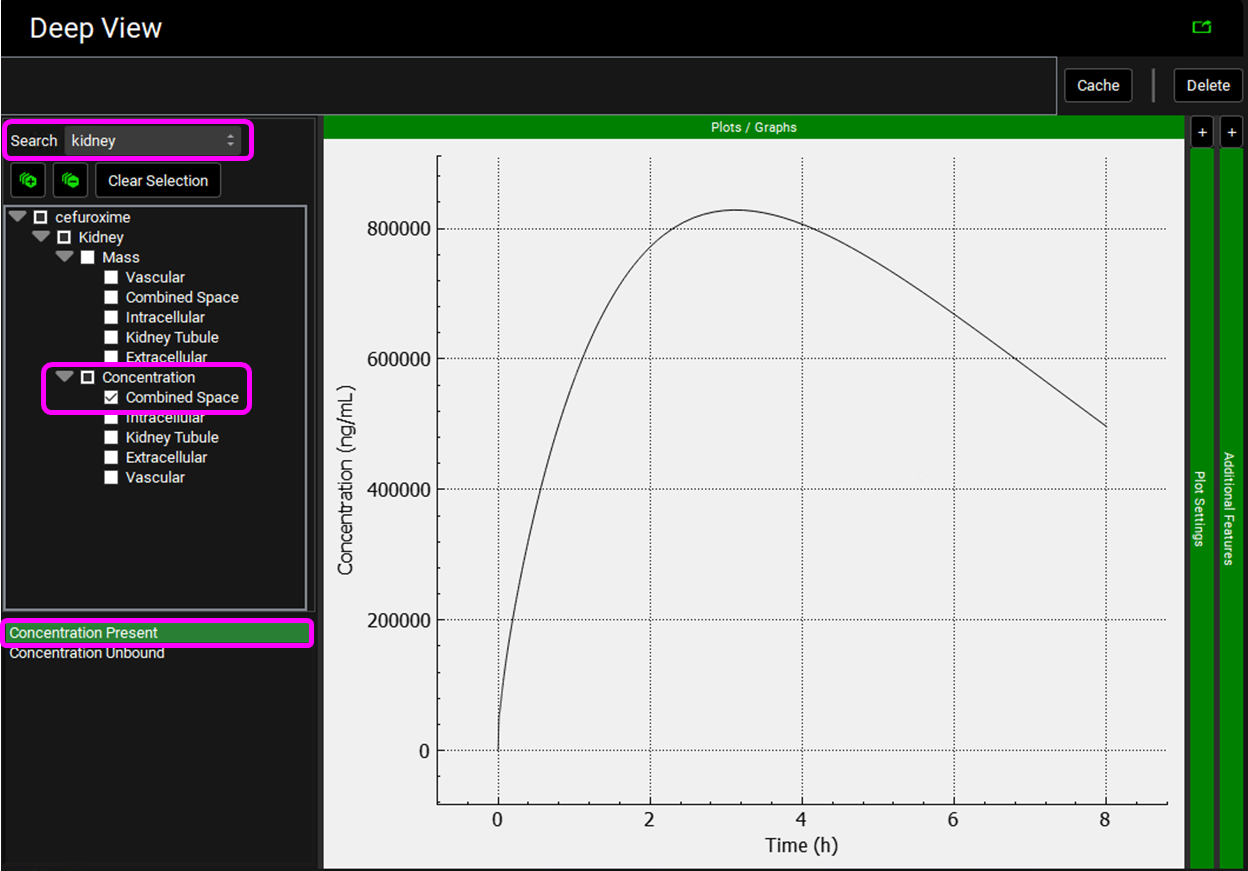
Select the Mode called Deep View in Analysis and type “kidney” in the Deep View Search box and then press Enter. Select Concentration > Combined Space from the tree and Concentration Present from the list to display the kidney concentration.
Click on Clear Selection and type “urine” in the Deep View Search box and then press Enter. Select Urine from the tree and Mass Present from the list to display the excreted unchanged amount of compound in the urine.
Click on the Simulations view in the navigation pane, select simulation "Cefu_IV_Foord_1000mg" and then click on Run Simulation.
In the Key View notice the adequate prediction of the Cp-Time observed data.
Select the Mode called Deep View in Analysis and type “kidney” in the Deep View Search box and then press Enter. Select Concentration > Combined Space from the tree and Concentration Present from the list to display the kidney concentration.
Click on Clear Selection and type “urine” in the Deep View Search box and then press Enter. Select Urine from the tree and Mass Present from the list to display the excreted unchanged amount of compound in the urine.

Predict the pharmacokinetics for pregnant subjects.
First, we will predict the pharmacokinetics of cefuroxime for subjects when their menstrual cycles were normal and they were not breast feeding i.e. they were not pregnant. Click on the Pharmacokinetics view in the navigation pane and switch the Physiology to “Human American Female 30y 61.7kg”. In the PBPKPlus™ panel click on the Kidney and notice that the transporter expression for MRP4 is half of the “Human American Male 30y 70kg” (3.398e-03 vs 6.795e-03 mg/g). This is to control the rate of urinary excretion and matches the cumulative urinary excretion observed for these subjects in the study.
Click on the Simulations view in the navigation pane, select simulation "Philipson1982-Not-Pregnant" and then click on Run Simulation.
In the Key View notice the adequate prediction of the Cp-Time observed data.
Select the Mode called Deep View in Analysis and type “kidney” in the Deep View Search box and then press Enter. Select Concentration > Combined Space from the tree and Concentration Present from the list to display the kidney concentration.
Click on Clear Selection and type “urine” in the Deep View Search box and then press Enter. Select Urine from the tree and Mass Present from the list to display the excreted unchanged amount of compound in the urine.
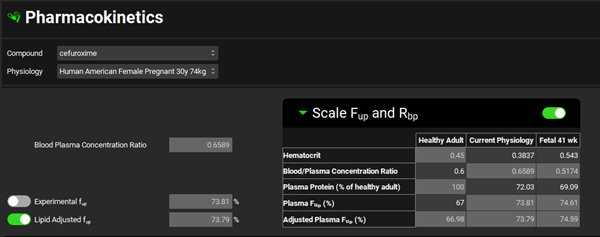
Now we will predict the pharmacokinetics of cefuroxime for subjects at 41 weeks gestational age. Click on the Pharmacokinetics view in the navigation pane and switch the Physiology to “Human American Female Pregnant 30y 74kg”. Review how maternal and fetal Fup and Blood/Plasma Concentration Ratio values are estimated from changes in hematocrit and plasma protein levels.
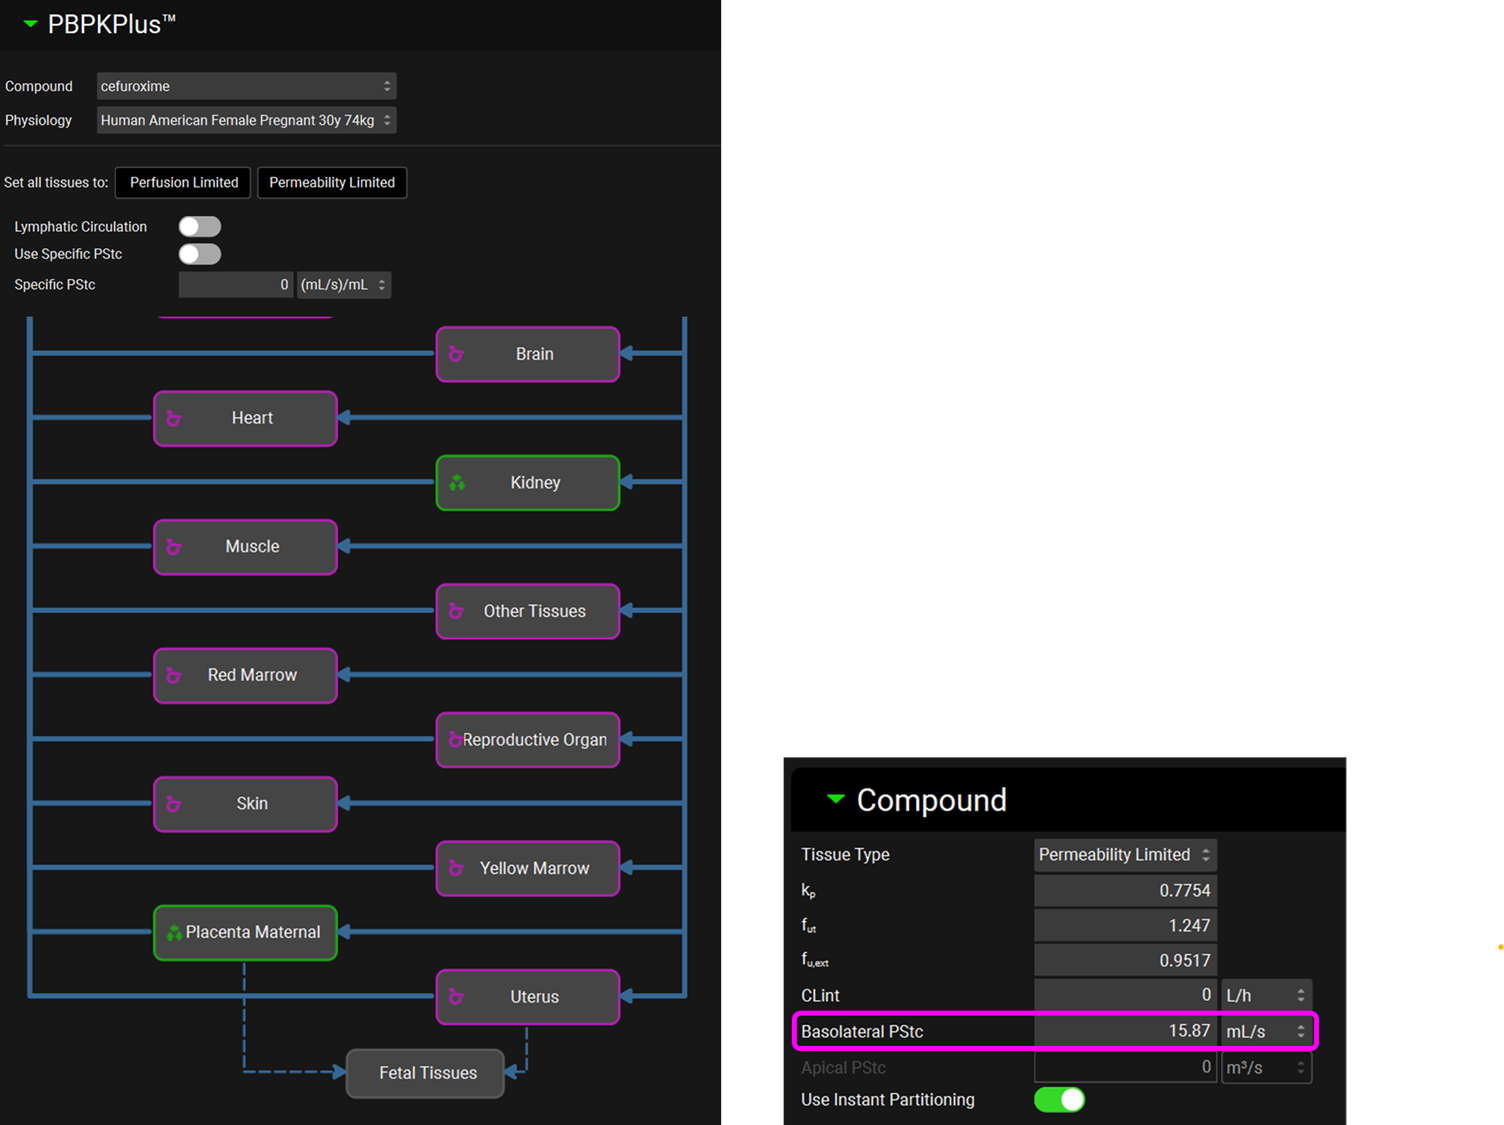
The Placenta Maternal is a Permeability Limited tissue with a passive Basolateral PStc.
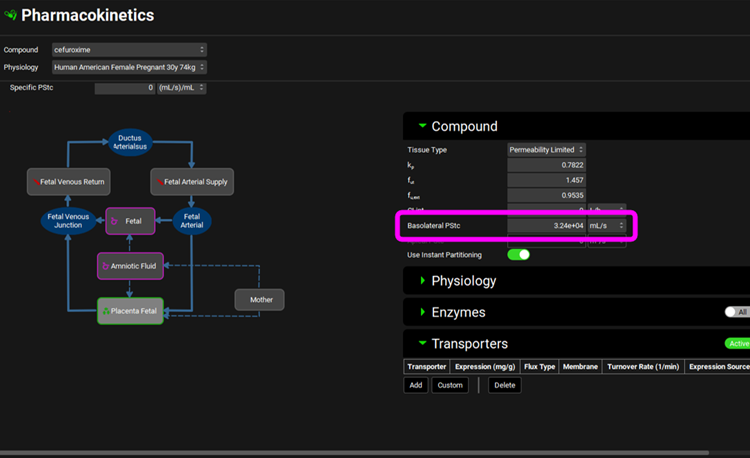
Double click on Fetal Tissues in the PBPK diagram to see that the Placenta Fetal is also a Permeability Limited tissue with a passive Basolateral PStc (These two PStc values were optimized and synchronized accounting for differences in cell volume in each compartment with SpecPStc = 0.2).
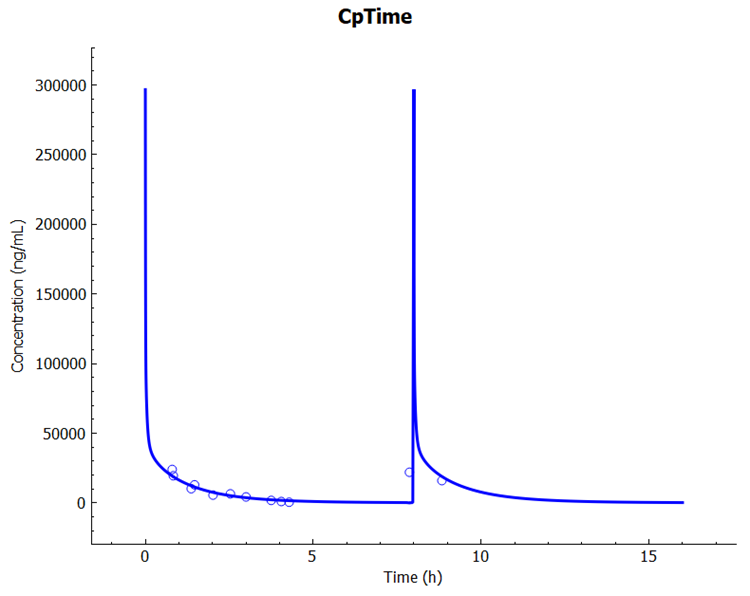
Click on the Simulations view in the navigation pane, select simulation "Philipson1982-41 GA" and then click on Run Simulation.
In the Key View notice the adequate prediction of the Cp-Time observed data.
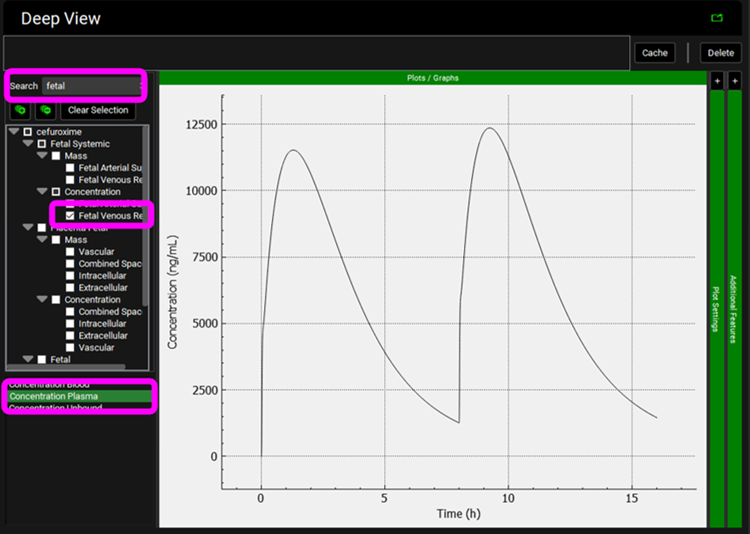
Select the Mode called Deep View in Analysis and type “fetal” in the Deep View Search box and then press Enter. Select Fetal Systemic > Concentration > Fetal Venous Return from the tree and Concentration Plasma from the list to display the Fetal Plasma concentration vs Time profile.
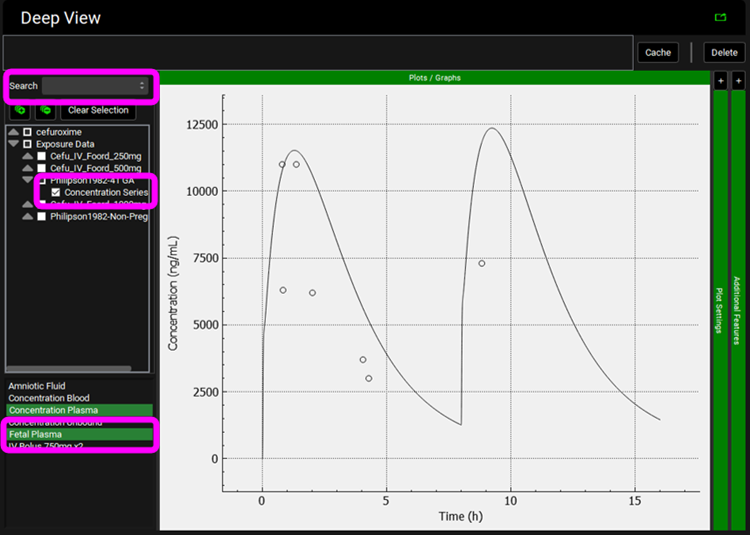
Clear the Deep View Search box and press enter, click on
 and then expand Exposure Data and select Philipson1982-41 GA > Concentration Series from the tree. Hold Ctrl and select “Fetal Plasma” from the list.
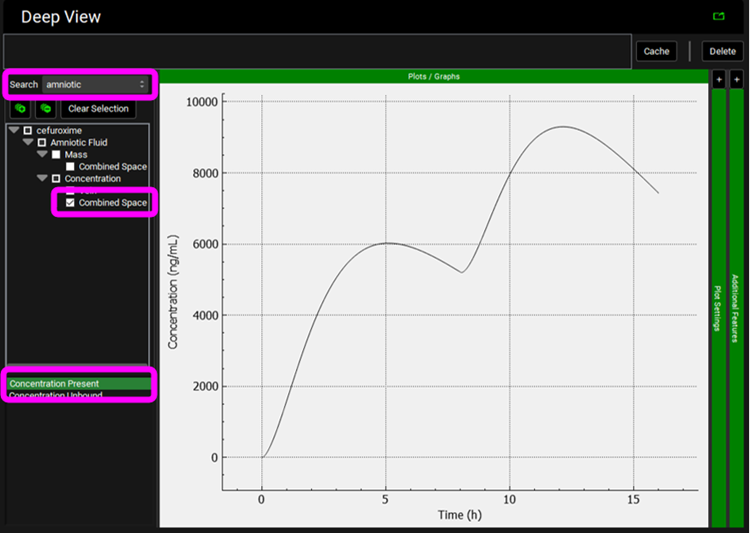
Click on Clear Selection and type “amniotic” in the Deep View Search box and then press Enter. Select Amniotic Fluid > Concentration > Combined Space from the tree and Concentration Present from the list to display the Amniotic Fluid concentration vs Time profile.
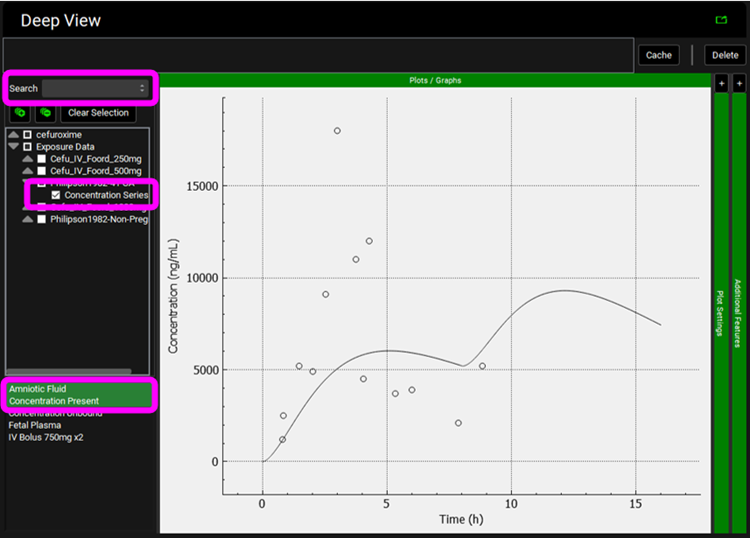
Clear the Deep View Search box and press enter, click on
 and then expand Exposure Data and select Philipson1982-41 GA > Concentration Series from the tree. Hold Ctrl and select “Amniotic Fluid” from the list.
- M. Hosseini-Yeganeh, A. J. (2002). Physiologically Based Pharmacokinetic Model for Terbinafine in Rats and Humans. Antimicrob Agents Chemother., 2219-2228.
- M. Hosseini-Yeganeh, A. J. (2002). Physiologically Based Pharmacokinetic Model for Terbinafine in Rats and Humans. Antimicrob Agents Chemother., 2219-2228.