
Multiple approaches are available in GastroPlus® for estimating the distribution of drug in 14 default tissues. These methods can differentiated by the type of prediction method or calculation that is used for estimating the coefficient value. See:
Tissue to plasma partition coefficient (Kp) prediction methods
GastroPlus® provides five tissue composition-based methods for estimating the tissue:plasma partition coefficient values (Kp). The principles and assumptions for three of these methods have been discussed widely in the literature1 2 3 4 5 6 7 8 9.
Poulin methods of Kp calculation
The Poulin tissue-composition based methods of Kp calculation are based on three assumptions:
-
Tissues and plasma are a combination of water, lipids, and proteins at pH = 7.4.
-
A drug partitions into tissues because of its interactions with neutral lipids, neutral phospholipids and water (passive, non-specific tissue binding). This partitioning can be either facilitated or hindered by specific binding to plasma or tissue proteins.
-
This passive diffusion results in a homogeneous drug distribution into each tissue.
In the absence of experimental data for specific tissue protein binding, the fraction of unbound drug in tissue, fut, is calculated as shown in Equation 2-19.
Equation 2-19: Fraction of drug unbound in tissue calculation
where:
|
Variable |
Definition |
|
|
The fraction of unbound drug in plasma. |
|
|
The ratio of albumin concentration in tissue to the albumin concentration in plasma. Note: When using Poulin’s method of tissue:plasma partition coefficients, RAt:p = 0.15 for adipose and RAt:p = 0.50 for all other tissues. |
Two variations for the calculation of tissue:plasma partition coefficients based on the Poulin homogeneous method are implemented in GastroPlus®. Both of these variations use the same general form of calculation, but differ in the variable assignments for K based on the tissue type, either adipose and yellow marrow or all other normal tissues.
For Poulin’s method of calculating the Kp, the fraction unbound variables include both protein binding and liposolubility, which is the partitioning to the plasma and tissue lipids.
Equation 2-20: Calculation of tissue:plasma partition coefficients based on the Poulin homogeneous method
where:
|
Variable |
Definition |
|
|
The fraction of unbound drug in tissue. |
|
|
The fraction of unbound drug in plasma. |
|
|
The solvent/water partition coefficient or distribution coefficient for the drug, where:
7.4 in vegetable oil and water (logDvo/w).
|
|
|
The volume fraction of neutral lipids in tissue. |
|
|
The volume fraction of neutral phospholipids in tissue. |
|
|
The volume fraction of total water in tissue. |
|
|
The volume fraction of neutral lipids in plasma. |
|
|
The volume fraction of neutral phospholipids in plasma. |
|
|
The volume fraction of total water in plasma. |
GastroPlus® employs a default two-step conversion method from logPoct/w to logDvo/w:
-
Using a slightly modified linear equation that was originally published by Leo10.
Equation 2-21: Default GastroPlus® conversion of logPoct/w to logDvo/w
-
Using the Henderson-Hasselbach equation to convert the calculated logPvo/w to logDvo/w.
This conversion and resulting Kp values have been shown to accurately reproduce experimental Kp values for both acidic drugs and basic drugs with logP < 2 and pKa <7.8.
If you are interested in a more in-depth exploration of the estimation of the logDvo/w value, please contact info@simulations-plus.com. You can also review the relevant Rodgers11 article.
For a drug that is distributed primarily from systemic circulation into extracellular space, the Kp is calculated as shown in Equation 2-22 for perfusion-limited tissues12 13 and Equation 2-23 for permeability-limited tissues.
Equation 2-22: Kp calculation for perfusion-limited tissues
Equation 2-23: Kp calculation for permeability-limited tissues
where:
|
Variable |
Definition |
|
|
The volume of the extracellular space as a fraction of the total tissue volume. |
|
|
The fraction of unbound drug in tissue. |
|
|
The fraction of unbound drug in plasma. |
Note that for permeability-limited tissues, the primary variable that governs Kp is the fraction of unbound drug in the tissue. Therefore, when fitting Kp for a permeability-limited tissue to observed tissue concentration data, you can fit either Kp or fut and achieve similar results.
Because these variables are correlated, ideally, you should not optimize both at the same time.
Berezhkovskiy method of Kp calculation (Modified Poulin calculation)
Berezhkovskiy published a modified Poulin equation for calculating tissue/plasma partitioning, where fut and fup include only protein binding14.
Equation 2-24: Berezhkovskiy method of Kp calculation (modified Poulin calculation)
Rodgers and Rowland method of Kp calculation
In addition to the drug dissolution in tissue water and its partitioning into neutral lipids and phospholipids (processes that the Poulin method of Kp calculation includes), the Rodgers and Rowland method incorporates the distribution processes that are related to drug ionization as well as the unique interactions of strong bases with acidic phospholipids. To incorporate these processes, compounds are divided into two different
groups, with each group having a unique equation for calculating the Kp.
-
Strong bases and Group 1 zwitterions, which are drugs that have at least one base pKa > 7.
-
Acids, neutral compounds, weak bases, and Group 2 zwitterions, which are drugs that have all base pKas < 7.
Every Kp calculation method uses the same tissue-specific parameters.
Strong bases and Group 1 zwitterions
Equation 2-25 shows the basic equation for the calculation of the tissue to plasma water partition coefficient, Kpu.
Equation 2-25: Kpu calculation with acidic phospholipid binding for compounds with a base pKa > 7
where:
|
Variable |
Definition |
|
|
The volume fraction of extracellular water in individual tissues. |
|
|
The volume fraction of intracellular water in individual tissues. |
|
|
The solvent/water partition coefficient for the drug, where:
|
|
|
The volume fraction of neutral lipids in individual tissues. |
|
|
The volume fraction of neutral phospholipids in individual tissues. |
|
|
The fraction of neutral drug in plasma (pH = 7.4). |
|
|
The association constant of a basic compound with acidic phospholipids. See Equation 2-27. |
|
|
The concentration of acidic phospholipids in individual tissues. |
|
|
The fraction of neutral drug in the intracellular space (water) of individual tissues (pH = 7). |
The third term in Equation 2-25 represents the interaction of bases with acidic phospholipids (apl). If the assumption is made that the association constant Ka is the same in all tissues and red blood cells, then the value for this term can be estimated from the KpuRBC/plasma water, which is the partition coefficient of drug in red blood cells to plasma water. The value for KpuRBC/plasma water can be readily determined in vitro using Equation 2-26.
Equation 2-26: Calculation of KpuRBC/plasma water
where:
|
Variable |
Definition |
|
|
The hematocrit. |
|
|
The blood/plasma drug concentration ratio. |
|
|
The fraction of unbound drug in plasma. |
If you rearrange Equation 2-25, then Equation 2-27 shows the calculation of Ka from KpuRBC/plasma water.
Equation 2-27: Calculation of Ka from KpuRBC/plasma water
where:
|
Variable |
Definition |
|
|
The fraction of neutral drug in the intracellular space of red blood cells (pH = 7.22). |
|
|
The fraction of neutral drug in plasma (pH = 7.4). |
|
|
The volume fraction of intracellular water in red blood cells. |
|
|
The volume fraction of neutral lipids in red blood cells. |
|
|
The volume fraction of neutral phospholipids in red blood cells. |
|
|
The concentration of acidic phospholipids in red blood cells. |
|
|
The solvent/water partition coefficient for the drug, where:
|
The Ka that is calculated from Equation 2-27 is then substituted in Equation 2-25 for the calculation of Kpu in all tissues.
Acids, neutral compounds, weak bases, and Group 2 zwitterions
Equation 2-28 incorporates the binding of tissue proteins, represented by tissue albumin or lipoprotein, rather than the binding to acidic phospholipids.
Equation 2-28: Kpu calculation with tissue protein binding for compounds with all base pKas <7
where:
|
Variable |
Definition |
|
|
The fraction of neutral drug in the intracellular space (water) of individual tissues (pH = 7). |
|
|
The fraction of neutral drug in plasma (pH = 7.4). |
|
|
The volume fraction of intracellular water in individual tissues. |
|
|
The volume fraction of extracellular water in individual tissues. |
|
|
The volume fraction of neutral lipids in individual tissues. |
|
|
The volume fraction of neutral phospholipids in individual tissues. |
|
|
The fraction of unbound drug in plasma. |
|
|
The volume fraction of neutral lipids in plasma. |
|
|
The volume fraction of neutral phospholipids in plasma. |
|
|
|
|
|
The solvent/water partition coefficient for the drug, where:
|
All compounds
For all types of compounds, the final Kp is then calculated as shown in Equation 2-29.
Equation 2-29: Final Kp calculation for all compounds
Lukacova method of Kp calculation (Combined Rodgers and Rowland equations)
The published version of the Rodgers and Rowland Kp calculation is based on a distinction between strong bases and other compounds with an arbitrary cutoff at base pKa = 7. This arbitrary cutoff places significant weight on an accurate measurement or prediction of base pKa values, especially for those drugs with values around 7. Even the smallest deviation from the true value (for example, 6.95 instead of 7.0) can result in the
use of the wrong equation and, subsequently, high error in the estimated Kp values. The pKa cutoff also assumes that a basic compound, 26% of which is in ionized form in plasma (pKa ~ 6.95) binds only to albumin while a compound, 31% of which is in ionized form in plasma (pKa ~ 7.05) binds only to acidic phospholipids.
Figure 2-10 shows the Kp vs pKa dependency for a model compound with the following characteristics: base pKa, logP = 1, fup = 1, and Rb:p = 1 in adipose and muscle tissues. As can be seen in Figure 2-10, a clear break in Kp values at pKa= 7 is observed for both tissues, which cannot be physiologically explained.
Figure 2-9: Adipose Kp calculated using the original Rodgers and Rowland approach versus base pKa
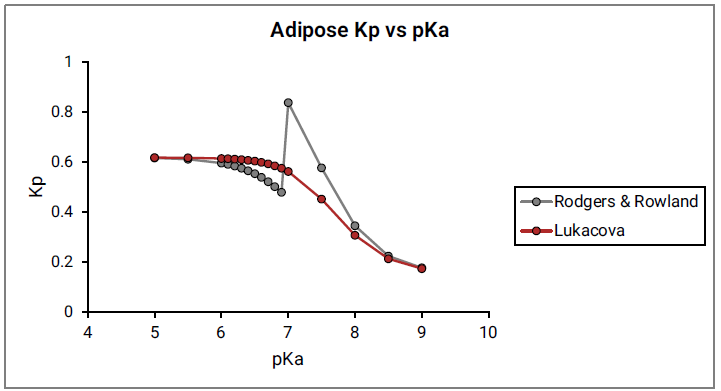
Figure 2-10: Muscle Kp calculated using the original Rodgers and Rowland approach versus base pKa
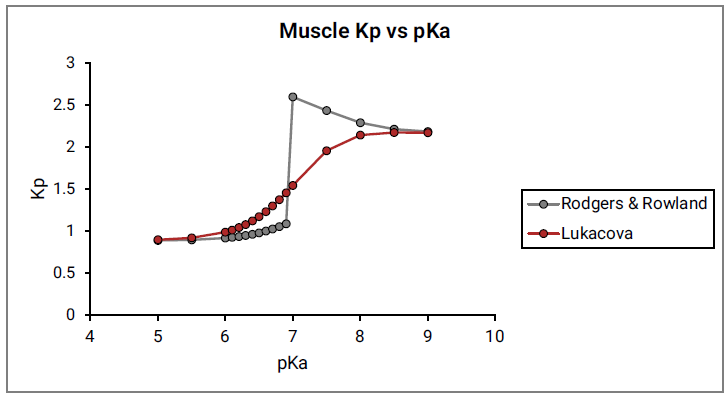
Simulations Plus derived a modified form of the Rodgers and Rowland Kp calculation by combining the two equations into a single one. This equation provides a continuous shift from neutrals and acids binding almost exclusively to albumin towards strong bases binding almost exclusively to acidic phospholipids. Because moderate bases (base pKa in the range 6 to 8) have neutral species as well as cationic species present in plasma and in tissues at physiological pH values, the assumption was made that these compounds could bind to both albumin, via their neutral forms, and acidic phospholipids, via their ionized cationic forms. Equation 2-30 is the final form of the combined equation.
Equation 2-30: Lukacova combined equation for Kp calculation
where:
|
Variable |
Definition |
|
|
The volume fraction of extracellular water in individual tissues. |
|
|
The fraction of neutral drug in the intracellular space (water) of individual tissues (pH = 7). |
|
|
The fraction of neutral drug in plasma (pH = 7.4). |
|
|
The solvent/water partition coefficient for the drug, where:
|
|
|
The volume fraction of intracellular water in individual tissues. |
|
|
The volume fraction of neutral lipids in individual tissues. |
|
|
The volume fraction of neutral phospholipids in individual tissues. |
|
|
The fraction of drug without positive charge in plasma, where the zwitterions with total charge = 0 are not included in this fraction because they contain positive charge that would be associating with the acidic phospholipids. |
|
|
The volume fraction of neutral lipids in plasma. |
|
|
The volume fraction of neutral phospholipids in plasma. |
|
|
|
|
|
The fraction of drug with positive charge in plasma, including cations or zwitterions with at least one positive charge on the molecule, regardless of the total charge of the molecule. |
|
|
The association constant of a basic compound with acidic phospholipids. |
|
|
The concentration of acidic phospholipids in individual tissues. |
As before, for all types of compounds, the final Kp is then calculated according to Equation 2-29.
As shown in Equation 2-30, the calculated Kp values will be similar to the original Rodgers and Rowland approach for acids, neutrals, very weak bases and very strong bases, where the fraction of molecules with positive charge will be either insignificant or nearly 100%. Differences in Kp values will be seen for moderate bases (with 6 < pKas < 8), where significant contributions from both types of binding can be expected.
Comparison of original Rodgers and Rowland method and the Lukacova combined method for the calculation of Kp
The comparison of the original Rodgers and Rowland method and the Lukacova combined method for the calculation of Kp required the identification of compounds with either experimental Kp values or experimental steady state volume distribution values (Vss).
For a detailed discussion about Vss, see Steady state volume distribution values (Vss).
The original Rodgers and Rowland method and the Lukacova combined method for Kp calculation were compared using the moderate bases (compounds with 6 < base pKa < 8) from the Rodgers15 16 17 18 and Poulin publications19 20. Seven compounds with experimental Kp values in rat were found in the Rodgers papers, and an additional seven compounds with experimental Vss values in rat were found in the Poulin papers. For the compounds with available Vss values, the combined equation performed better than the original Rodgers and Rowland equation, with an average 45% error for the combined method compared to an average 59% error for the original Rodgers and Rowland method. For the compounds with experimental Kp values, however, the combined equation had a slightly higher than average error rate of 94% error compared to an average error rate of 89% for the original method. Based on this limited set of published data, neither method appears to be significantly better than the other.
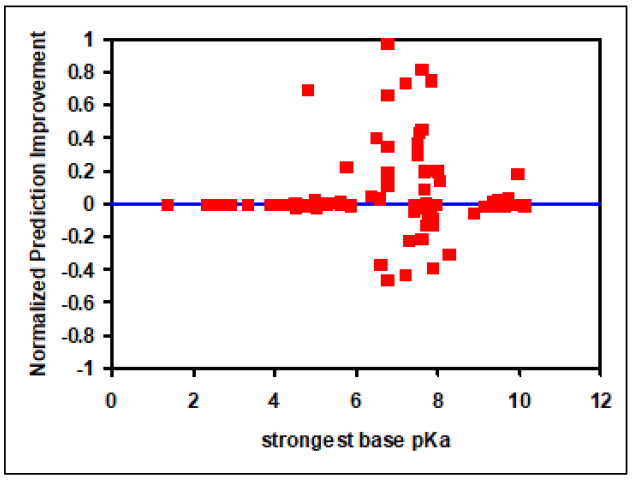
An additional comparison was done using a proprietary set of 112 compounds with at least one base pKa and the strongest base pKa value for each compound ranging from 1.5 to 10. Because only experimental Vss values were available for these compounds, the comparison was done on the basis of Vss values rather than direct Kp comparisons. A Normalized Prediction Improvement (NPI) was calculated according to Equation 2-31.
Equation 2-31: NPI calculation
where:
|
Variable |
Definition |
|
|
The normalized error of prediction using the original two Rodgers and Rowland equations. |
|
|
The normalized error of prediction using the Lukacova combined equation. |
and the normalized error of prediction was calculated as shown in Equation 2-32.
Equation 2-32: Normalized error of prediction calculation
where:
|
Variable |
Definition |
|
|
The predicted volume of distribution. |
|
|
The experimental volume of distribution. |
NPI values can range from -1 to 1, where positive values represent better Vss predictions using the Lukacova combined equation and negative values represent better Vss predictions using the original Rodgers and Rowland approach.
Figure 2-11, which is a plot of NPI versus strongest base pKa values, shows significant improvements in Vss prediction using the Lukacova combined equation compared to the two original Rodgers and Rowland equations. This is evident as the number of compounds with positive NPI values, along with the absolute magnitude of positive values, is larger compared to negative NPI values.
Figure 2-11: Improvement in Vss prediction from Kps calculated using the Lukacova combined equation versus the original Rodgers and Rowland equations
Lukacova method with lysosomes
The Lukacova method was extended to account for the effect of lysosomal compartments on the tissue distribution of drugs. Equation 2-33 shows these calculations.
Equation 2-33: Lukacova method with lysosomes
where:
|
Variable |
Definition |
|
|
The fraction of neutral drug in lysosomes. |
|
|
The fraction of positive drug in lysosomes. |
|
|
The fraction of positive drug in intracellular water. |
|
|
The volume fraction of lysosomes in tissue. |
|
Note: All other variables are as previously defined. See Equation 2-30. |
|
The Vlys for liver, lung and adipose tissues were estimated from previously published values21. For lung and liver, the total tissue Vlys values were calculated from the reported fractions of different cell types in these tissues and their corresponding lysosomal fractions. The Vlys for adipose tissue was estimated from the reported lysosomal fraction in liver fat storing cells. The Vlys values for remaining tissues are estimated from their acidic phospholipid concentrations and linear function fitted between Vlys and acidic phospholipid concentrations for the lung, liver and adipose. See Figure 2-12.
Based on the published information about lysosomal pH21, the overall lysosomal pH was estimated to be 4.84 for the liver and 5.02 for the lung. The lysosomal pH in all other tissues is set to 5.1.
Figure 2-12: Lysosomal volume fraction versus acidic phospholipid concentration
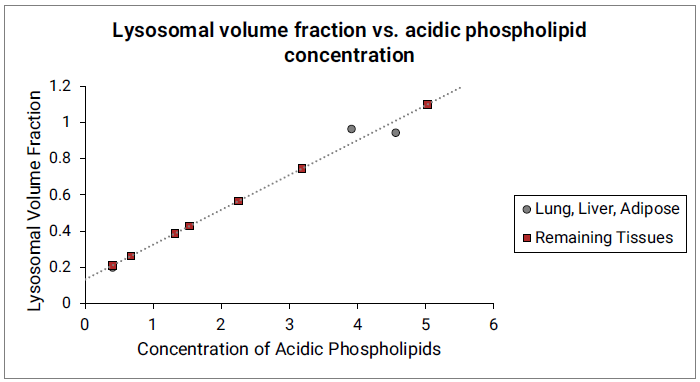
The gray circles represent measured lysosomal volume fraction in lung, liver and adipose (approximated by liver fat storing cells). The dotted gray line indicates the linear function fitted to the data in lung, liver and adipose. The red squares represent the lysosomal volume fractions in remaining tissues calculated from the linear function and their respective acidic phospholipid concentrations.
Fraction of drug unbound in plasma in Kp calculations
The investigation of the prediction accuracy by individual methods revealed the tendency of the Rodgers method to predict very high Kp values, and subsequently very high Vss values, for highly lipophilic compounds. A common finding among these problem compounds was that a relatively high experimental value for fraction unbound in plasma, fup, was also reported.
A closer look at the lipophilicity and experimental fup values for these compounds revealed an inconsistency between the two values. Even though the amounts of neutral lipids and phospholipids in plasma are low, when compared to their amounts in other tissues, the amount for highly lipophilic compounds is sufficient to bind a significant fraction of the compound that is present in plasma.
Simulations Plus derived Equation 2-34 to calculate the “corrected” fraction unbound in plasma based on the following assumptions:
-
The experimental fup is a measure of drug binding only to protein.
-
logP can be used as an estimate for the drug partitioning to plasma lipids.
Equation 2-34: Fraction unbound in plasma for Kp calculations
where:
|
Variable |
Definition |
|
|
The adjusted fraction of unbound drug in plasma that is used in Kp calculations. |
|
|
The experimental fup value. |
|
|
The octanol/water distribution coefficient at pH=7.4, which is the pH of plasma. |
|
|
The volume fraction of total neutral lipid and total neutral phospholipid in plasma. |
|
|
The volume fraction of total water in plasma. |
Intracellular and extracellular concentration calculations
As specified in the equations for calculation of saturable clearance or transport in both types of tissues (perfusion- or permeability-limited), the unbound concentration of drug in the intracellular (clearance or efflux) space or the extracellular (influx) space is considered. See:
Kp-based tissue calculations (Default method)
Kp-based tissue calculations for fut (fraction unbound in tissue) in GastroPlus® are available without lysosomal compartments and with lysosomal compartments. Moreover, input parameters and compound properties can result in the calculated fut value being greater than one (fut > 1).
fut calculation (no lysosomal compartments)
As shown in Equation 2-35 and Equation 2-36, respectively, the fut in a perfusion- limited tissue and the fu(ext) (where ext = extracellular) in a permeability-limited tissue are calculated from the Kp value for a given tissue. This calculation is based on the assumption of an instant equilibrium among the unbound, neutral concentrations in plasma, extracellular water, and intracellular water and results in the correct ratios of simulated, unbound concentrations, regardless of the Kp input.
Equation 2-35: fut calculation for perfusion-limited tissue
Equation 2-36: fu(ext) calculation for permeability-limited tissue
where:
|
Variable |
Definition |
|
|
The fraction of neutral drug in plasma (pH = 7.4). |
|
|
The fraction of unbound drug in plasma. |
|
|
The tissue/plasma partition coefficient. |
|
|
The fraction of neutral drug in intracellular water (pH = 7) for a perfusion-limited tissue. |
|
|
The fraction of neutral drug in extracellular water (pH = 7.4) for a permeability-limited tissue. |
The calculation of fu(int) (where int = intracellular) in a permeability-limited tissue was based on the assumptions from the Lukacova Kp calculation (see Lukacova method of Kp calculation (Combined Rodgers and Rowland equations)), accounting for ionization, drug partitioning into the tissue membranes, and possible drug binding to acidic phospholipids. See Equation 2-37.
Equation 2-37: fu(int) calculation for permeability-limited tissue
where:
|
Variable |
Definition |
|
|
The fraction of unbound drug in the intracellular space (water) of the tissue. |
|
|
The fraction of cationic drug in plasma (pH = 7.4). |
|
|
The fraction of cationic drug in intracellular space (water) of the tissue (pH = 7.0). |
|
Note: For the remainder of the variable definitions, see Equation 2-30. |
|
fut calculation (lysosomal compartments)
For perfusion-limited tissues, the Kp calculation accounts for partitioning into lysosomal compartments, and the fut calculation applies as described in Equation 2-35.
For permeability-limited tissues, the drug diffusion into the lysosomal compartments is calculated according the Equation 2-7. The fraction of drug unbound in the lysosomal compartments, fut,lys, is calculated according to Equation 2-38.
Equation 2-38: fut in lysosomal compartments, permeability-limited tissue
where:
|
Variable |
Definition |
|
|
The fraction of cationic drug in plasma (pH = 7.4). |
|
|
The fraction of cationic drug in the lysosomal compartments. |
|
|
The concentration of acidic phospholipids in individual tissues. |
Calculated fut value > 1
Depending on the input parameters and compound properties, the calculated fut values might be > 1 in certain scenarios.
For fu(ext), a value >1 is unlikely if the Kp is calculated using the default Kp-based tissue method because:
-
The extracellular Kp is calculated from the compound's fup by accounting for the differences in protein levels between plasma and a tissue.
-
The pH in plasma and extracellular water is the same, so there are no differences in ionization between those two compartments.
With user-defined Kp values, however, if the entered Kp value is too low, then the calculated fu,ext might be >1.
For fut in a perfusion-limited tissue, even if the Kps are calculated using the default Kp-based tissue method, the fraction unbound might be > 1 based on two mechanisms.
-
Mechanism 1 is the drug ionization, where the partitioning theory assumes that the neutral unbound concentrations would be equal in plasma and intracellular water. For bases with a higher ionized fraction at lower intracellular pH (7.0) than plasma pH (7.4), this might cause drug accumulation in the intracellular water and result in the total (neutral and ionized) fraction unbound > 1.
-
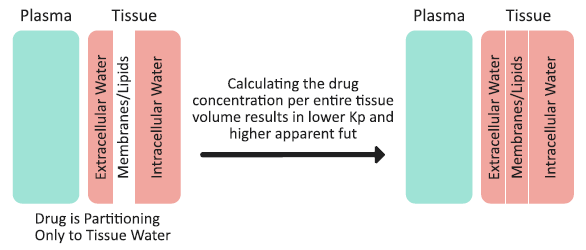
Mechanism 2 is a lack of drug partitioning into the tissue membranes/lipids, and how this partitioning is accounted for in the Kp calculation. As an example, consider an extreme case of a neutral, highly hydrophilic drug that does not accumulate in the tissue membranes/lipids, and does not bind to albumin (fup = 1). Such a compound would partition only into the extracellular and intracellular water. The drug concentrations in plasma, extracellular water, and intracellular water would be the same, and there would be no drug in the tissue membranes/lipids. (See Figure 2-13). The tissue membranes/lipids are considered a separate compartment in the Kp calculation method, and calculating the drug concentration per entire tissue volume (including water and membranes/lipids) would result in a total tissue concentration that is lower than the actual concentration in extracellular water or intracellular water. Subsequently, the tissue Kp is < 1 and Equation 2-36 dictates that the apparent fut to be > 1. The extent by which the fut might exceed a value of one depends on the fraction of membranes/lipids in the tissue - that is, the higher the fraction of membranes/lipids, the higher the “drug dilution” effect when calculating concentration for the entire tissue volume and, subsequently, the higher apparent fut. The same mechanisms would lead to an intracellular fraction unbound (fu(int) > 1) in permeability-limited tissues.
Figure 2-13: Drug partitioning into tissue and the total tissue concentration calculation
Lukacova calculation method
The previously published Kp calculation by Poulin included the calculation of the fraction unbound in the extracellular tissue space based on the fraction unbound in plasma and the albumin tissue:plasma ratio (See Poulin methods of Kp calculation). This section derives the calculations for unbound drug concentrations in the intracellular space. These calculations are based on assumptions from the Rodgers Kp calculation as detailed in Rodgers and Rowland method of Kp calculation. See:
Perfusion-limited tissue
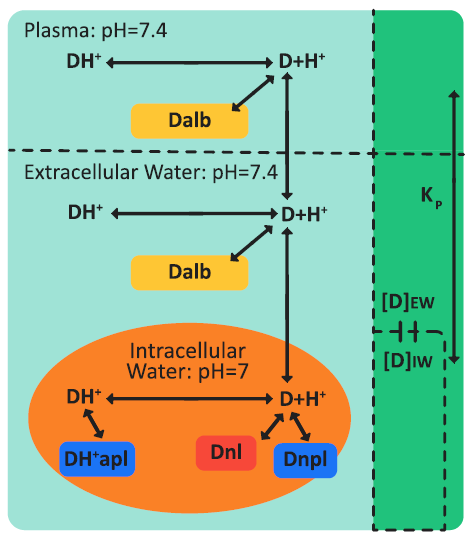
Figure 2-14 is a schematic of drug ionization and binding processes in plasma and a perfusion-limited tissue.
Figure 2-14: Drug ionization and binding processes in plasma and a perfusion-limited tissue
where:
|
Variable |
Definition |
|
|
The neutral, unbound form of drug. |
|
|
The cationic, unbound form of drug. |
|
|
The neutral or anionic form of drug bound to plasma or tissue protein (albumin). |
|
|
The cationic form of drug bound to acidic phospholipids. |
|
|
The neutral or anionic form of drug bound to neutral lipids. |
|
|
The neutral or anionic form of drug bound to neutral phospholipids. |
The two basic assumptions for perfusion-limited tissues are:
-
The tissue compartment is a well-stirred compartment, with instant equilibrium between the extracellular concentration and the intracellular concentration.
-
The unbound, non-ionized concentrations of drug in the extracellular space, intracellular space, and plasma are equal.
Fraction unbound in extracellular space
In the extracellular space, the drug binds only to tissue albumin. Therefore, to calculate the fraction of drug that is unbound in the extracellular space, use the Poulin equation. See Equation 2-19.
Total fraction unbound in the tissue
The total concentration of drug that enters a perfusion-limited tissue, Ctissue,t, is determined by the tissue:plasma partition coefficient, Kp, and is the result of a simulation at each time step. The total concentration can be calculated as a sum of all forms of the drug in extracellular water (extw) and intracellular water (intw).
Equation 2-39: Total concentration of drug entering a perfusion-limited tissue
where:
|
Variable |
Definition |
|
|
The concentration of non-ionized, unbound drug in extracellular water. |
|
|
The concentration of non-ionized, unbound drug in intracellular water. |
|
|
The concentration of ionized, unbound drug in extracellular water. |
|
|
The concentration of ionized, unbound drug in intracellular water. |
|
|
The concentration of neutral or anionic drug bound to tissue albumin in the extracellular space. |
|
|
The concentration of cationic drug bound to acidic phospholipids in the intracellular space. |
|
|
The concentration of neutral or anionic drug bound to neutral lipids in the intracellular space. |
|
|
The concentration of neutral or anionic drug bound to neutral phospholipids in the intracellular space. |
The equilibrium concentrations of the individual forms of the drug in tissue can be expressed as shown in the following equations.
-
The non-ionized, unbound concentrations of drug are assumed to be equal in both the extracellular and intracellular water.
Equation 2-40: Non-ionized, unbound concentrations of drug in extracellular and intracellular water
-
The equilibria between the non-ionized and ionized concentrations of drug in the extracellular space and intracellular space are governed by the pKa and pH of the drug in each space.
Equation 2-41: Equilibria between non-ionized and ionized unbound concentrations of drug in extracellular and intracellular spaces
-
The fraction of unbound drug in the extracellular space is governed by the concentration of the neutral, unbound drug in extracellular water and the concentration of neutral or anionic drug bound to plasma or tissue protein (albumin).
Equation 2-42: Fraction of unbound drug in the extracellular space
-
The equations for the calculation of the fractions of drug bound to neutral lipids, neutral phospholipids, and acidic phospholipids are given by Rodgers22 23, as shown in Equation 2-43 through Equation 2-45, respectively.
Equation 2-43: Cationic fraction of drug bound to acidic phospholipids
Equation 2-44: Neutral fraction of drug bound to neutral lipids
where, for simplicity in upcoming calculations, this value is abbreviated as fnl.
Equation 2-45: Neutral fraction of drug bound to neutral phospholipids
where, for simplicity in upcoming calculations, this value is abbreviated as fnpl.
After substitution of all the equations Equation 2-40 through Equation 2-45 into Equation 2-39, and then rearrangement, the total fraction of unbound drug in the tissue can be calculated as shown in Equation 2-46.
Equation 2-46: Total fraction of unbound drug in the tissue
Total and unbound extracellular and intracellular concentrations
After substitution of all the equations Equation 2-40 through Equation 2-45 into Equation 2-39, and then rearrangement, the ratio of the drug concentrations in the extracellular region and intracellular region to the total drug concentration can be calculated as shown in Equation 2-47.
Equation 2-47: Ratio of the drug concentrations in the extracellular region and intracellular region to the total drug concentration
The total concentration of drug in tissue can be calculated from the total concentrations of drug in the extracellular space and the intracellular space and the appropriate volume fractions of intracellular and extracellular space in tissue and the total volume of the tissue as shown in Equation 2-48.
Equation 2-48: Total drug concentration in tissue
Equation 2-49 (an equation set) shows the calculation of the total concentration of drug in the intracellular space and the total concentration of drug in the extracellular space, the values of which are calculated from the total concentration of drug in the tissue and the value of Rext:int, which is the ratio of the drug concentrations in the extracellular region and the intracellular region.
Recall that the value of Rext:int was previously calculated in Equation 2-47.
Equation 2-49: Total concentration of drug in the intracellular and extracellular spaces
The unbound, un-ionized concentration of drug in the intracellular space and in the extracellular space are assumed to be in equilibrium, and therefore, these concentrations can be calculated from the total concentration of drug in the extracellular space and the fraction of unbound drug in the extracellular space, while accounting for ionization of the drug in the extracellular space. Equation 2-50 shows this calculation, where [D]int,n and [D]ext,n represent only the un-ionized form of the drug.
Equation 2-50: Unbound, un-ionized concentration of drug in the intracellular and extracellular spaces
As shown in Equation 2-51, the total, unbound intracellular concentration of drug, [D]int, which includes both the neutral and ionized forms, is then calculated by accounting for ionization in the intracellular space.
Equation 2-51: Total, unbound intracellular concentration of drug (neutral and ionized forms)
Permeability-limited tissue
The basic assumptions for permeability-limited tissues are as follows:
-
The distribution of the drug throughout the tissue (between the extracellular and intracellular compartments) is time-dependent.
-
A difference in the unbound, non-ionized concentrations between the intracellular and extracellular spaces can be maintained by active transport, either influx or efflux.
Based on these assumptions, the relevant calculations for permeability-limited tissues are as follows:
-
The drug partitioning into the extracellular space is given by Poulin’s equation for extracellular space. See Equation 2-23.
-
The extracellular unbound fraction of drug, fu(ext) can be calculated similarly to perfusion-limited tissues. See Equation 2-19.
-
The intracellular concentration of drug is determined by time-dependent transport processes (active influx, active efflux, or passive diffusion).
-
The total fraction of unbound drug in the intracellular space can be calculated by modifying Equation 2-46 to account for only intracellular processes. This modification results in Equation 2-52.
Equation 2-52: Total fraction of unbound drug in the intracellular space
1.Rodgers, T., Leahy, D., et al. (2005). “Physiologically based pharmacokinetic modeling 1: predicting the tissue distribution of moderate-to-strong bases.” J. Pharm. Sci. 94(6): 1259-76.
2.Rodgers T. and Rowland M. (2006). “Physiologically-based Pharmacokinetic Modeling 2: Predicting the tissue distribution of acids, very weak bases, neutrals and zwitterions.” J. Pharm. Sci. 95(6):1238-57.
3.Poulin, P., Schoenlein, K., et al. (2001). “Prediction of adipose tissue: plasma partition coefficients for structurally unrelated drugs.” J. Pharm. Sci. 90(4): 436-47.
4.Poulin, P. and Theil, F.P. (2000). “A priori prediction of tissue:plasma partition coefficients of drugs to facilitate the use of physiologically-based pharmacokinetic models in drug discovery.” J. Pharm. Sci. 89(1): 16-35.
5.Poulin, P. and Theil, F.P. (2002). “Prediction of pharmacokinetics prior to in vivo studies. 1. Mechanism-based prediction of volume of distribution.” J. Pharm. Sci. 91(1): 129-56.
6.Poulin, P. and Theil, F.P. (2002). “Prediction of pharmacokinetics prior to in vivo studies. II. Generic physiologically based pharmacokinetic models of drug disposition.” J. Pharm. Sci. 91(5): 1358-70.
7.Rodgers, T., Leahy, D., et al. (2007). “Physiologically based pharmacokinetic modeling 1: Predicting the tissue distribution of moderate-to-strong bases.” J. Pharm. Sci.96(11): 3151-3152.
8.Rodgers, T. and Rowland, M. (2007). “Physiologically-based Pharmacokinetic Modeling 2: Predicting the tissue distribution of acids, very weak bases, neutrals and zwitterions.” J. Pharm. Sci. 96(11): 3153-3154.
9.Berezhkovskiy, L.M. (2004). “Volume of distribution at steady state for a linear pharmacokinetic system with peripheral elimination.” J. Pharm. Sci. 93(6): 1628-40.
10.Leo, A., Hansch, C., et al. (1971). “Partition coefficients and their uses.” Chem. Rev. 71(6): 525-616. http://www.cpc.unc.edu/projects/china/
11.Rodgers, T., Leahy, D., et al. (2005). “Physiologically based pharmacokinetic modeling 1: predicting the tissue distribution of moderate-to-strong bases.” J. Pharm. Sci. 94(6): 1259-76.
12.Poulin, P. and Theil, F.P. (2002). “Prediction of pharmacokinetics prior to in vivo studies. 1. Mechanism-based prediction of volume of distribution.” J. Pharm. Sci. 91(1): 129-56.
13.Poulin, P. and Theil, F.P. (2002). “Prediction of pharmacokinetics prior to in vivo studies. II. Generic physiologically based pharmacokinetic models of drug disposition.” J. Pharm. Sci. 91(5): 1358-70.
14.Berezhkovskiy, L.M. (2004). “Volume of distribution at steady state for a linear pharmacokinetic system with peripheral elimination.” J. Pharm. Sci. 93(6): 1628-40.
15.Rodgers, T., Leahy, D., et al. (2005). “Physiologically based pharmacokinetic modeling 1: predicting the tissue distribution of moderate-to-strong bases.” J. Pharm. Sci. 94(6): 1259-76.
16.Rodgers T. and Rowland M. (2006). “Physiologically-based Pharmacokinetic Modeling 2: Predicting the tissue distribution of acids, very weak bases, neutrals and zwitterions.” J. Pharm. Sci. 95(6):1238-57.
17.Rodgers, T., Leahy, D., et al. (2007). “Physiologically based pharmacokinetic modeling 1: Predicting the tissue distribution of moderate-to-strong bases.” J. Pharm. Sci.96(11): 3151-3152.
18.Rodgers, T. and Rowland, M. (2007). “Physiologically-based Pharmacokinetic Modeling 2: Predicting the tissue distribution of acids, very weak bases, neutrals and zwitterions.” J. Pharm. Sci. 96(11): 3153-3154.
19.Poulin, P. and Theil, F.P. (2002). “Prediction of pharmacokinetics prior to in vivo studies. 1. Mechanism-based prediction of volume of distribution.” J. Pharm. Sci. 91(1): 129-56.
20.Poulin, P. and Theil, F.P. (2002). “Prediction of pharmacokinetics prior to in vivo studies. II. Generic physiologically based pharmacokinetic models of drug disposition.” J. Pharm. Sci. 91(5): 1358-70.
21.Assmus, F., Houston, J.B., et al. (2017). “Incorporation of lysosomal sequestration in the mechanistic model for prediction of tissue distribution of basic drugs.” Eur. J. Pharm. Sci. 109: 419-430.
22.Rodgers, T., Leahy, D., et al. (2005). “Physiologically based pharmacokinetic modeling 1: predicting the tissue distribution of moderate-to-strong bases.” J. Pharm. Sci. 94(6): 1259-76.
23.Rodgers, T., Leahy, D., et al. (2007). “Physiologically based pharmacokinetic modeling 1: Predicting the tissue distribution of moderate-to-strong bases.” J. Pharm. Sci.96(11): 3151-3152.