Tutorial: User Defined Permeability Correlations
In this tutorial, we will cover:
Creating your own correlations using the User-Defined Permeability Correlation feature in GastroPlus® and saving them as a template
To create a correlation between in vitro Papp and in vivo human Peff you will need Papp measurements for some of the standard (“BCS”) compounds – we suggest at least ten compounds covering a range of low to high permeability. Once the correlation is built, it can be exported or saved as a template for use in future projects.
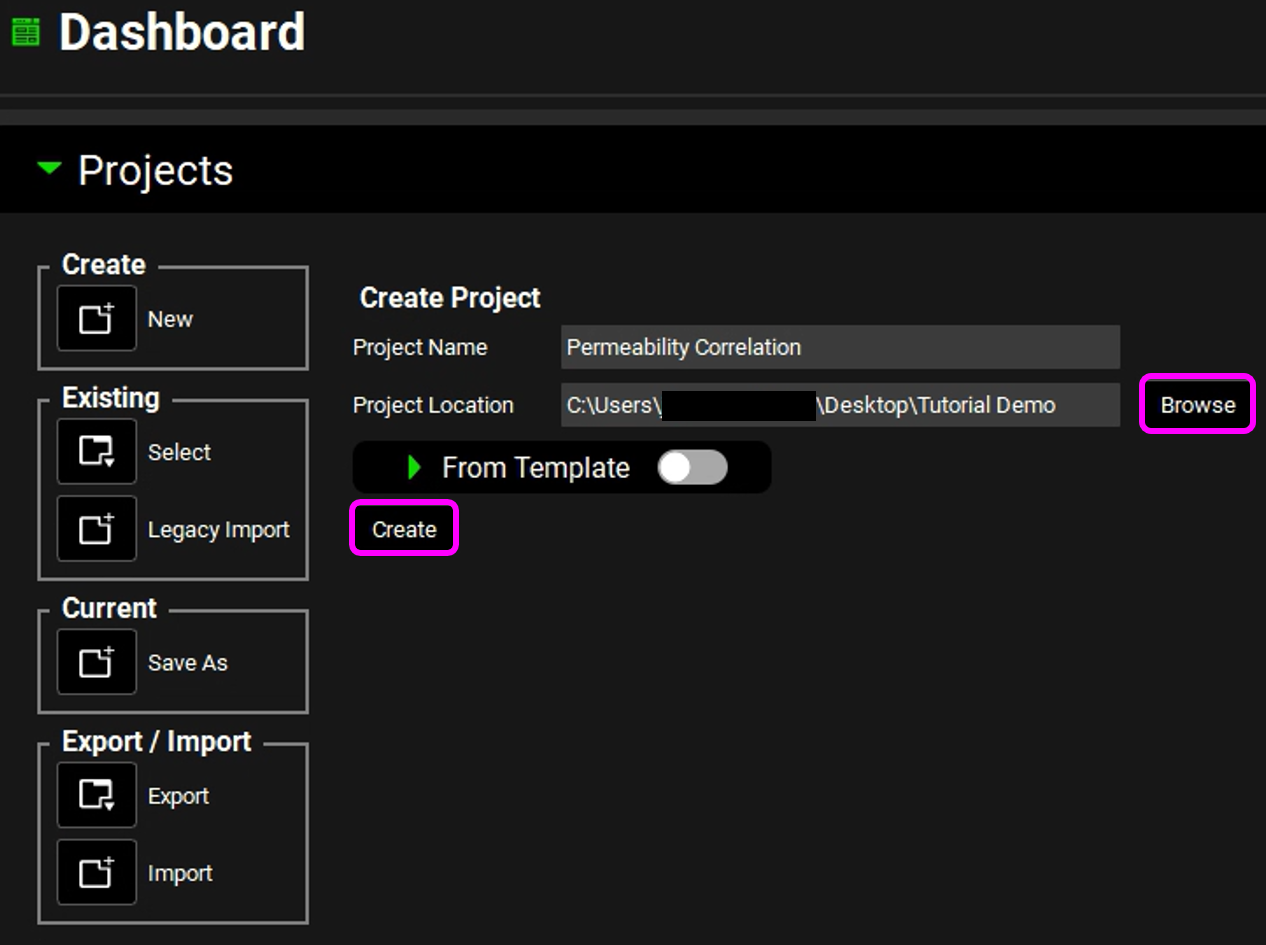
Open GPX™ and, in the Dashboard view, click on the icon next to New to create a new project.
Type in the Project Name “Permeability Correlation” and via Browse navigate to/add a folder to save the project.
Click on Create.
Click on the Compounds view.
Click on Add.
Type "Drug" then click on OK (or press Enter).
Expand the Permeability panel (by double clicking on the panel or clicking on the green arrow.), scroll down, and expand the User-Defined Permeability Correlation sub-panel.
Click on Add and type “Sample Caco-2 Data” and then click on OK (or press Enter).
Save the project and click on OK.
Click on Load from Defaults. This will populate the table with a set of compounds with known human Peff values ("Human Permeability”). When building your own correlation, if you have both in vitro Papp and in vivo Human Peff data for additional compounds, you can add rows to the table by clicking “Add”.
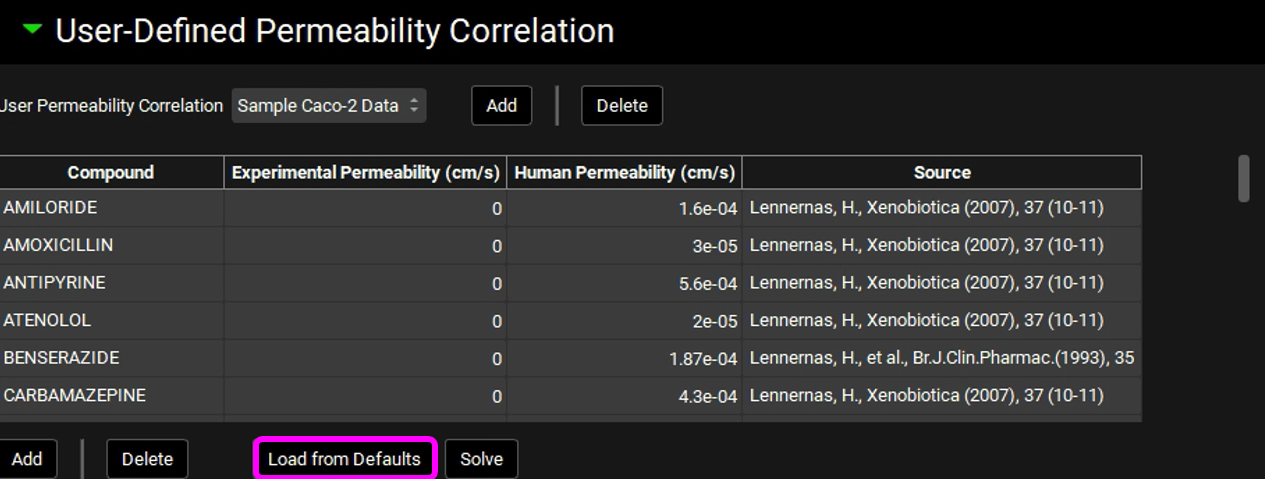
Enter the in vitro Papp data (“Experimental Permeability”) for the following compounds. This is sample data from Caco-2 permeability studies. Note that the table has units of cm/s, hence the scale of these values (e-5 cm/s). Also note that when using your own data, a minimum of three data points is required.
Amoxicillin 0.8e-5
Antipyrine 28.2e-5
Atenolol 0.2e-5
Cephalexin 0.5e-5
Cimetidine 0.74e-5
Desipramine 21.6e-5
Furosemide 0.12e-5
Hydrochlorothiazide 0.51e-5
Metoprolol 23.7e-5
Naproxen 39.5e-5
Piroxicam 35.6e-5
Propranolol 41.9e-5
Ranitidine 0.49e-5
Terbutaline 0.38e-5
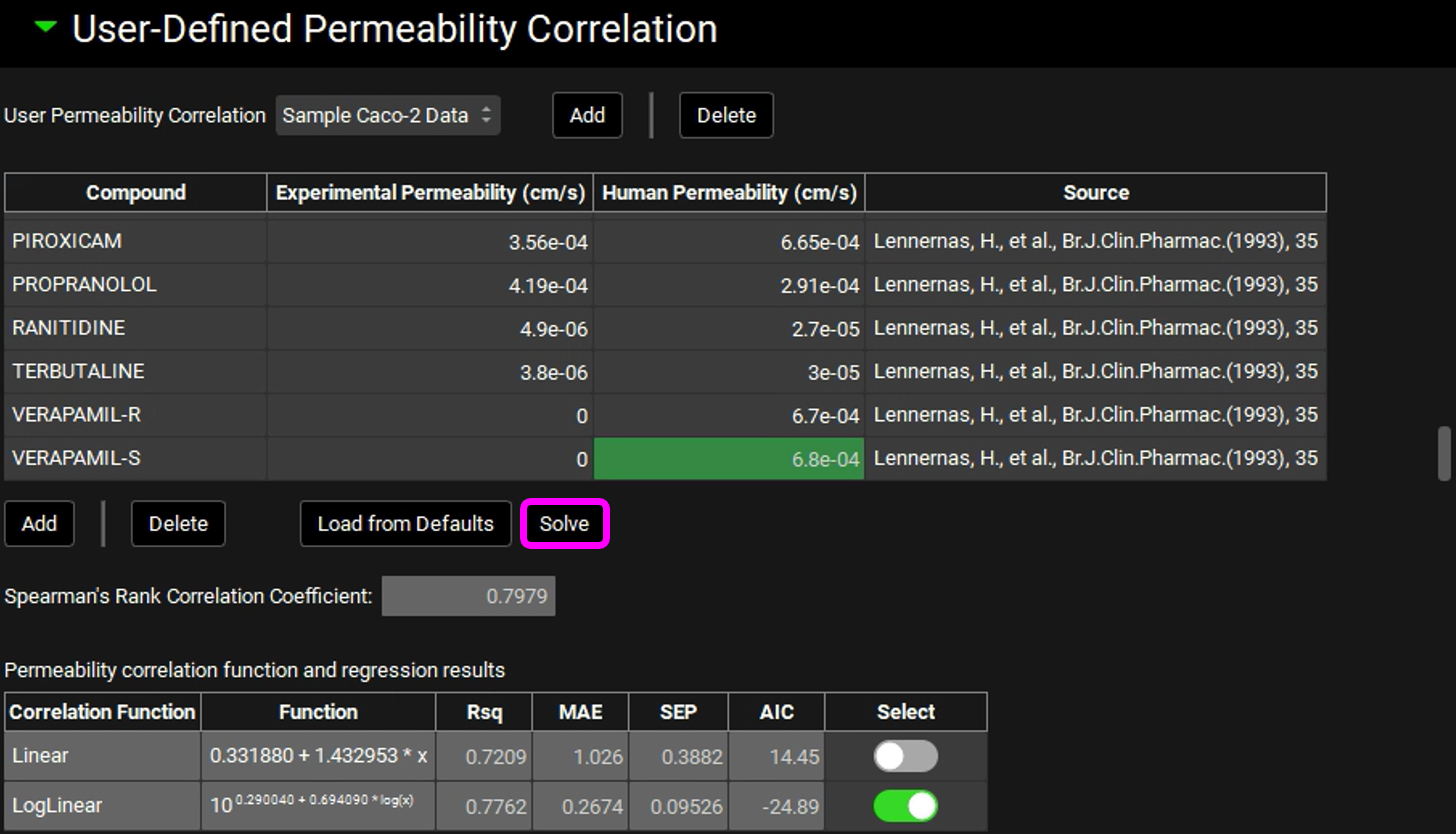
Leave the Papp as 0 for all other compounds, these will be ignored when solving for the correlation equation.Click on Solve. Once the correlations have been created, the Rsq, Mean Absolute Error (MAE), Standard Error of the Prediction (SEP) and Akaike Information Criterion (AIC) values will be displayed for each fitted equation. The equation with the lower AIC will be automatically selected.
Save the project and click on OK. The correlation is now saved, and ready to be exported or saved to a template.
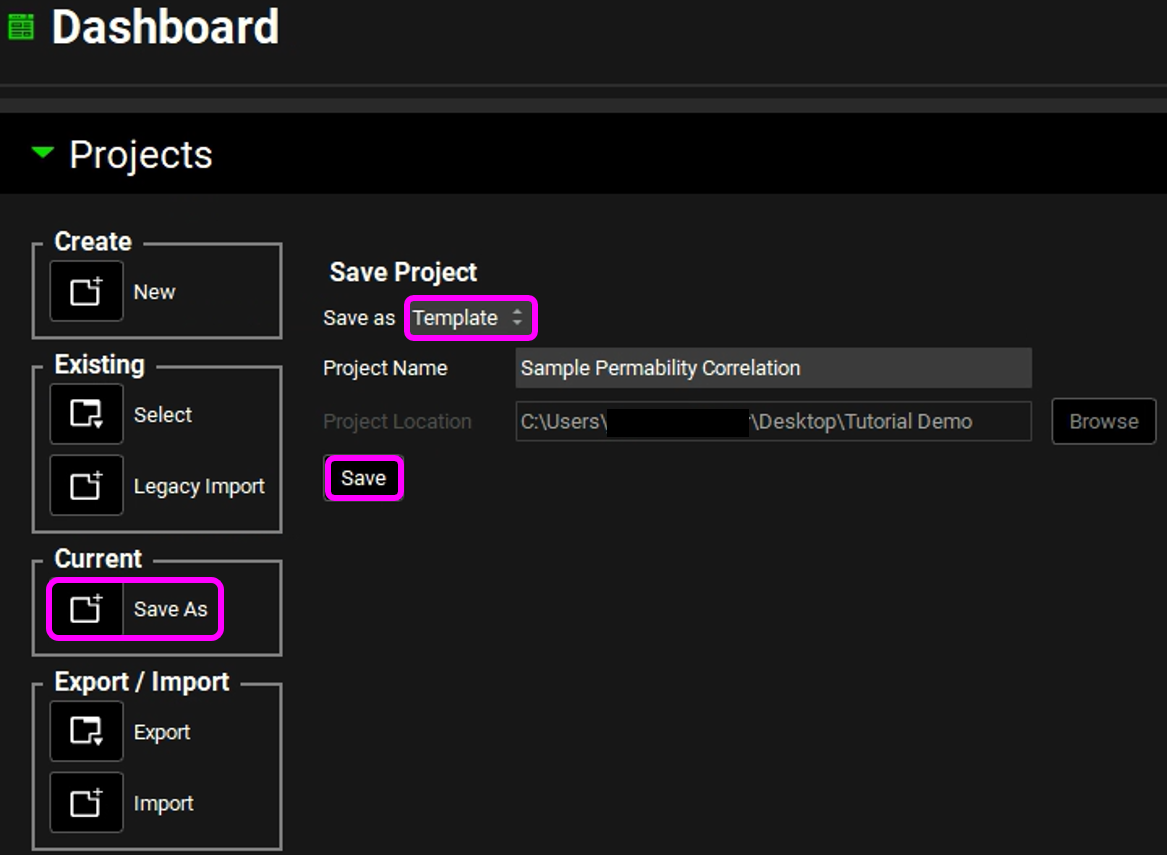
Navigate to the Dashboard View and click on the icon next to Save As.
From the dropdown, select “Template”, and enter a name for the template, such as “Sample Permeability Correlation”. You do not need to select a location when saving templates.
Click the “Save” button below the Project Name to save the template.
The template is saved and ready to be used for future projects. A message stating that the template has been created will be displayed in the Message Center.
Note that you can also use the Asset Export functionality to export the compound with the user-defined permeability correlation. It can then be imported into existing projects for use in those projects. See GPX™ Reusability: Asset Export and Import for more information on exporting and importing assets in GPX™.
Using GastroPlus® permeability correlations to convert between measured and simulated permeability
Open GPX™ and, in the Dashboard view, click on the icon next to New to create a new project.
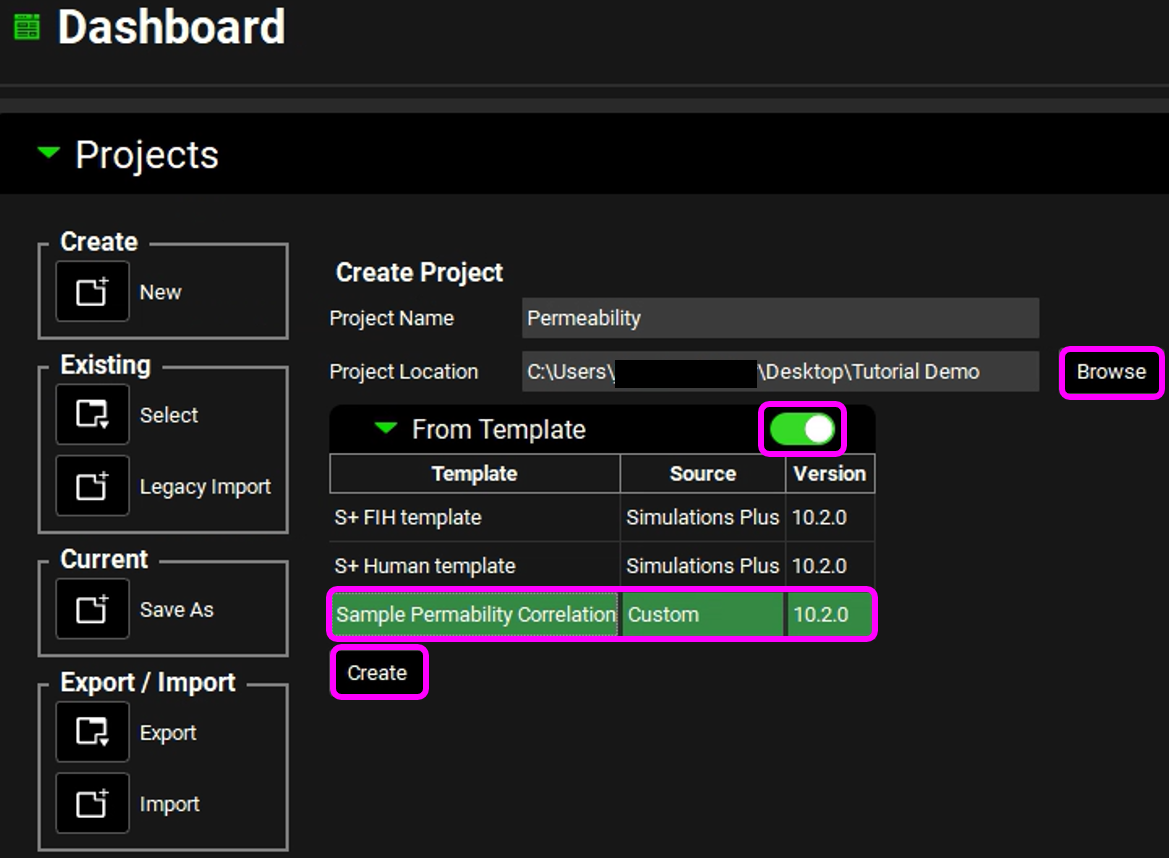
Type in the Project Name “Permeability” and via Browse navigate to/add a folder to save the project.
Set the “From Template” toggle to ON. Select the “Sample Permeability Correlation” template from the previous tutorial.
Click on Create.
Click on the Compounds view.
Note that the compound (“Drug”) from the previous tutorial has been included with the template. This can be considered a placeholder compound for importing the user-defined permeability correlation. The user-defined permeability correlation will still be available for all compounds in this project, and this compound can be ignored.
Click on Add to add a new compound.
Type "Compound X" then click on OK (or press Enter).
At this point, the placeholder “Drug” compound can be deleted from the project. The user-defined permeability correlation will still be available for use with “Compound X”. To delete “Drug”, select it from the dropdown at the top of the compound View, and click the Delete button.
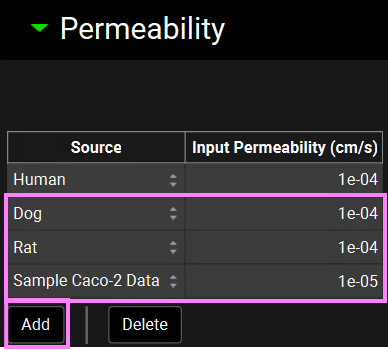
With “Compound X” selected, scroll down, and expand the Permeability panel.
Click on Add, change the source to Dog and enter a value of 1.0e-4 cm/s.
Click on Add, change the source to Rat and enter a value of 1.0e-4 cm/s.
Click on Add, change the source to Sample Caco-2 Data and enter a value of 1.0e-5 cm/s. This is the correlation created in the previous tutorial. Note that here the scale is e-5 cm/s, which is the same as the original data used to create this correlation.
Save the project and click on OK.
Click on the Dosing view.
Expand the Formulations panel.
Click on Add.
Type "Tablet" then click on OK (or press enter).
Expand the Dosing Schedules panel.
Click on Add.
Type "100mg Tablet" then click on OK (or press Enter).
Save the project and click on OK.
Click on the Physiologies view.
Click on Add.
Type "Human" for the Physiology name, ensure the Species is set to Human, then click on OK (or press Enter).
Click on the Pharmacokinetics view and expand the Compartmental panel to review the pharmacokinetic model.
Save the project and click on OK.
Click on the Simulations view.
Click on Add.
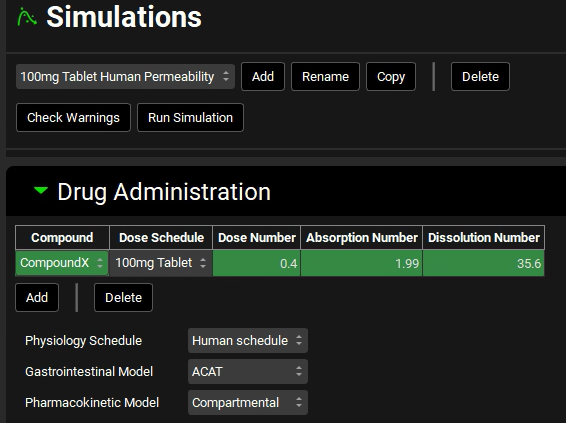
Type "100mg Tablet Human Permeability" then click on OK (or press Enter).
Expand the Drug Administration panel and check the Compound is “Compound X”, the Dose Schedule is “100mg Tablet, and the Physiology Schedule is “Human Schedule”.
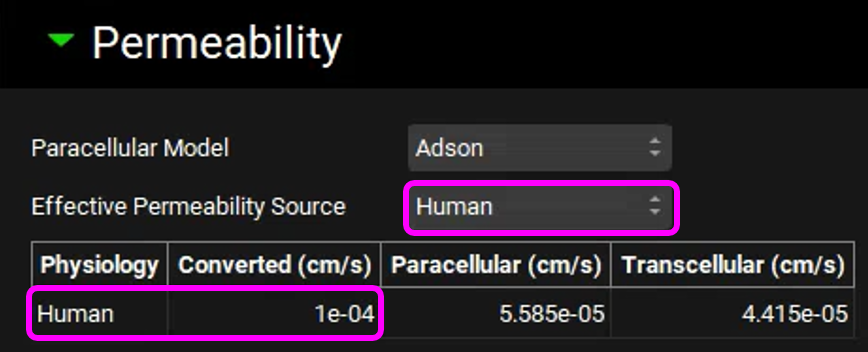
Expand the Compound Settings panel, scroll down, and expand the Permeability sub-panel. Check that the Effective Permeability Source is “Human”. Note that the Physiology is also set to Human, indicating that the source permeability is being converted to a Human Peff for the simulation. Because both the input source and the target species are Human, no conversion is needed, and the Converted Peff is the same as the input value (1e-4 cm/s).
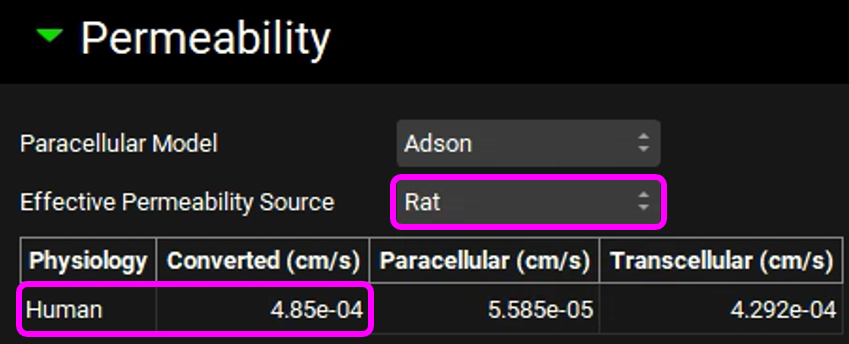
Copy the simulation, type “100mg Tablet Rat Permeability”, click on OK and set the Effective Permeability Source to “Rat”. Note that the converted human permeability is higher than 1.0e-4 cm/s.
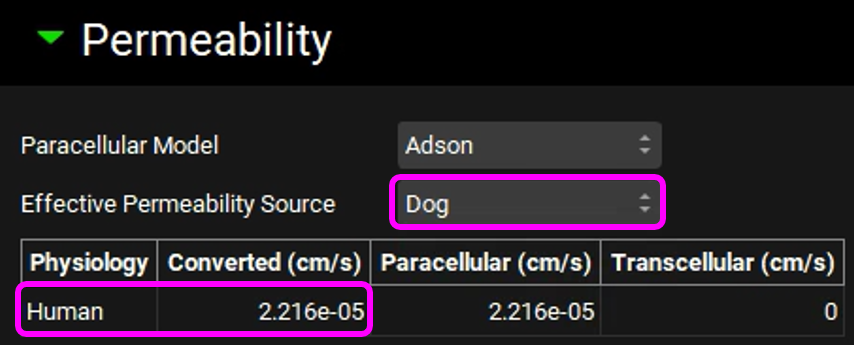
Copy the simulation, type "100mg Tablet Dog Permeability", click on OK and set the Effective Permeability Source to "Dog". Note that the converted human permeability is lower than 1.0e-4 cm/s.
Review the message and then click on Done.

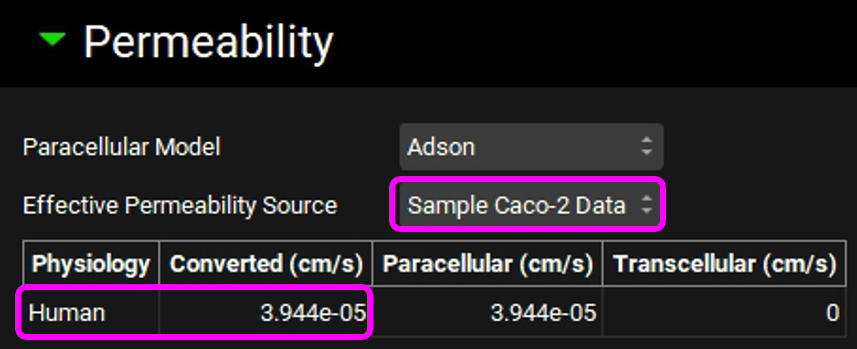
Copy the simulation, type "100mg Tablet Sample Caco-2 Permeability", click on OK and set the Effective Permeability Source to "Sample Caco-2 Data". Note that the converted human permeability is also lower than 1.0e-4 cm/s.
Review the message and then click on Done.
Save the project and click on OK.
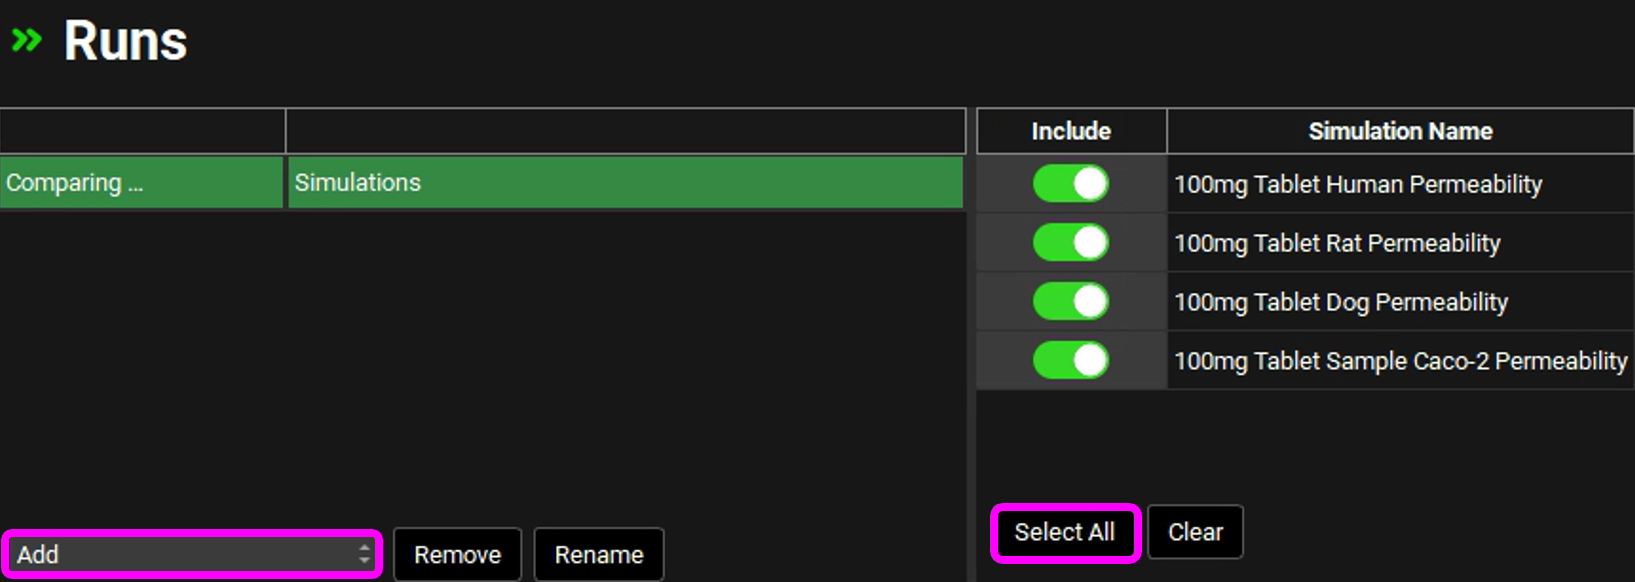
Navigate to the Runs view, click Add, select Simulations, enter "Comparing Permeabilities" as the Run name and click on OK.
Press the Select All button underneath the Simulation Names on the right-hand side of the interface.
Save the project and click on OK.
Minimize the Output Settings panel and press Start in the Run Controls panel.
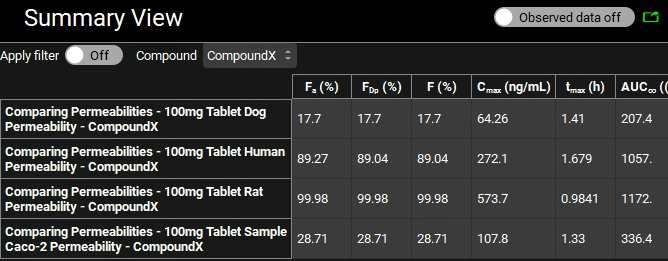
When the Run has completed, the program switches automatically to the Analysis view where you can assess the differences in the Cp-Time plots for the different permeabilities.
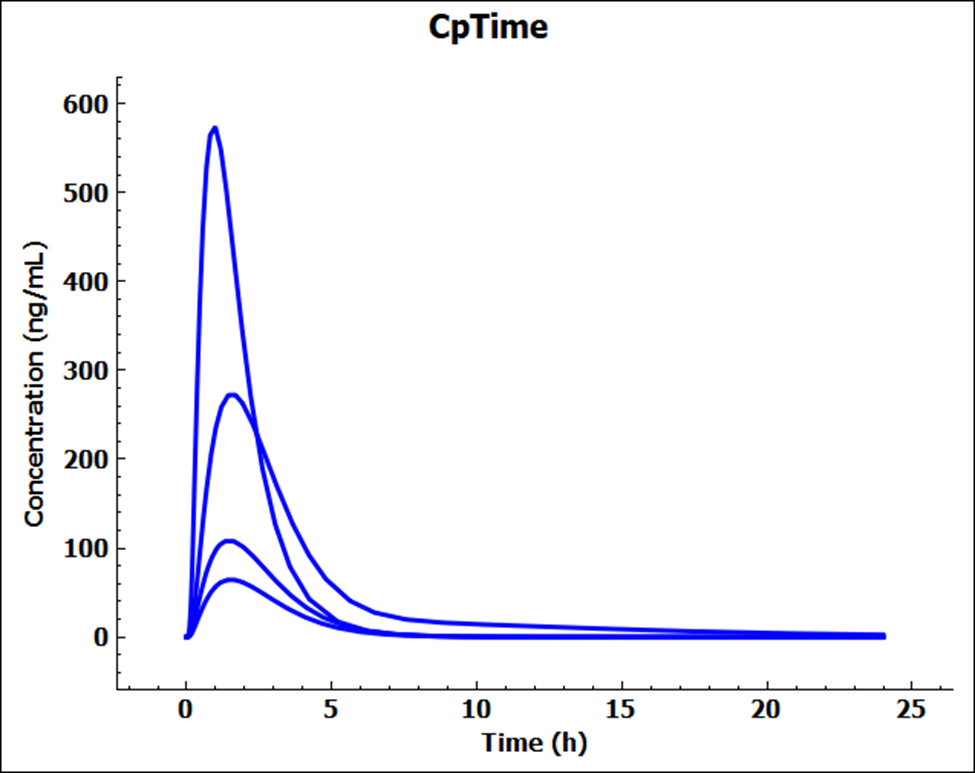
Switch the Mode to Summary View and click the Observed data on toggle to change this to off and remove the empty observed data columns from the summary table. Confirm that the Fa (%) are in keeping with the permeabilities i.e. Rat > Human > Sample Caco-2 > Dog.