
The Data Extractor is an AI-powered table and plot digitizer within the GastroPlusGPT™ suite. It enables users to extract structured, machine-readable data from images of tables and plots, automating the digitization process of scientific and pharmacokinetic data.
Key Features
|
Feature |
Description |
|
Table Detection |
Automatically identifies tabular data from image files, supporting multi-row headers and scientific formatting. |
|
Plot Digitization |
Extracts (x, y) data pairs from curves, including legends and axis units when visible. |
|
Unit Recognition |
Parses scientific units (e.g., µg·mL⁻¹, h, min) from axis labels or footnotes. |
|
Curve Reconstruction |
Visual preview of extracted plot data with smooth rendering of line styles, markers, and grouping. |
|
Output Format Selection |
Choose between long or wide data representation based on intended downstream use. |
|
Editing Capability |
Preview and edit extracted values inline prior to export. |
|
Multi-format Export |
Supports download as .TXT and .JSON files for analysis, storage, or manual review. |
Note: This tool processes only one image at a time. You must download results before clearing, exiting or refreshing the page, as session data does not persist.
Getting Started
-
Launch the GastroPlusGPT™ interface in your web browser via this link: GastroPlusGPT™.
-
To request login credentials, please click on the “Sign up to request access” button on the landing page.
-
-
Select GastroPlusChat™ from the sidebar menu on the left.
-
You will see the initial interface, where you can upload an image file of your plot or table
Initial interface of Data Extractor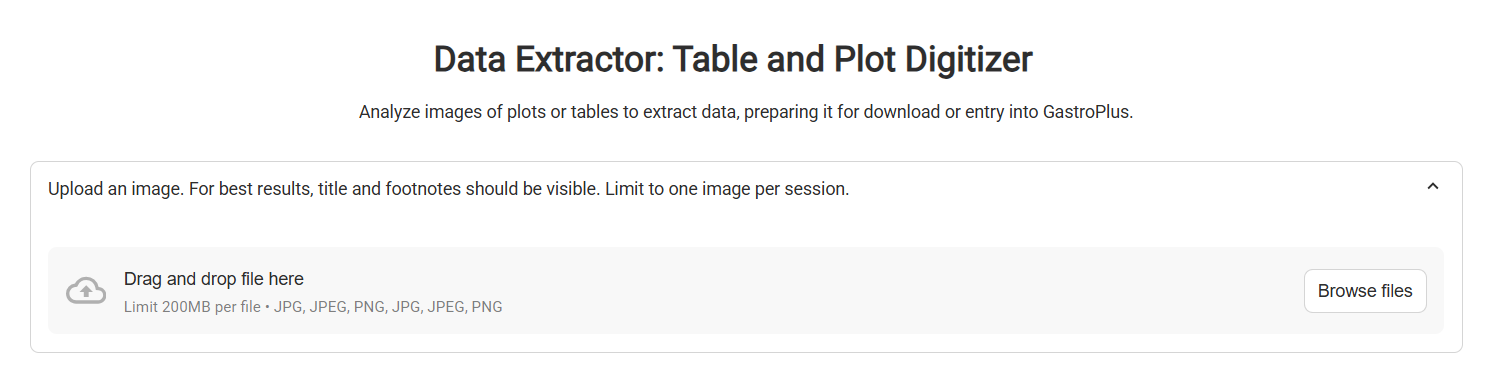
|
Input/Option |
Description |
|---|---|
|
File Upload Widget |
The upload widget where an image file of a table or plot can be uploaded. A file can be drag-and-dropped into this widget, or selected in file explorer by clicking the “Browse Files” button. |
-
Click Browse files or drag and drop your image into the upload area.
-
Once uploaded, the image preview is displayed along with the file name and size. A description of the image is also provided.
Data Extractor, with example plot uploaded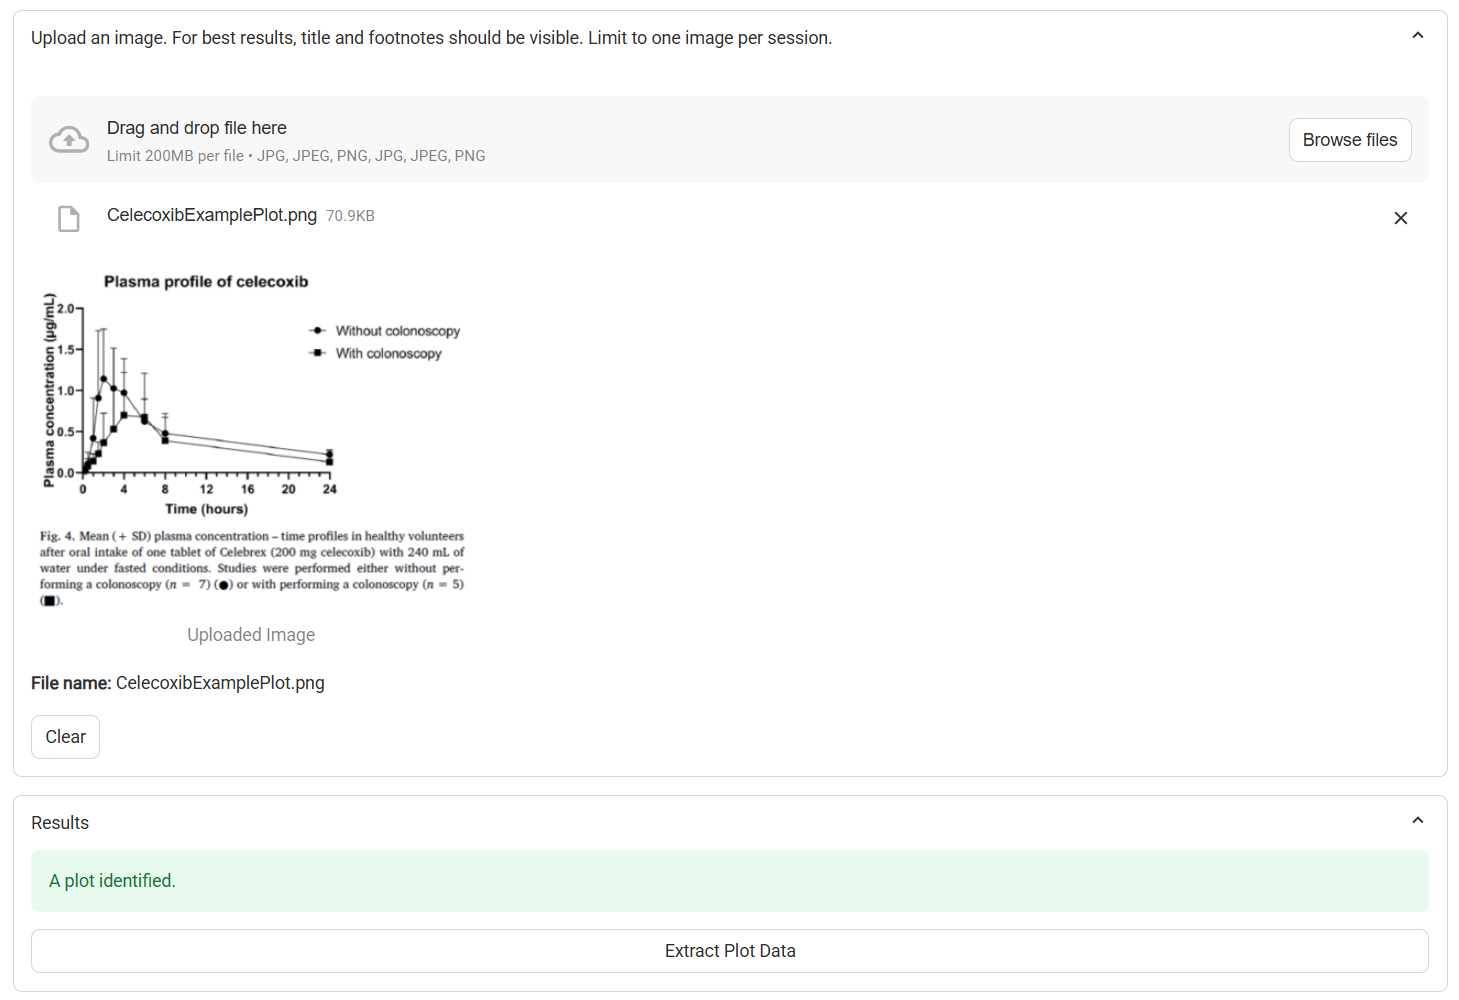
Data Extractor, with example table uploaded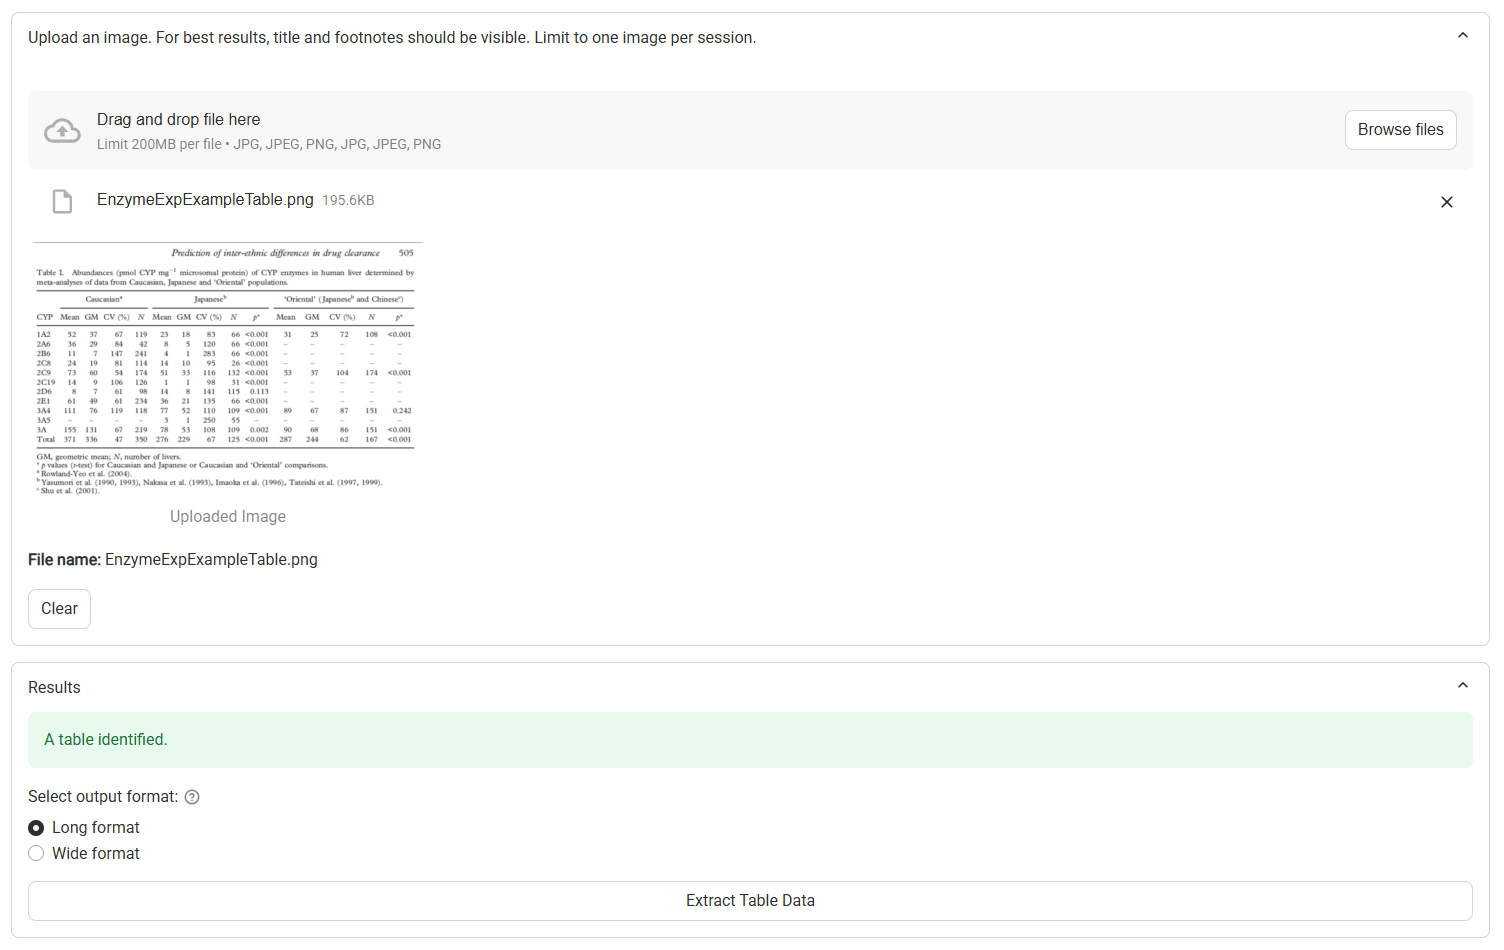
|
Input/Option |
Description |
|---|---|
|
Clear |
Clears the uploaded file, as well as any extracted data |
|
Image Identification Results |
Provides a description of the image, including whether a plot or a table has been identified. If any errors in image processing occur, they will be described here. |
|
Extract Plot Data |
A button. Proceeds to process the plot image and extract the data. Visible only when a plot is identified. |
|
Extract Table Data |
A button. Proceeds to process the table image and extract the data. Visible only when a table is identified. |
|
Long Format and Wide Format |
Radio buttons. Selects whether the table data will be extracted in a long or a wide format (see below) Visible only when a table is identified. |
Extracting Plot Data
-
Click on the Extract Plot Data button
-
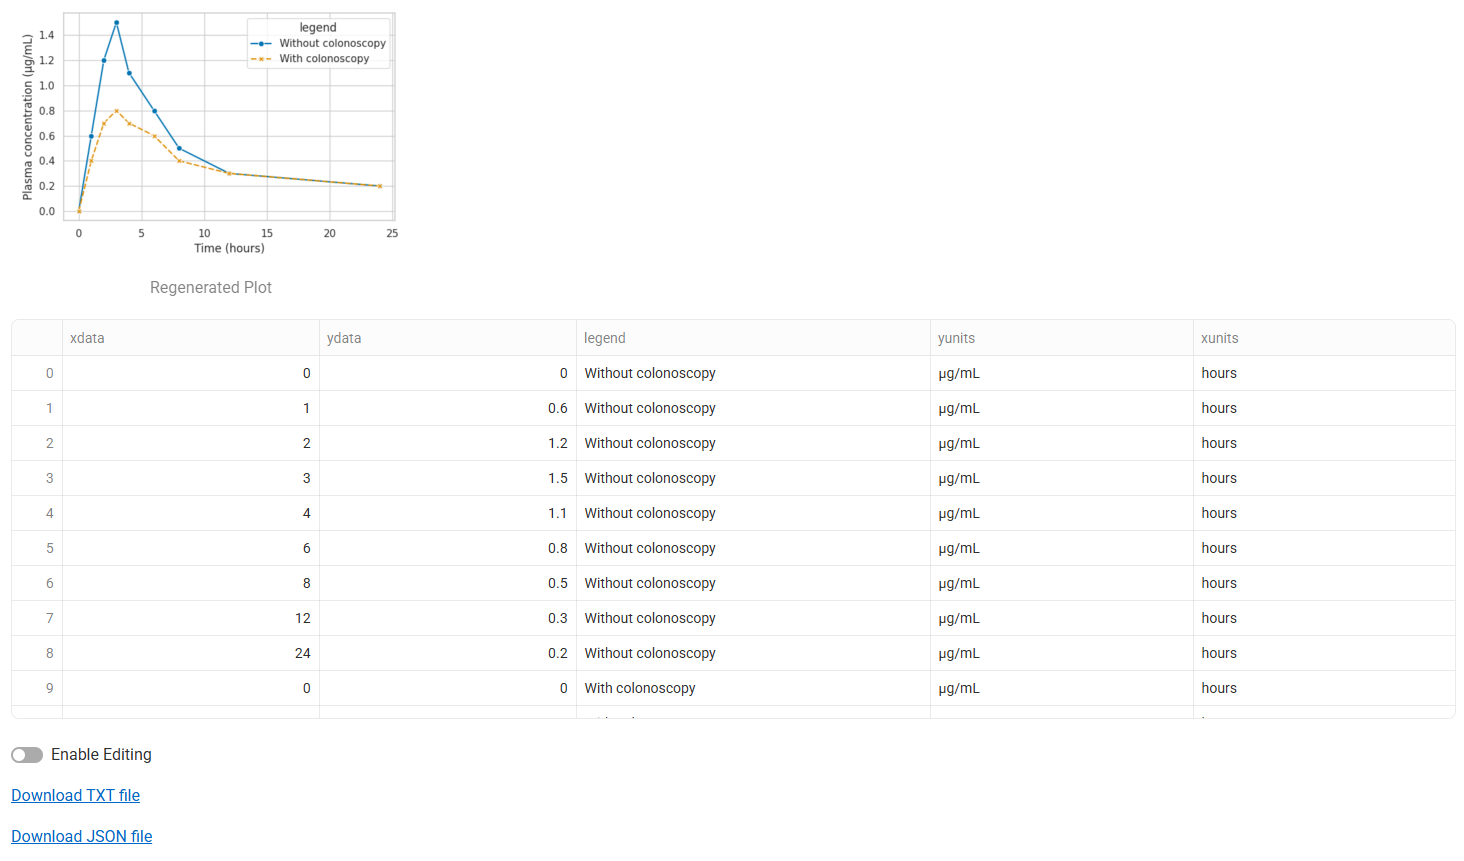
A reconstructed plot using the extracted data will be displayed. Confirm that this matches expectations. If it appears that the extracted data does not match the original data, you can click on Extract Plot Data again to reprocesses the image. Note that the axis ranges may change slightly.
-
Below the plot, the extracted data will be displayed in a table. If there are multiple series in the plot, they will be displayed sequentially and can be distinguished using the Group Identifier in the “legend” column. The data can be edited for QA purposes or downloaded in txt or json format.
|
Outputs |
Description |
|---|---|
|
xdata |
Column containing extracted X-axis values (e.g., time). |
|
ydata |
Column containing extracted Y-axis values (e.g., concentration). |
|
legend |
Identifies the series to which the point belongs (e.g., test, reference). |
|
xunits and yunits |
The units for the x and y values, parsed from the image axis labels (e.g. h and ng/mL). |
|
Input/Option |
Description |
|---|---|
|
Enable Editing |
A toggle. Selects whether or not the data in the table can be edited for manual QA. OFF by default. |
|
Download TXT file |
A button. Downloads the extracted data as a tab-delimited text (.txt) file |
|
Download JSON file |
A button. Downloads the extracted data as a json-formatted structured data (.json) file |
Extracting Table Data
-
Choose the output format:
-
Long Format:
-
Each observation occupies one row.
-
Includes metadata columns (e.g., dose, subject ID, parameter).
-
-
Wide Format:
-
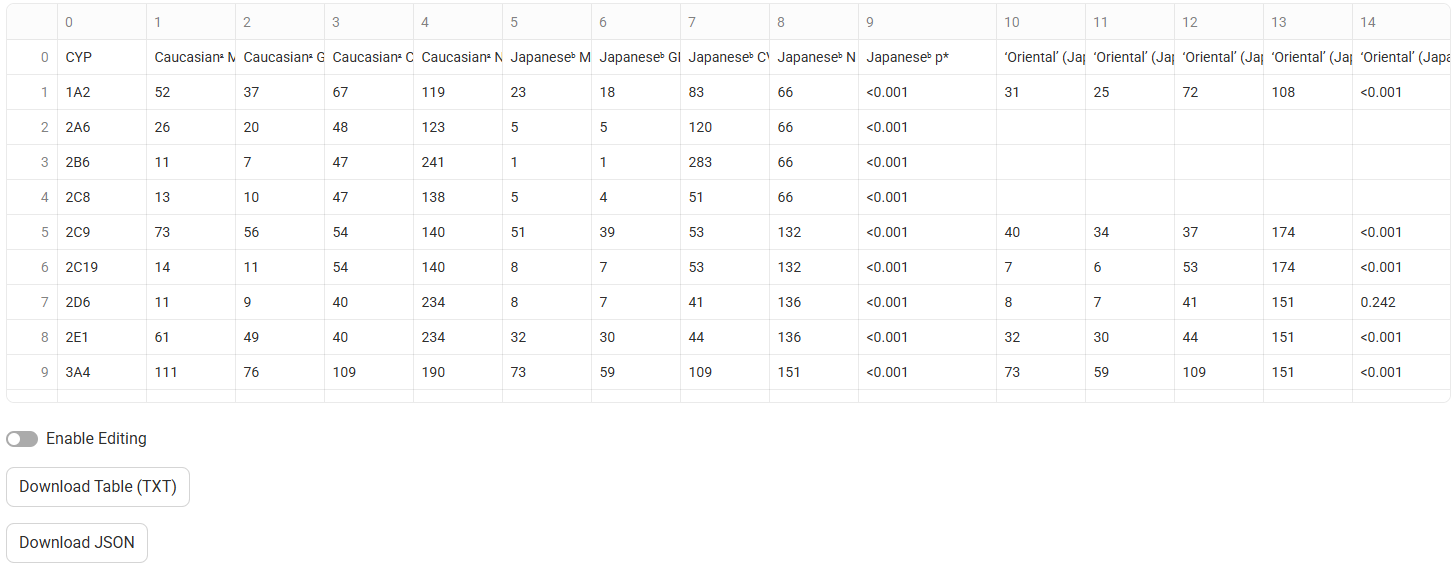
Preserves the native structure from the original image.
-
Preserves the detected headers. These headers are treated as cell values.
-
Best for review or documentation purposes.
-
-
-
Click on the Extract Table Data button
-
The extracted data will be displayed in a table below. If Wide Format was selected, the columns and rows in the extracted table should match those in the original table. If long format was selected, additional metadata columns will be present.
|
Input/Option |
Description |
|---|---|
|
Enable Editing |
A toggle. Selects whether or not the data in the table can be edited for manual QA. OFF by default. |
|
Download Table (TXT) |
A button. Downloads the extracted data as a tab-delimited text (.txt) file |
|
Download JSON |
A button. Downloads the extracted data as a json-formatted structured data (.json) file |
Tips for Optimal Results
-
High resolution matters: Upload clear, well-scanned, or high-DPI images.
-
Retain full figure context: Include axis titles, legends, footnotes, and table captions where possible.
-
Avoid distortions: Skewed, rotated, or compressed images may lead to inaccurate extraction.
-
Monochrome or high-contrast plots digitize more accurately than shaded or noisy ones.
-
Edit before export: Use the built-in preview to validate or correct data as needed.
Limitations
While AI dramatically improves speed and accessibility, users must be aware of certain limitations in accuracy and structure, especially in cases involving poor image quality or non-standard formatting.
|
Area |
Limitation |
|
Session Persistence |
Session data is not saved after refresh or exit. |
|
Single File Only |
One image per session is supported. |
|
OCR Inaccuracy |
Handwritten or stylized text may not be recognized correctly. |
|
Structural Guessing |
Tables with merged cells or inconsistent formatting may yield flawed output. |
|
Plot Complexity |
3D charts, bar graphs, shaded areas, and heatmaps are not currently supported. |
|
No Automated Validation |
Extracted values are not auto-checked against known standards or ranges. |
|
Plot: unnecessary extrapolation |
Unnecessary extrapolation may occur if the AI overextends curves beyond visible data points. |
|
Plot: under or overprediction of exposure points |
Incorrect detection of the number of exposure points may occur, especially in overlapping or densely packed curves. |
Output File Format Overview
|
Format |
Description |
Ideal Use |
|
TXT |
Tab-separated plain text file |
Import into Excel, R, Python |
|
JSON |
Structured data object with nested fields |
Use in scripts, APIs, or database entries |
Each file includes full column headers and, where possible, retains units and metadata.