
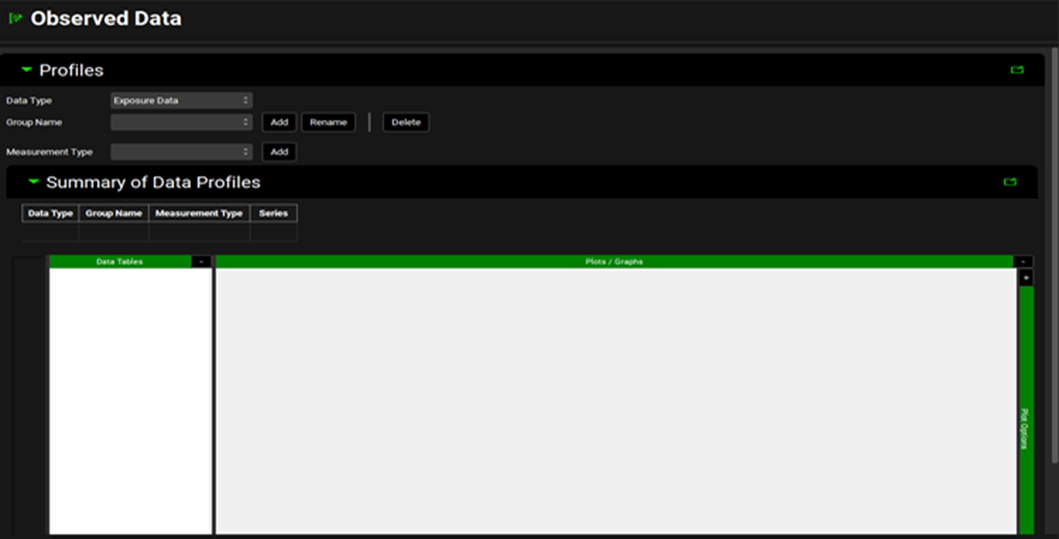
The Observed Data view has two panels, the Profiles panel and the Parameters panel. The Summary of Data Profiles sub-panel is under the Profiles panel.
Profiles Panel
Observed Data view, Profiles panel
|
Input/Option |
Description |
|
Data Type |
Choose the data type from the drop-down list accessed by clicking in the box next to “Data Type”. Exposure Data is selected by default. Options are Chemical Degradation Rate, Dissolution Rate (Z Factor), Exposure Data, Immune Cell Layer Thickness, In Vitro Dissolution Release, In Vivo Controlled Release, Inflammation, Particle Size Distribution, Pharmacodynamic Effect, Precipitation Time, and Solubility. |
|
Group Name |
The name of the observed data set. Click “Add” and type the desired name in the dialogue box. Groups are used to group together related series of data and are for organizational purposes. Note: Observed exposure data is linked to a simulation at the Group level and one Group can be linked per simulation (see Observed Data sub panel). Click “Rename” if the Group Name needs to be changed and “Delete” to delete the Group. This will delete all series associated with this Group. |
|
Measurement Type |
Choose the measurement type from the drop-down list accessed by clicking in the box next to “Measurement Type”. The options available vary according to the Data Type selected. Once the correct type has been selected, click “Add” and input the name of your series. Note 1: Multiple series can be added to a single Group by adding a second Measurement of either the same or a different type and entering a different series name. |
Note that for the Particle Size Distribution Data Type, particle radius (in µm, nm or mm) is used, not particle size or diameter.
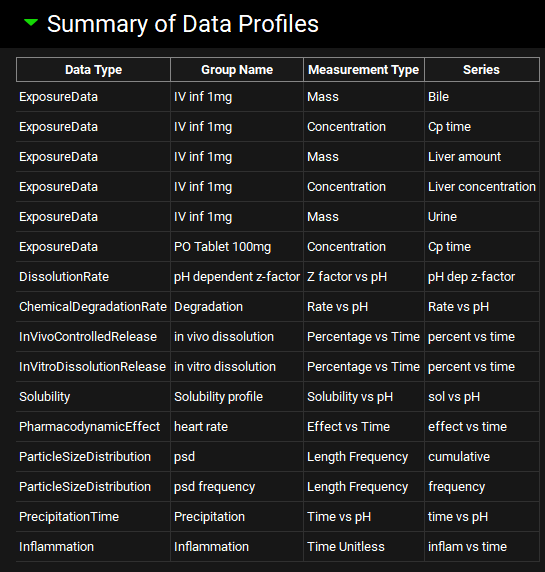
Summary of Data Profiles sub-panel
Once the series name has been inputted, the Data Type will be added to the Summary of Data Profiles table. This forms a record of all the Observed Data series that are available in the project. Multiple series can be added to a single Group by adding a second Measurement and entering a different series name.
Observed Data view, Profiles panel, Summary of Data Profiles sub-panel
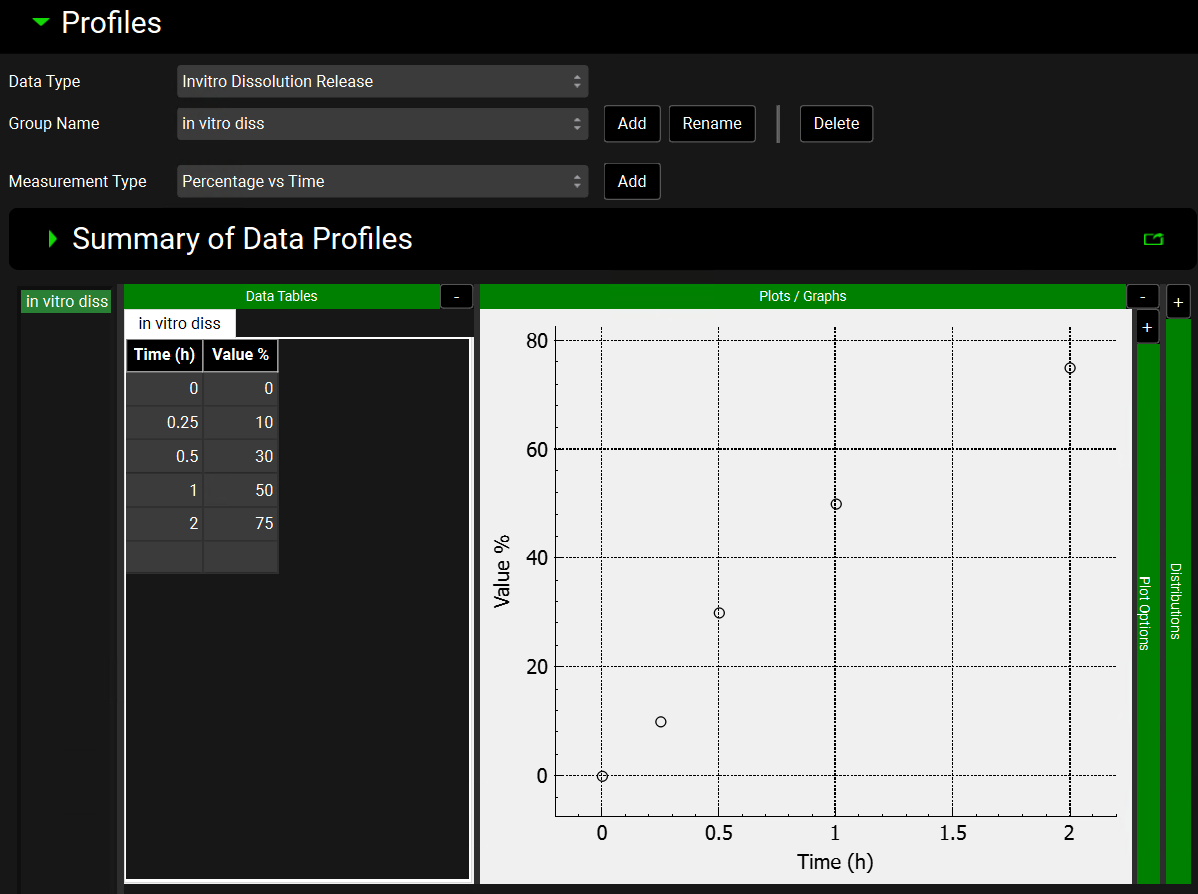
The Data Tables and Plots/Graphs are located below the Summary of Data Profiles table. The Data Tables is where the Observed Data is inputted. This can be typed in or pasted by right-clicking in the first cell. For some Measurement Types the units can be altered by clicking on the default unit in the column header and selecting the preferred option from the drop-down list. For Exposure Data and Pharmacodynamic Effect Data Types, the coefficient of variation (CV%) can also be inputted.
The units should be adjusted before entering the Observed Data. If the units are adjusted once the Observed Data has been populated, the data will be converted to the newly selected unit.
The Observed Data series is displayed in the plot. Hovering over the series name to the left of the Data Table joins the points on the plot. Series can be selected or deselected by clicking on the series name to the left of the Data Table. To select multiple series for display, use the Windows [CTRL]+Click keyboard shortcut.
To delete or rename a series, right click on the series name to the left of the Data Table and select Delete Selected or Rename Selected from the menu.
Plot formatting options are accessed by expanding the Plot Options using the “+” at the top of the green bar. Depending on the Observed Data Type, a Distribution option may be available to the right of the Plot Options bar. These are discussed below in Observed Data view, Profiles panel, Distribution options.
Observed Data view, Profiles panel, Data Tables and Plot
Observed Data view, Profiles panel, Distribution options
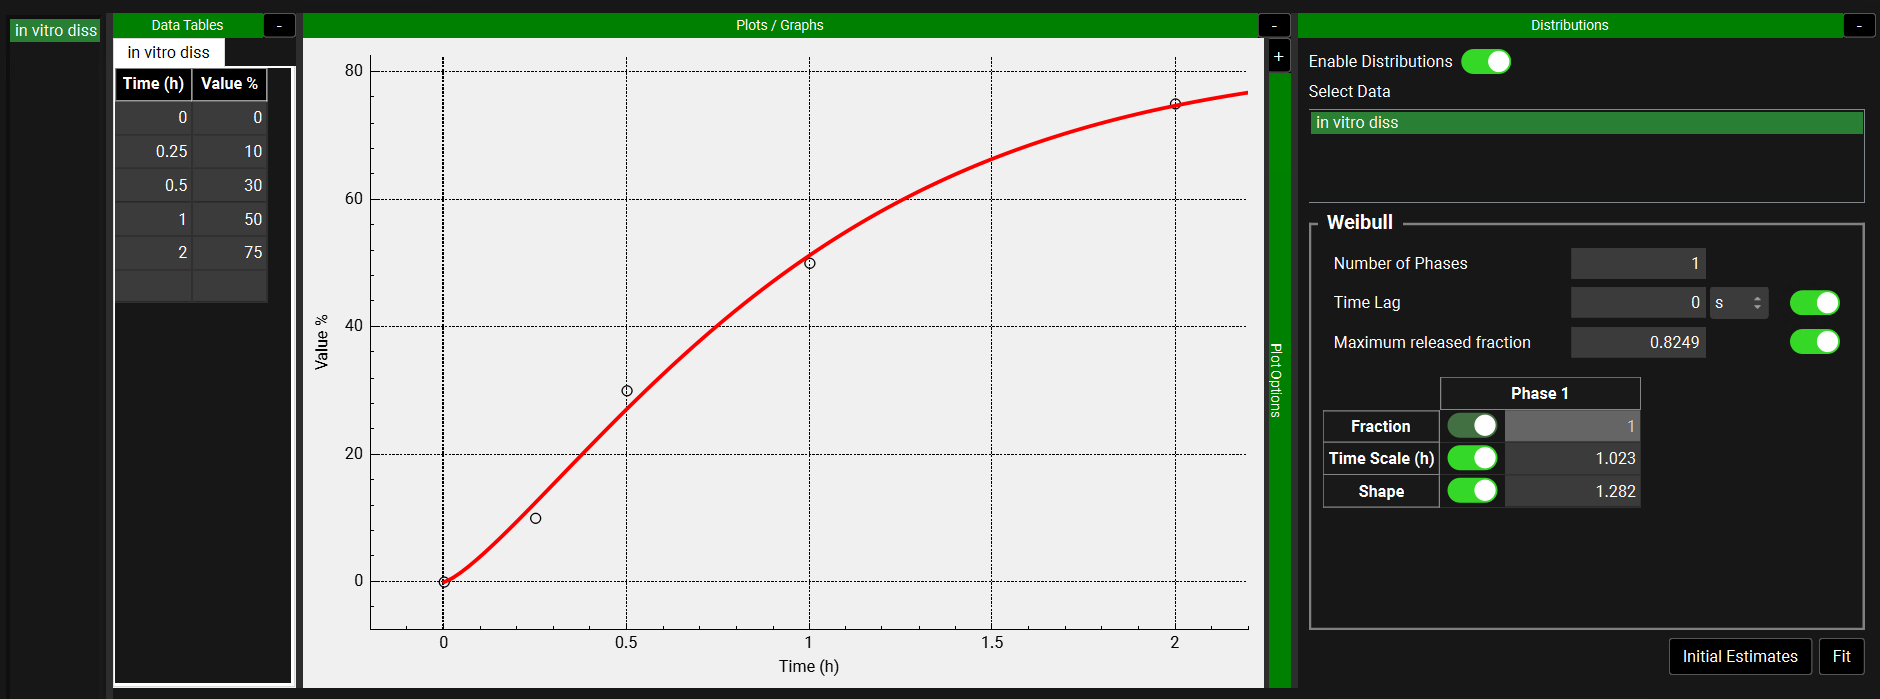
When the Observed Data Type is In Vitro Dissolution Release, In Vivo Controlled Release, or Particle Size Distribution, options for fitting a Distribution can be expanded using the “+” at the top of the green Distribution bar. When the Enable Distributions toggle is turned on, the series names for the selected Observed Data Group are available to be selected by clicking. Click a second time to deselect. The distribution is fitted to all the series that have been selected.
When the Data Type is In Vitro Dissolution Release or In Vivo Controlled Release, a Weibull distribution can be fitted.
Observed Data, Profiles panel, Distribution options for In Vitro Dissolution Release or In Vivo Controlled Release Data Types
|
Input/Option |
Description |
|
Number of Phases |
Enter 1, 2, or 3 to define the distribution as a Single-, Double-, or Triple- Weibull function, respectively. |
|
Time lag |
Value defining the time prior to drug release. Both the value and the units (hours, seconds or minutes) can be changed. For time values less than the lag time, % released values of zero are returned. For time values greater than or equal to the lag time, values are specified by the Weibull function. To enable this parameter to be fitted, turn the toggle on. |
|
Maximum released fraction |
Value defining the maximum amount of drug released, as a fraction of the total drug load. To enable this parameter to be fitted, turn the toggle on. |
|
Parameter table |
Displays the Weibull parameters, with a column for each phase, along with a toggle indicating whether that parameter will be fitted. If the toggle is on (showing green) the parameter will be fitted.
All values can be edited. |
|
Initial Estimates |
A button. Finds a suitable set of starting values for the fitting of Weibull parameters assuming a Single-Weibull function. The line is visible on the plot as a solid red curve and indicates the distribution utilizing these values. |
|
Fit |
Fits the Weibull parameters, for those parameters with an active toggle. The fitted line is visible on the plot as a solid red curve. |
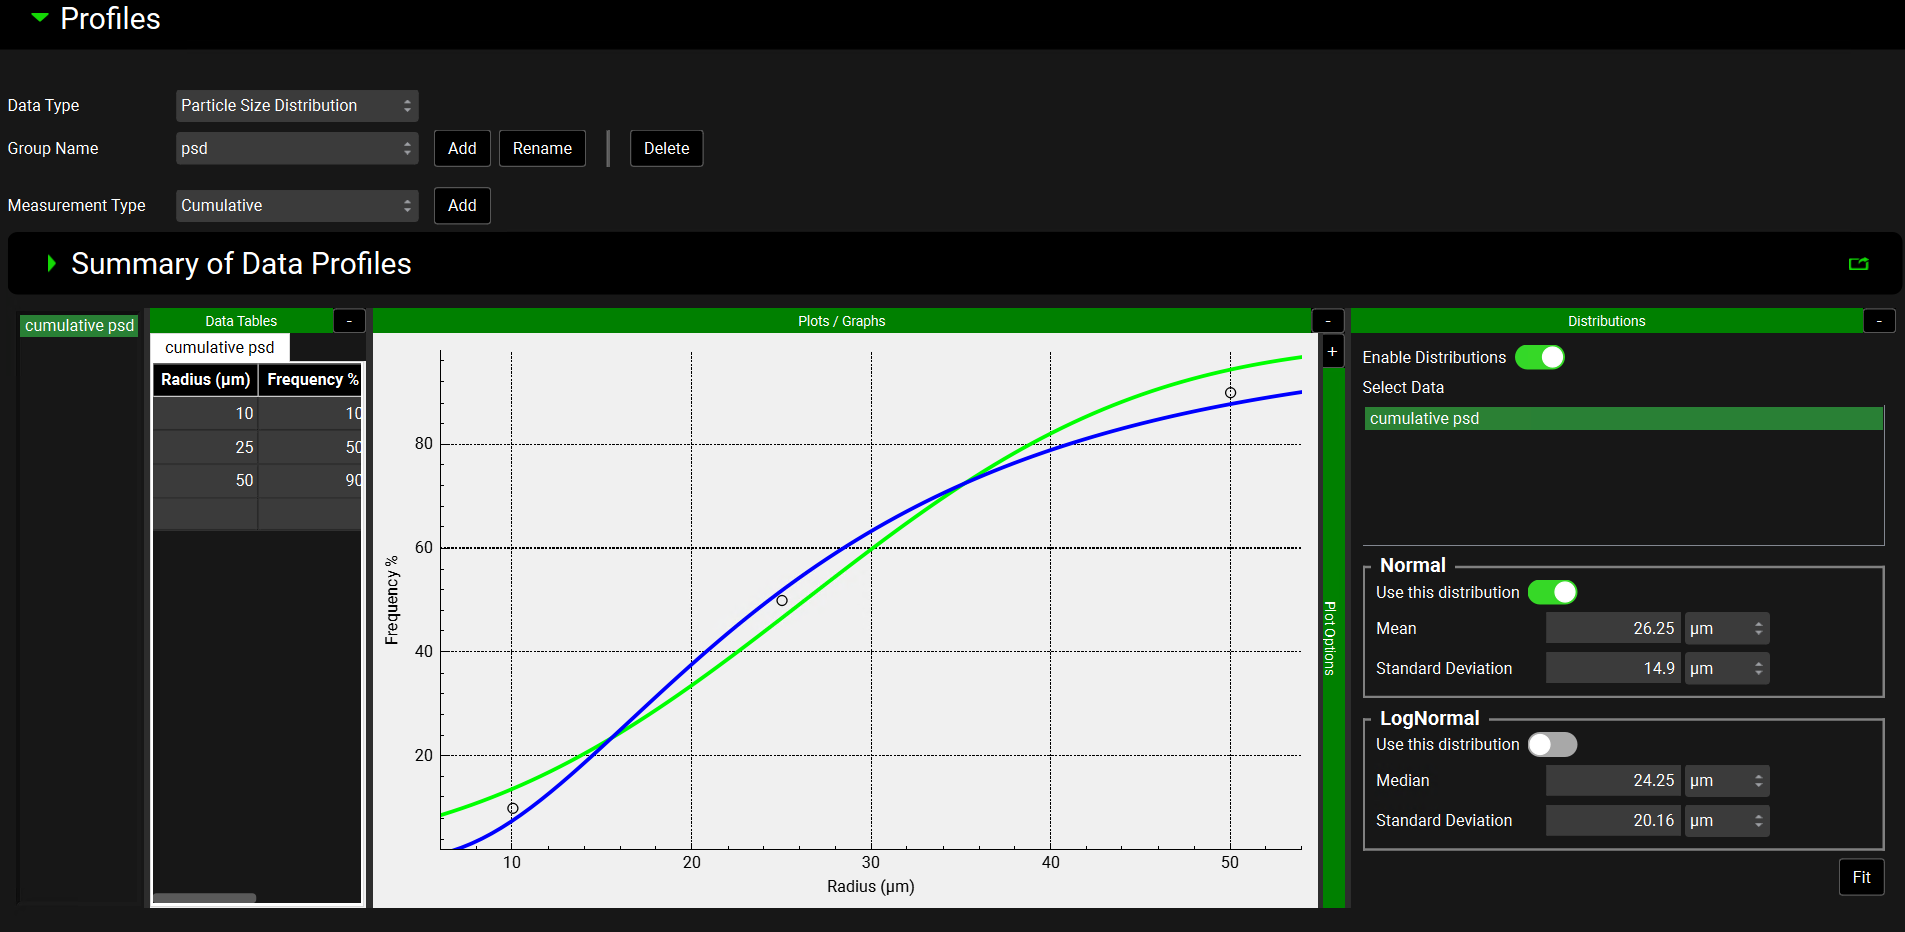
When the Data Type is Particle Size Distribution, a Normal or LogNormal distribution can be fitted.
Observed Data, Profiles panel, Distribution options, Particle Size Distribution Data Type
|
Input/Option |
Description |
|
Normal |
|
|
Use this distribution |
A toggle. Off by default. Switch on to use the fitted normal distribution to describe the input material for a formulation (see Particle Size & Forms Sub-panel). |
|
Mean |
The mean radius for the distribution in µm. |
|
Standard Deviation |
The standard deviation of the radius for the distribution in µm. |
|
LogNormal |
|
|
Use this distribution |
A toggle. On by default. Indicates that the fitted log normal distribution will be used to describe the input material for a formulation (see Particle Size & Forms Sub-panel). Will automatically be turned off if the Normal toggle is turned on. |
|
Mean |
The mean radius for the distribution in µm. |
|
Standard Deviation |
The standard deviation of the radius for the distribution in µm |
|
Fit |
Fits the distribution. The green line on the plot represents the normal distribution and the blue line represents the log normal distribution. |
Additional options for some Data Types
Exposure Data Type
When Exposure Data is selected from the Data Type drop-down, a table under the Plots/Graphs pane enables series specific information, namely the Dose Amount, Infusion Time (if applicable), and the Body Mass, to be added. In all cases, the units can be adjusted by clicking on the default unit and selecting the preferred unit from the drop-down. This is not a prerequisite but will enable the information to be used in, for example, PKPlus™, without the user having to enter it there.
The second table, to the right of the first, links the observed data to the simulated series and enables it to be plotted automatically on the Key View plots as applicable. The options in each column can be accessed by clicking in the appropriate cell and vary according to the Measurement Type selected. The mapping for some common data types is in the table below:
Observed Data, Profiles panel, Data information table for Exposure Data Type
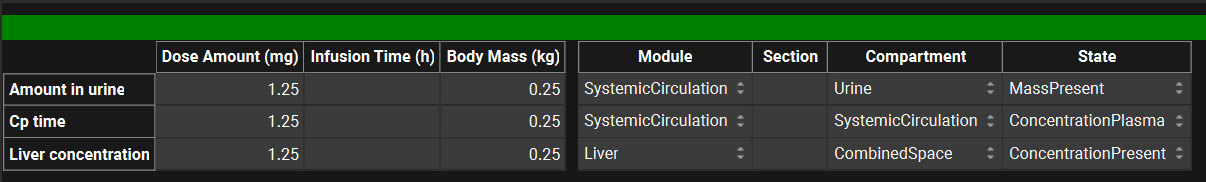
Profiles panel, example of data mapping
|
Data Type |
Module |
Section |
Compartment |
State |
|
Plasma concentration |
SystemicCirculation |
N/a |
SystemicCirculation |
ConcentrationPlasma |
|
Plasma concentration |
SystemicCirculation |
N/a |
VenousJunction^ |
ConcentrationPlasma |
|
Liver concentration |
Liver |
N/a |
CombinedSpace |
ConcentrationPresent |
|
Amount in liver |
Liver |
N/a |
CombinedSpace |
MassPresent |
|
Lung concentration |
Lung |
N/a |
CombinedSpace |
ConcentrationPresent |
|
Amount in urine |
SystemicCirculation |
N/a |
Urine* Systemic Circulation** |
MassPresent* MassRenalClearance** |
|
Amount in bile |
Liver |
N/a |
CombinedSpace |
MassBiliaryClearance |
|
Duodenum tissue concentration |
GastrointestinalTract |
Duodenum |
Epithelial |
ConcentrationPresent |
|
Amount dissolved in duodenum |
GastrointestinalTract |
Duodenum |
Dissolved |
MassPresent |
N/a – not applicable
^-applicable for IV infusion dose routes
*- applicable for PBPK models
**- applicable for compartmental models

GPX assumes delivery to the venous return compartment, instantaneous mixing and then sampling from the venous return compartment, for infusion dosing in the compound effectively goes round the body and is sampled from a site distinct from the infusion site, selecting Venous Junction would enable a more realistic comparison of simulated concentrations.
In Vitro Dissolution Release Data Type
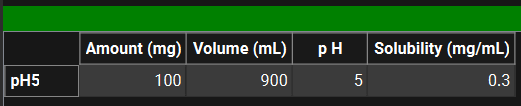
A table under the Plots/Graphs pane enables series specific information to be added. Where applicable, the units can be adjusted by clicking on the default unit and selecting the preferred unit from the drop-down. This is not a prerequisite but will enable the information to be used in, for example, Z-factor fitting in the Simulations view, without the user having to enter it there (Dissolution Model sub panel).
Observed Data, Profiles panel, Data information table for In Vitro Dissolution Release Data Type
|
Input/Option |
Description |
|
Amount |
The amount of the test compound in the dissolution experiment. The value and the units (mg, µg, ng) are editable. |
|
Volume |
The volume of the medium in the dissolution experiment. The value and the units (L, mL) are editable. |
|
pH |
The final pH of the dissolution experiment. |
|
Solubility |
The solubility of the test compound in the dissolution media. The value and the units (mg/mL, mg/L) are editable. |
Parameters Panel
Observed Data, Parameters panel
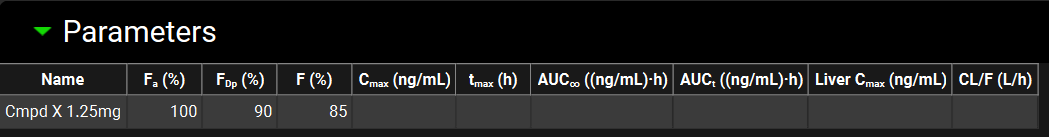
The Parameters Panel enables the user to enter observed parameters, the available parameters are shown in the table below. Parameters for any number of dosing occasions in any number of species can be added and used to populate the Observed Data columns in the Summary View, if desired see Observed Data sub panel.
Parameters panel, observed parameters that may be added
|
Property |
Definition |
|
Name |
The name of the entry. This value is referenced when linking these data to a simulation (see Observed Data sub panel). |
|
Fa(%) |
The fraction of the compound that was absorbed as a percentage of the total amount of drug that was administered. The value can be edited. |
|
FDp(%) |
The fraction of the compound that was absorbed into the portal vein as a percentage of the total amount of drug that was administered. The value can be edited. |
|
F% |
The bioavailability of the drug dose as a percentage of the total amount of drug that was administered. The value can be edited. |
|
Cmax(ng/mL) |
The highest (peak) concentration of the compound that is in the plasma after drug administration. The value and the units (ng/mL, µg/mL, mg/mL) can be edited. |
|
Tmax(h) |
The time, in hours, that it took for the compound to reach maximum plasma concentration after drug administration. The value and the units (h, min, d, wk) can be edited. |
|
AUC∞((ng/mL)-h) |
The observed area under the curve (AUC) for the compound extrapolated to infinity. The value and the units ((ng/mL)•h, (µg/mL)•h, (mg/mL)•h) can be edited. |
|
AUCt((ng/mL)-h) |
The observed area under the curve (AUC) for the compound at the last observation time, t. The value and the units ((ng/mL)•h, (µg/mL)•h, (mg/mL)•h) can be edited. |
|
Liver Cmax(ng/mL) |
The highest (peak) concentration of the compound that is in the liver after drug administration. The value and the units (ng/mL, µg/mL, mg/mL) can be edited. |
|
CL/F |
The clearance rate of the drug. The value and the units (L/h, mL/h, mL/min) can be edited. |