
The P-PSD™ Module is an optionally licensed module, used for fitting in vitro USP2 dissolution data using a product particle size distribution, which represents the surface area of drug substance available for dissolution in a given formulation. This module uses observed Invitro Dissolution Release data (percentages vs time) entered for specific drug product batches under the Observed Data view (see Profiles panel) as the inputs for P-PSD™ runs.
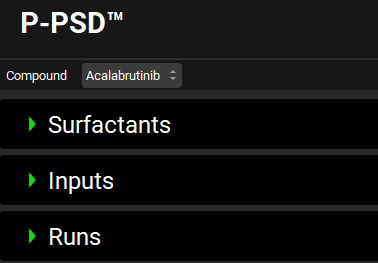
The P-PSD™ Module consists of three panels.
See:
The Surfactants panel allows users to create in-house excipients or consult the surfactant database. Below this are two main panels: Inputs and Runs. The Inputs panel is used to configure the dissolution data required for P-PSD™ runs, while the Runs panel contains two sub-panels - one for fitting dissolution data to calculate a P-PSD, and another for validating the batch P-PSD using independent dissolution data, if available. Additionally, the Validation panel enables the P-PSD to be transferred to the Observed Data section. The resulting P-PSD is a frequency-based particle size distribution consisting of 1 to 10 bin radii, each associated with a percentage of the drug substance mass in the product. This Particle Size Distribution can then be used to simulate in vivo dissolution for the batch of interest using GPX™.
P-PSD™ Module
Surfactants panel
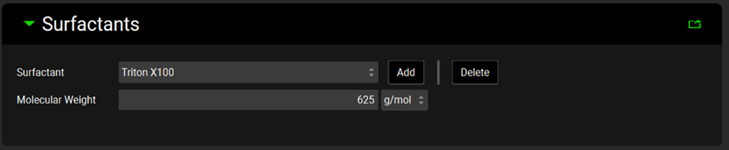
The P-PSD™ Module’s Surfactants panel comprises 30+ common surfactants for which molecular weight, critical micelle concentration (CMC), and micelle radius were compiled from the literature. In addition, users can create their own surfactant and capture the molecular weight. Users can add or change the inputs details of the dissolution experiment (CMC, concentration, micelle radius, and affinity of the drug to the surfactants) in the Inputs panel.
P-PSD™ Module, Surfactants panel
|
Input/Option |
Description |
|
Surfactant |
The name of the selected Surfactant. |
|
Add |
Adds a row to the table. Upon clicking Add, users will be prompted to name the input. |
|
Delete |
Deletes the currently selected input. Inputs are selected by clicking on the cell. |
|
Molecular Weight |
The molecular weight of the selected Surfactant in g/mol. The value can be edited. |
In addition, two Excel tools are available by navigating to C:\Users\<user>\AppData\Local\Simulations Plus, Inc\GastroPlus\10.2\Tools. “Size and CMC calculator-v1.0.xlsm” is available here (Size and CMC calculator-v1.0.xlsm) to estimate the size of selected surfactant micelles as a function of the medium temperature, surfactant concentration, and counterion concentration for ionic micelles based on data reported in the literature. “Kaff-fitting-tool-v1.0.xlsm” is available here (Kaff-fitting-tool-v1.0.xlsm) to estimate the affinity of the drug to surfactants.
Inputs panel
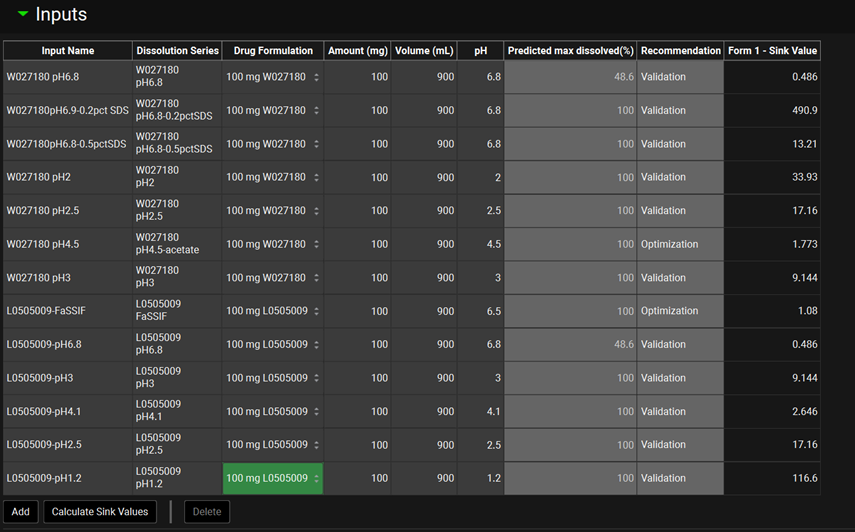
The Inputs panel contains a table where individual dissolution data inputs for P-PSD™ are defined. All inputs are based on series previously added as Invitro Dissolution Release data in the Observed Data view (see Profiles Panel). In addition to selecting the individual series which will be used, the Amount of drug, Volume of medium, and pH are populated automatically based on the information provided in the Observed Data view.
P-PSD™ Module, Inputs panel
|
Input/Option |
Description |
|
Input Name |
The user-entered name that corresponds to the input represented by the row in the table. |
|
Dissolution Series |
The group and series that corresponds to the given dissolution data input. Selections are made based on groups and series entered under Observed Data. Both the group and the series may be selected by clicking on the cell. |
|
Drug Formulation |
Select the formulation which was tested during the dissolution. The choice is based on the Formulations entered in the Dosing view. |
|
Amount (mg) |
The amount of drug substance, in mg, indicated in the observed dissolution data series. If this information has already been entered under Observed Data for the selected series, it will be automatically populated here. The value can be edited. |
|
Volume (mL) |
The dissolution medium volume, in mL, indicated in the observed dissolution data series. If this information has already been entered under Observed Data for the selected series, it will be automatically populated here. The value can be edited. |
|
pH |
The pH indicated in the observed dissolution data series. If this information has already been entered under Observed Data for the selected series, it will be automatically populated here. The value is given for reference and can be edited. |
|
Predicted max dissolved (%) |
Value from 0 to 100 appearing if the button Calculate Sink Values is clicked which corresponds to the predicted maximal percent drug dissolved based on the amount, volume, and solubility parameters entered in the Details view. |
|
Recommendation |
Text appearing if the button Calculate Sink Values is clicked which is either “Optimization” or “Validation”. Within a series of experiments for a given formulation, the P-PSD™ Module will recommend only one profile for P-PSD optimization (= fitting) based on a predicted maximal percent dissolved of 100% and the lowest Sink value. If only one experiment is entered per formulation, the recommendation is “Optimization”. |
|
Form X - Sink Value |
The sink value calculated for the polymorph X in the dissolution experiment based on the form solubility, dose, and volume of medium. |
|
Add |
Adds a row to the table. Upon clicking Add, users will be prompted to name the input. |
|
Calculate Sink Values |
Predicts the maximal percent dissolved and calculates the sink values for all the experiments entered as inputs, based on the details of amount, volume, and apparent solubilities entered in the Details view and in the Inputs panel. This button also actualizes the Recommendation for P-PSD Optimization or Validation. |
|
Delete |
Deletes the currently selected input. Inputs are selected by clicking on the cell. |
In order for the button Calculate Sink Values to provide meaningful results, the details of all experiments need to be entered in the Details sub-panel. If new dissolution experiments for a given batch are added to the inputs, or if experimental details are updated, the button Calculate Sink Values should be clicked again since the recommendations may change.
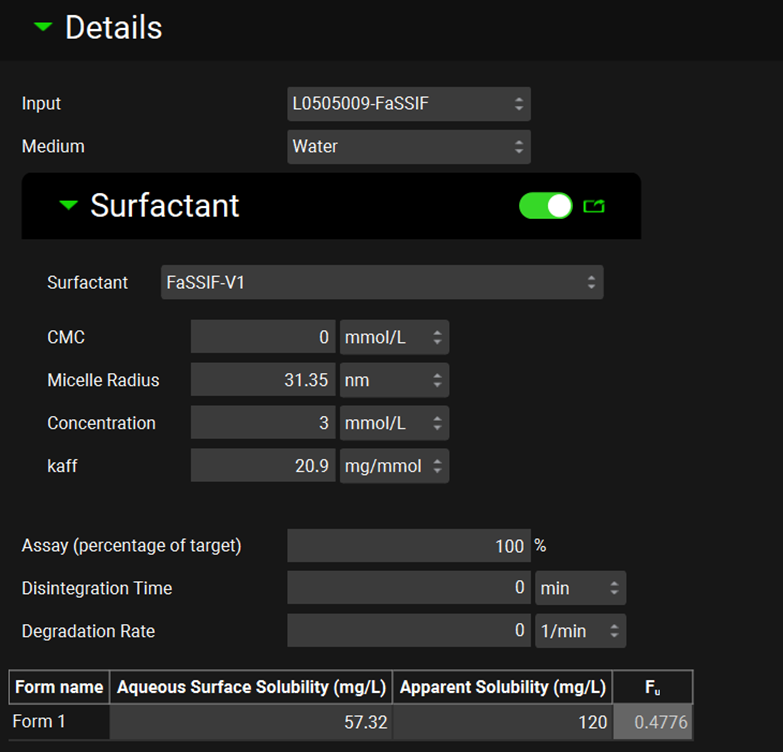
P-PSD™ Module, Inputs panel, Details sub-panel
|
Input/Option |
Description |
|
Input |
Selects the dissolution series amongst those added to the P-PSD™ Module Inputs view. |
|
Medium |
The medium used for the selected dissolution series. The default is water. Keep water as medium also for biorelevant media. |
|
Surfactant (toggle) |
A toggle. Turn on if surfactant is present in the dissolution medium (including if the medium is biorelevant with natural surfactants, e.g. FaSSIF). If the medium is devoid of surfactant, toggle to deselect. |
|
Surfactant |
The surfactant used in the dissolution medium. Select surfactant from the list (input an additional surfactant in the Surfactants panel if not available from the drop down menu). |
|
CMC |
The critical micelle concentration (mmol/L). The value can be edited. |
|
Micelle Radius |
The micelle radius (nm). The value can be edited. |
|
Concentration |
The concentration of surfactant (mmol/L). The value can be edited. |
|
kaff |
The affinity of the drug to the surfactant (mg/mmol). The value can be edited. |
|
Assay (percentage of target) |
The actual drug product assay based on the target drug substance content. Note that if the dosage form is over-dosed, numbers higher than 100% are accepted. The default is 100%. The value can be edited. |
|
Disintegration Time |
Time for the capsule to open or the tablet to disintegrate in the in vitro dissolution experiment selected. The value and units (min, s, h) can be edited. |
|
Degradation Rate |
First order degradation rate constant observed for soluble drug in the dissolution medium of the selected input. The value and units (1/min, 1/h, 1/s) can be edited. |
|
Aqueous surface solubility |
The aqueous surface solubility of the drug substance (mg/L). The value can be edited. |
|
Apparent solubility |
The solubility in the presence of the surfactant considering the aqueous surface solubility, affinity to surfactant, CMC, and surfactant concentration entered previously. The P-PSD™ Module calculates this value automatically based on the above input parameters (mg/L). However, the value can be edited. |
|
Fu |
Fraction of drug in the aqueous phase as a solute during dissolution, calculated by the P-PSD™ Module based on the aqueous surface solubility and apparent solubility. |
Runs panel
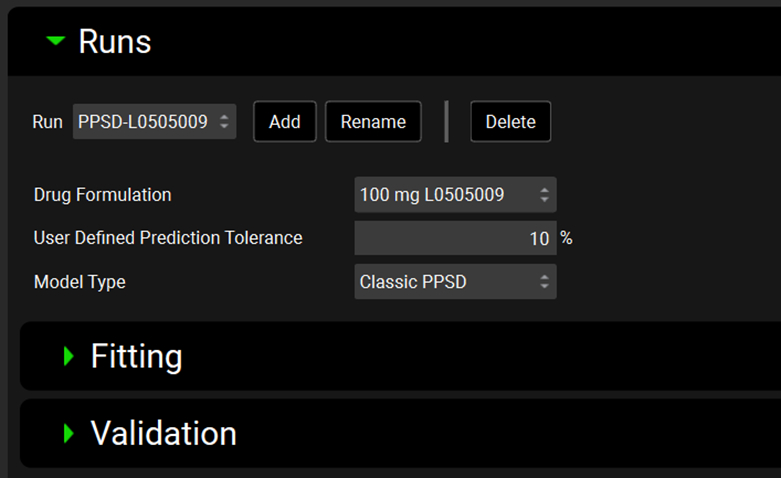
The Runs panel allows to select the formulation for which a P-PSD will be fitted and define the precision of the fit. There are two sub-panels available, a Fitting sub-panel and a Validation sub-panel.
P-PSD™ Module, Runs panel
|
Input/Option |
Description |
|
Run |
A drop-down. Selects the current P-PSD™ Run, to which all below settings will apply. This drop-down will be blank until the first P-PSD™ Run is added (see below). |
|
Add |
Adds a new P-PSD™ Run, raising an input box where the run can be named. |
|
Rename |
Renames the currently selected P-PSD™ Run. |
|
Delete |
Deletes the currently selected P-PSD™ Run. |
|
Drug Formulation |
Selects the formulation (batch) for which the P-PSD needs to be fitted. |
|
User Defined Prediction Tolerance |
Indicates the precision error below which the P-PSD™ Module will halt optimization of the P-PSD against observed data. The default is 10%. It is advised to keep it for the first fitting iteration. |
|
Model Type |
Select type of P-PSD model. For 10.2 it is the Classic P-PSD model. |
If you wish to use other P-PSD models such as the one including hydrodynamics (P-PSD HD), click here (P-PSD-HD.xlsx) to download the Excel model. If you wish to use the P-PSD model with hydrodynamics and coning, (P-PSD HDC), click here (P-PSD HDC-1_2_model.xlsx) to download the Excel model. For further information on the use of these models, please refer to Pepin et al. 2022Error rendering macro 'sp-footnote' : Page loading failed.
Fitting sub-panel
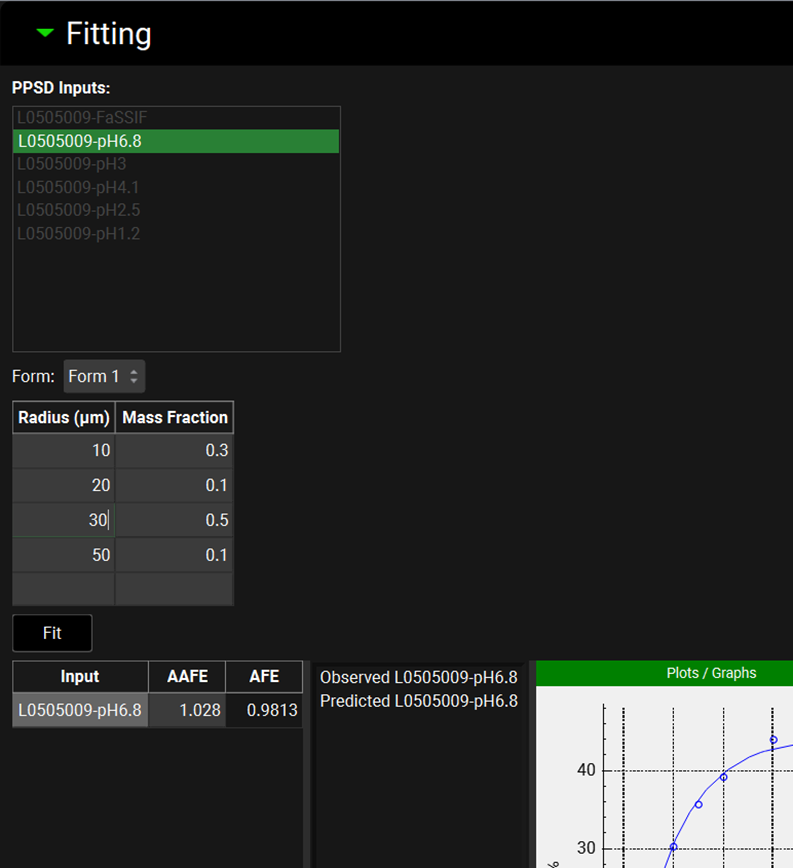
The Fitting sub-panel allows the selection of the dissolution inputs (one or more) for fitting the P-PSD to the batch selected in the Runs view. This panel also displays the current P-PSD in terms of particle size bins radius (µm) and associated mass fraction. For the first time fit of a P-PSD, this table is empty. Finally, the button Fit allows to optimize the P-PSD for the selected batch against the input dissolution data using the user defined prediction tolerance and the details of the experiments entered in the Inputs panel.
P-PSD™ Module, Runs panel, Fitting sub-panel
|
Input/Option |
Description |
|
PPSD Inputs |
A list of all the dissolution inputs which correspond to the batch selected in the Runs panel under “Drug Formulation”. Inputs are selected by clicking on the name, and selected entries will be highlighted in green. Multiple inputs can be selected by clicking each required input in turn, or by clicking-and-dragging. If multiple inputs are selected, the solver will optimize the P-PSD against all the selected batches and the stopping criteria will be based on the average AAFE. |
|
Form |
A drop-down. If the drug formulation comprises more than one polymorph, the drop down menu allows the P-PSD for each of the forms to be displayed. |
|
Table with Radius and Mass Fraction columns |
Table which displays the current P-PSD. It will be empty pending the first fit of a given Run or Data will be displayed for the previous Run. Radii can be added by typing a radius and mass fraction in the bottom row of the table. Rows can be deleted: hold [CTRL]-key and click to select a given line and right click to access the Delete menu. Note that if the sum of mass fractions is not equal to 1, the fitting will still proceed and the mass fraction will be normalized to 1. The fitting can start even if the P-PSD table is empty. |
|
Fit |
A button. Click to start the fitting of the P-PSD. |
|
Table with Input, AAFE, and AFE columns |
This table displays the AAFE and AFE for each input at the end of the fitting process. |
|
Plots/Graphs |
This window displays the observed dissolution data (open symbols) and dissolution prediction using the P-PSD (solid line). |
To the right of the Input, AAFE and AFE table, is the P-PSD™ plot, which graphically displays the inputs and outputs of the P-PSD™ Run. The observed data are plotted as points, colored by input and the dissolution prediction for each input is plotted as a solid line, matched by color to the corresponding input. The specific inputs and outputs displayed are selected on the left-hand side of the plot, with additional options in the expandable Plot Options on the right-hand side. Both of these features behave the same as other plots in GPX™ (see Plot Settings and Plot Options).
Validation sub-panel
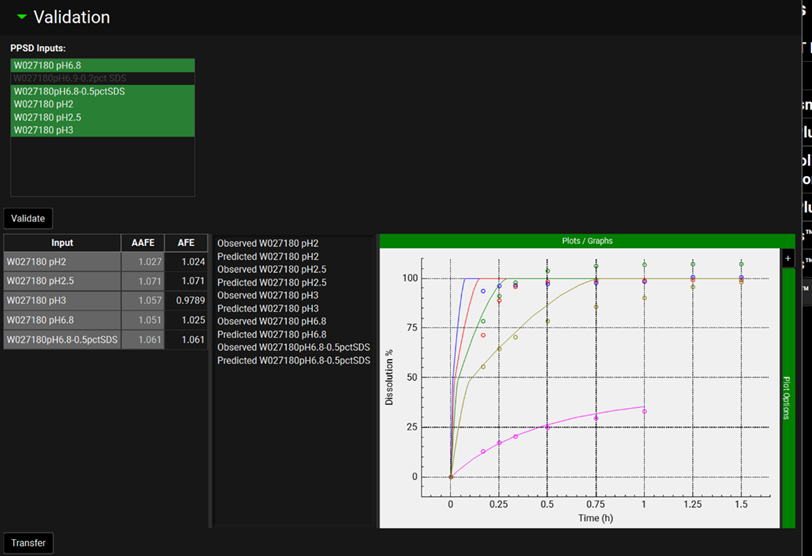
The Validation sub-panel allows the selection of the dissolution inputs for validation of the P-PSD. This panel also displays the validation results with observed and simulated dissolution profiles and automatically calculates the fitting performance indicators AAFE and AFE. From this panel, the P-PSD can be transferred to the Observed Data, Particle Size Distribution data type.
P-PSD™ Module, Runs panel, Validation sub-panel
|
Input/Option |
Description |
|
PPSD Inputs |
The list shows all the dissolution inputs which correspond to the batch selected in the Runs panel under “Drug Formulation”. Inputs are selected by clicking on the name, and selected entries will be highlighted in green. Multiple inputs can be selected by clicking each required input in turn, or by clicking-and-dragging. |
|
Validate |
A button, click to start the validation. |
|
Table with Input, AAFE, and AFE columns |
This table displays the AAFE and AFE for each of the inputs selected for validation. |
|
Plots/Graphs |
This window displays the observed dissolution data (open symbols) and dissolution prediction using the P-PSD (solid line). |
|
Transfer |
Button which transfers the P-PSD to the Observed Data view. |
To the right of the Input, AAFE and AFE table, is the P-PSD™ plot, which graphically displays the inputs and outputs of the P-PSD™ Run. The observed data are plotted as points, colored by input and the dissolution prediction for each input is plotted as a solid line, matched by color to the corresponding input. The specific inputs and outputs displayed are selected on the left-hand side of the plot, with additional options in the expandable Plot Options on the right-hand side. Both of these features behave the same as other plots in GPX™ (see Plot Settings and Plot Options).