
PDPlus™ is an optionally licensed module used for fitting pharmacodynamic (PD) models from observed effect-time data. Those models can then be used to simulate PD effects for new dosing regimens. Exposure and effect data entered under the Observed Data view (see Profiles Panel) are used as the inputs for PDPlus™ runs. Multiple PDPlus™ runs may be set up within a project, to conduct multiple fittings using either different data or different settings.
PDPlus™ Module
The PDPlus™ module consists of two panels: Inputs and Runs. The Inputs panel controls setup of exposure and effect data for use in the PDPlus™ runs, while the Runs panel covers the settings for the fitting and optimization of parameters and displays the results. All the inputs and options for these two panels (and where applicable, their sub-panels) are described below. See:
Inputs panel
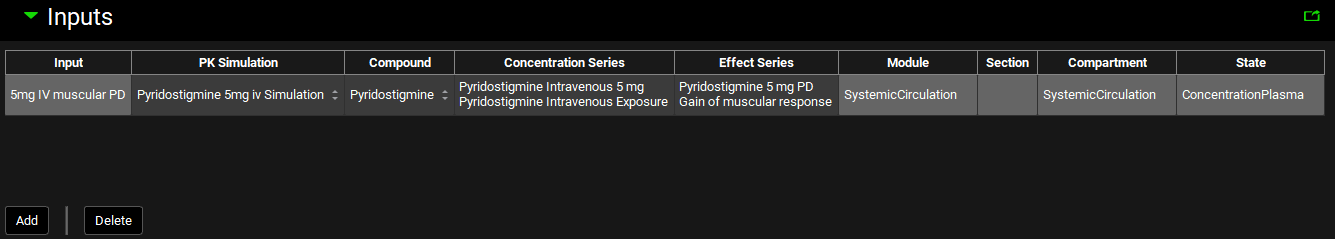
The Inputs panel contains a table where individual inputs for PDPlus™ are defined. All inputs are based on series previously added as exposure data in the Observed Data view (see Profiles Panel) or simulated concentration profiles based on the model defined in the Simulations view. If the exposure data has been selected, the mapping that identifies the type of exposure data will be automatically populated and so must be defined in Observed Data.
PDPlus™ Module, Inputs panel
|
Input/Option |
Description |
|
Input |
The user-entered name that corresponds to the input represented by the row in the table. |
|
PK Simulation |
A drop-down. Selects the Simulation to be used for the PD model. The Simulation names are automatically populated from the list of Simulations created for the project. |
|
Compound |
Automatically populated based on the settings of the selected Simulation. If the Simulation contains multiple compounds, for example parent and metabolites, the relevant compound can be selected from the drop-down. |
|
Concentration Series |
The group and series that corresponds to the exposure data to be used in the PD model. The drop-down is populated with groups and series entered under Observed Data. Both the group and the series may be selected by clicking on the cell and selecting the desired input from the drop-down. Alternatively Use Simulated may be selected which uses a simulated profile for the concentration series. |
|
Effect Series |
The group and series that corresponds to the effect data to be used in the PD model. The drop-down is populated with groups and series entered under Observed Data. Both the group and the series may be selected by clicking on the cell and selecting the desired input from the drop-down. If there is no effect data available, select None from the drop-down. |
|
Module |
Used to identify the data type for the exposure data. If an observed Concentration Group is selected, this is automatically populated based on the mappings in the Observed Data view. If Use Simulated is selected, clicking in the cell activates a drop-down and the mapping can be assigned. See Profiles Panel for more details. |
|
Section |
Active only if the Concentration Series relates to one of the ACAT sections. Used to identify the data type for the exposure data. If an observed Concentration Group is selected, this is automatically populated based on the mappings in the Observed Data view. If Use Simulated is selected, clicking in the cell activates a drop-down and the mapping can be assigned. See Profiles Panel for more details. |
|
Compartment |
Used to identify the data type for the exposure data. If an observed Concentration Group is selected, this is automatically populated based on the mappings in the Observed Data view. If Use Simulated is selected, clicking in the cell activates a drop-down and the mapping can be assigned. See Profiles Panel for more details. |
|
State |
Used to identify the data type for the exposure data. If an observed Concentration Group is selected, this is automatically populated based on the mappings in the Observed Data view. If Use Simulated is selected, clicking in the cell activates a drop-down and the mapping can be assigned. See Profiles Panel for more details. |
|
Add |
Adds a row to the table. Upon clicking add, users will be prompted to name the input. |
|
Delete |
Deletes the currently selected row. |
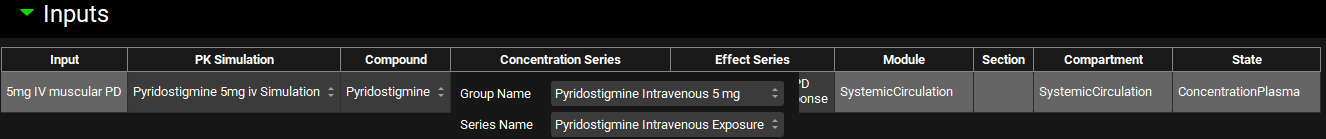
PDPlus™ Module, Inputs panel, series selector expanded
|
Input/Option |
Description |
|
Group Name |
Selects the group for the Concentration or Effect Series. Options are populated based on exposure data groups added in the Observed Data view. |
|
Series Name |
Selects the specific series for the Concentration or Effect Series. Options are populated based on series added in the Observed Data view to the above selected group. |
Runs panel
The Runs panel covers the setup of PDPlus™ Runs, which, when run, fit and/or optimize pharmacodynamic models. The specific analyses conducted depend on the run settings, which are specified in the Model Parameters sub-panel.
Multiple PDPlus™ Runs may be created and saved, using any combination of inputs defined above. This permits comparison of different approaches, or quick re-running of PDPlus™ in a different GPX™ session.
Optimization of the PD model parameters may be performed, and the settings defined and saved using the Optimization Parameters sub-panel.
After completing a PDPlus™ Run, the results are viewed in the Results sub-panel.
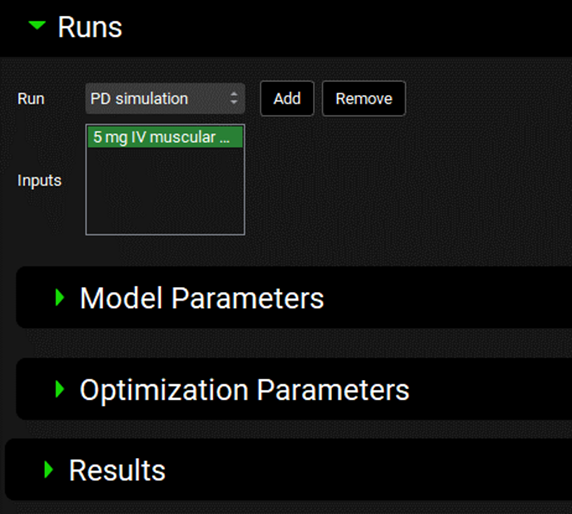
PDPlus™ Module, Runs panel
|
Input/Option |
Description |
|
Run |
A drop-down. Selects the PDPlus™ Run, to which all below settings will apply. This drop-down will be blank until the first PDPlus™ Run is added (see below) |
|
Add |
Add a new PDPlus™ Run, raising an input box where the run can be named. |
|
Remove |
Deletes the currently selected PDPlus™ Run |
|
Inputs |
Selects the Inputs that will be used for the current PDPlus™ Run. The options available are based on the inputs defined above in the Inputs panel. Inputs are selected by clicking on the name, and selected entries will be highlighted in green. Multiple inputs can be selected by clicking on multiple inputs or by clicking-and-dragging. Click on the input again to deselect it. |
Model Parameters sub-panel
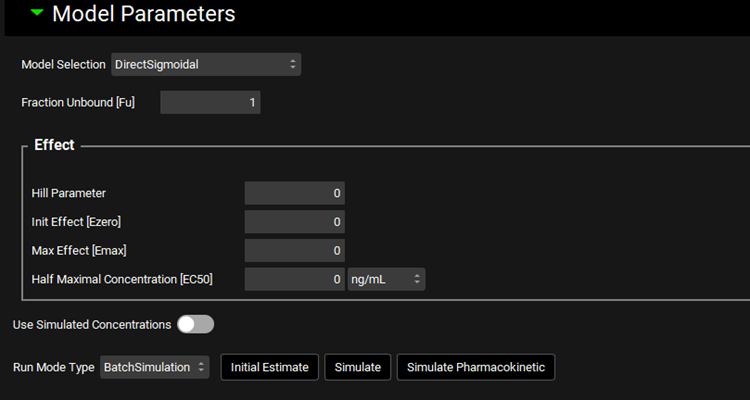
The Model Parameters sub-panel defines the PDPlus™ model to be run.
PDPlus™ Module, Runs panel, Model Parameters sub-panel (DirectSigmoidal Model selected)
|
Input/Option |
Description |
|
Model Selection |
A drop-down. Selects the PD model to be used in the current Run. See below for the model types available. |
|
Fraction Unbound [Fu] |
The fraction unbound in plasma for the selected compound. Defaults to 1. The value can be edited. |
|
Effect |
This section contains the inputs relevant to the PD model selected and differ based on the model requirements. The model inputs are described below for each available model type. |
|
Precursor |
This section contains the Precursor inputs and is relevant only for the Precursor Dependent Class V -VIII model. |
|
DirectLinear |
|
|
DirectLogLinear |
|
|
DirectEmax |
Note this model can also be applied if the PD response is the inhibition of an effect. |
|
DirectSigmoidal |
|
|
IndirectLinkEffectCompartment |
|
|
IndirectClassI IndirectClassII IndirectClassIII IndirectClassIV |
|
|
PrecursorDependentClassV-VIII |
Effect
Precursor
|
|
CellKillingPhaseNonSpecific |
Effect
|
|
BacterialKillingPower |
Effect
Bacteria Killing
Note: Munits stands for Million units.
|
|
BacterialKillingSigmoidal |
Effect
Bacteria Killing
|
|
Use Simulated Concentrations |
A toggle. Turned off by default. When turned off, the observed data will be used as selected in Inputs. When turned on, uses the simulated concentrations in place of observed data. |
|
Run Mode Type |
A drop-down that selects the type of Run that will be performed.
|
|
Initial Estimate |
A button. Click to use the initial estimates as calculated by GPX™. |
|
Simulate |
A button. Click to run the simulations. Note: this button is only visible when the Run Mode Type is set to BatchSimulation and replaces the Optimize button. |
|
Optimize |
A button. Click to start an optimization. Note: this button is only visible when the Run Mode Type is set to Optimization and replaces the Simulate button. |
|
Simulate Pharmacokinetic |
A button. Click to generate the Simulated Concentrations for use in the PD simulation. Note: This must be done prior to clicking Simulate if the Use Simulated Concentration toggle is turned on. |
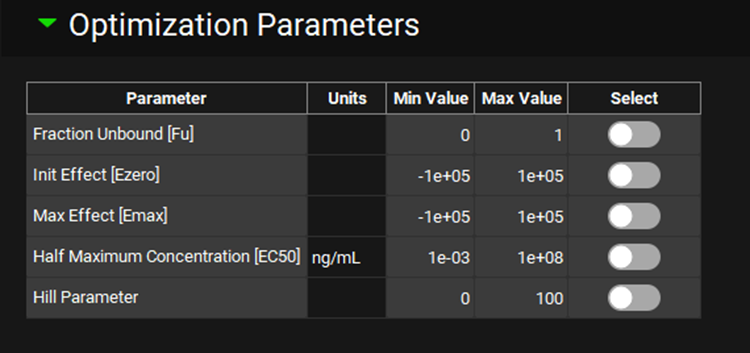
Optimization Parameters sub-panel
The Optimization Parameters sub-panel defines the settings for the optimization of the PDPlus™ model. To activate it switch the Run Mode Type to Optimization.
PDPlus™ Module, Runs panel, Optimization Parameters sub-panel (DirectSigmoidal Model selected)
|
Input/Option |
Description |
|
Parameter |
Lists the parameters available for optimization, based on the selected model. |
|
Units |
Displays the units of the parameter available for optimization, where applicable. The units can be edited by clicking on the displayed units and selecting the preferred option from the drop-down. |
|
Min Value |
The minimum value the Optimizer may consider. The value can be edited. |
|
Max Value |
The maximum value the Optimizer may consider. The value can be edited. |
|
Select |
A toggle. Selects which of the available parameters should be optimized. All are turned off by default. Click the toggle in the row containing the parameter for optimization to select it. The toggle will turn green. Click again to deselect the parameter. |
To start the optimization, return to the Model Parameters sub-panel and click Optimize.
Once the PD parameters have been optimized, the fitted parameters are updated to the appropriate parameter input boxes in the Model Parameters sub-panel and a PD simulation is run. The results and statistics from the PD model parameters Optimization can be viewed in the Results sub-panel (see below).
To save the Optimized model parameters, save the GPX™ project.
Results sub-panel
The results sub-panel displays the results of the PDPlus™ Run and/or Optimization.
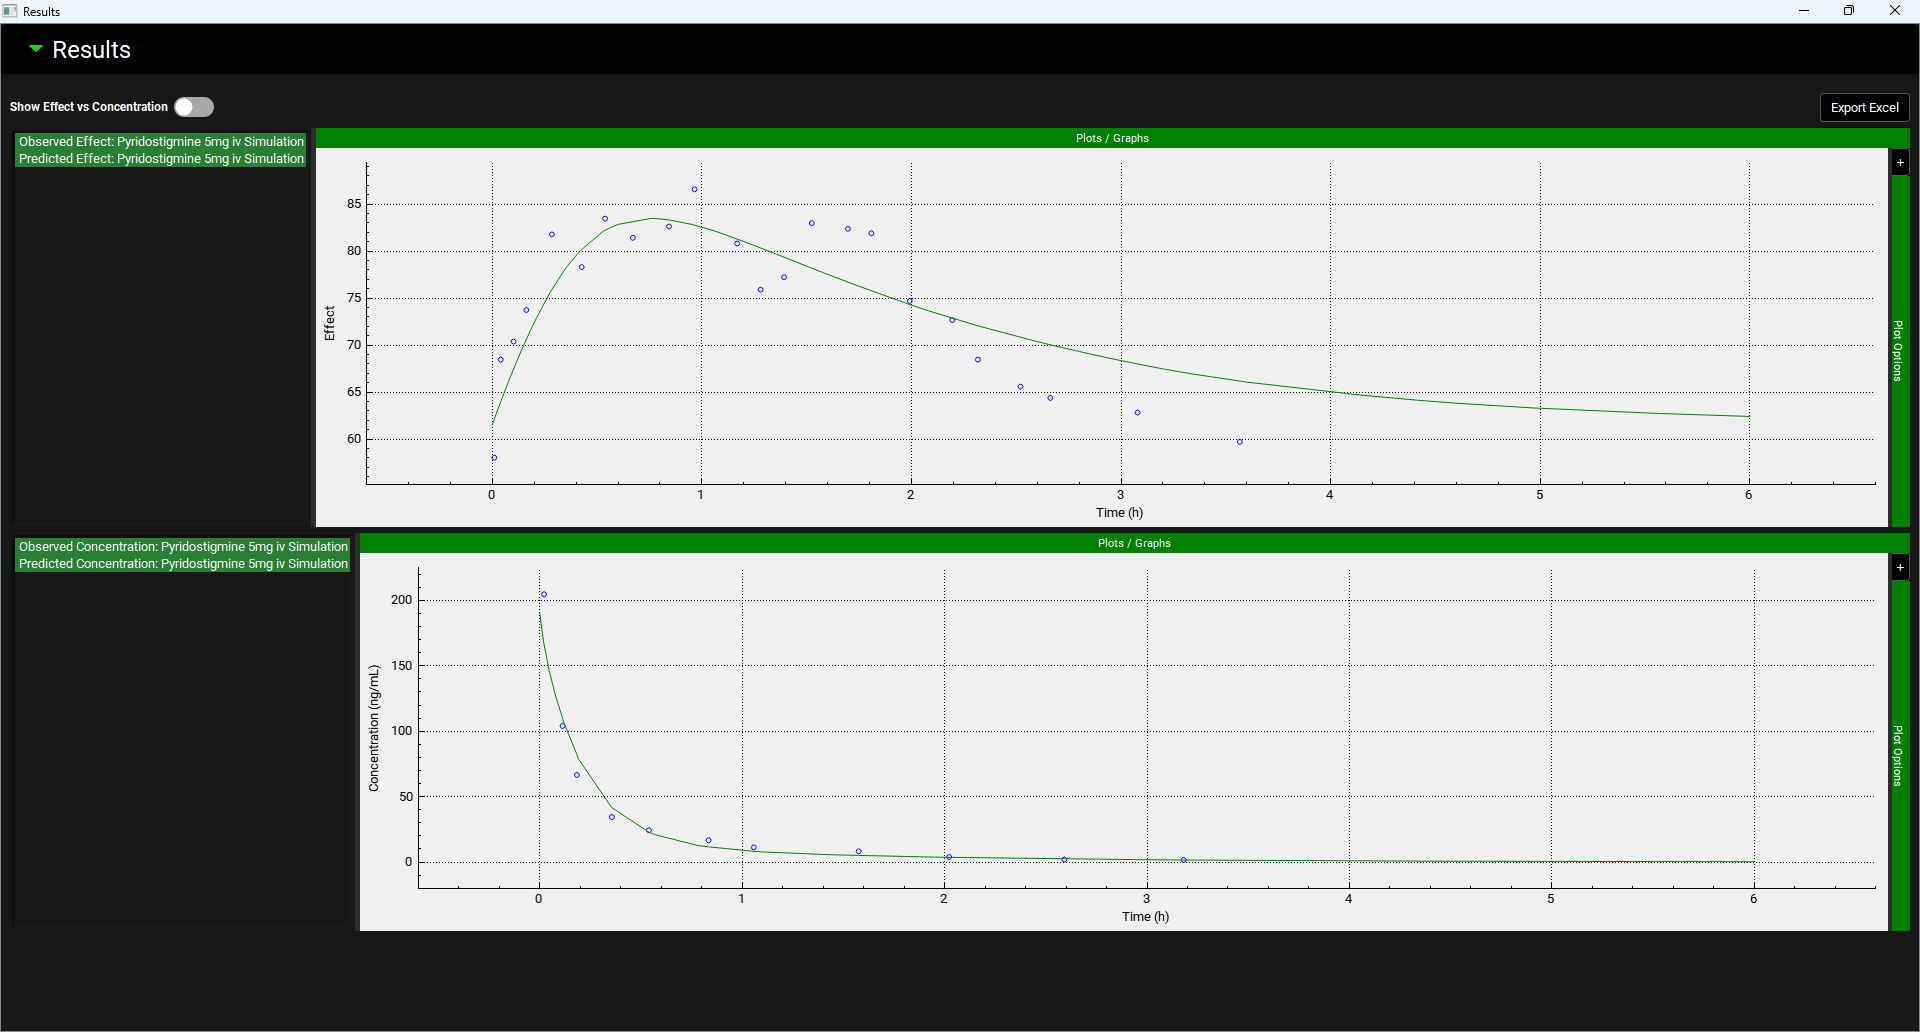
Simulation Results
Graphs showing the Effect against Time and Concentration against Time can be viewed in the Results sub-panel. For more information regarding Plot Options see Plot Settings and Plot Options. The green highlighted legend names detail the series that are plotted. Hovering over a legend name highlights the series on the plot and joins points with a line.
PDPlus™ Module, Runs panel, Results sub-panel, Simulation plots
|
Input/Option |
Description |
|
Export Excel |
When clicked, creates an excel output file of the Optimization or PDPlus™ Run in the same folder as the project files. |
|
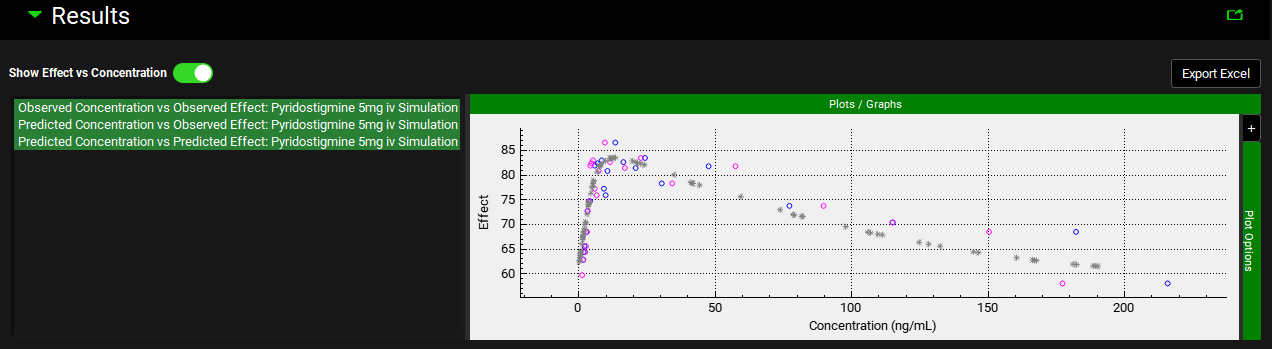
Show Effect vs Concentration |
A toggle. Turn on to display a plot of the Effect against the Concentration. |
PDPlus™ Module, Runs panel, Results sub-panel, Simulation plots – Effect vs Concentration
Optimization Results
Graphs showing the Effect against Time and Concentration against Time can be viewed in the Results sub-panel. For more information regarding Plot Options see Plot Settings and Plot Options. The green highlighted legend names detail the series that are plotted. Hovering over a legend name highlights the series on the plot and joins points with a line.
PDPlus™ Module, Runs panel, Results sub-panel, Optimization plots

|
Input/Option |
Description |
|
Export Excel |
When clicked, creates an excel output file of the Optimization or PDPlus™ Run in the same folder as the project files. |
|
Show Effect vs Concentration |
A toggle. Turn on to display a plot of the Effect against the Concentration (see above). |
The statistics of the PD Optimization are shown below the plots.
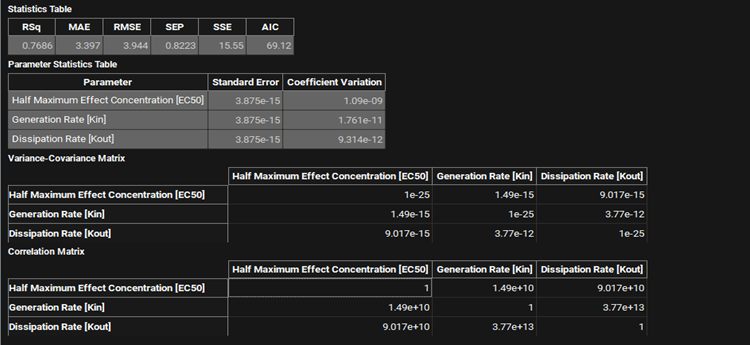
PDPlus™ Module, Runs panel, Results sub-panel, Optimization statistics
|
Input/Option |
Description |
|
Statistics Table |
Statistical parameters indicating the goodness-of-fit of the PD model.
|
|
Parameter Statistics Table |
The statistics relating to the optimized parameter value.
|
|
Variance-Covariance Matrix |
A matrix giving the covariance between each pair of parameter optimized. |