
The Compounds View has seven panels. All the inputs and options on these seven panels (and where applicable, their sub-panels) are for the compound that is selected on the Compound drop-down list that is displayed at the top of the Compounds view. See:
Compounds View
|
Input/Option |
Description |
|
Compound |
A drop-down. Selects the required compound. Options are populated based on compounds already added to the project. If no compounds have been added, this will be blank, and panels below will be disabled.
|
If a new compound is added, then initially, many of the panel and sub-panel options are either blank or set to their default values. If ADMET Predictor® is used to import a Compound file, then many of the options are automatically set to the values that are specified in the file, but the values may still be edited.
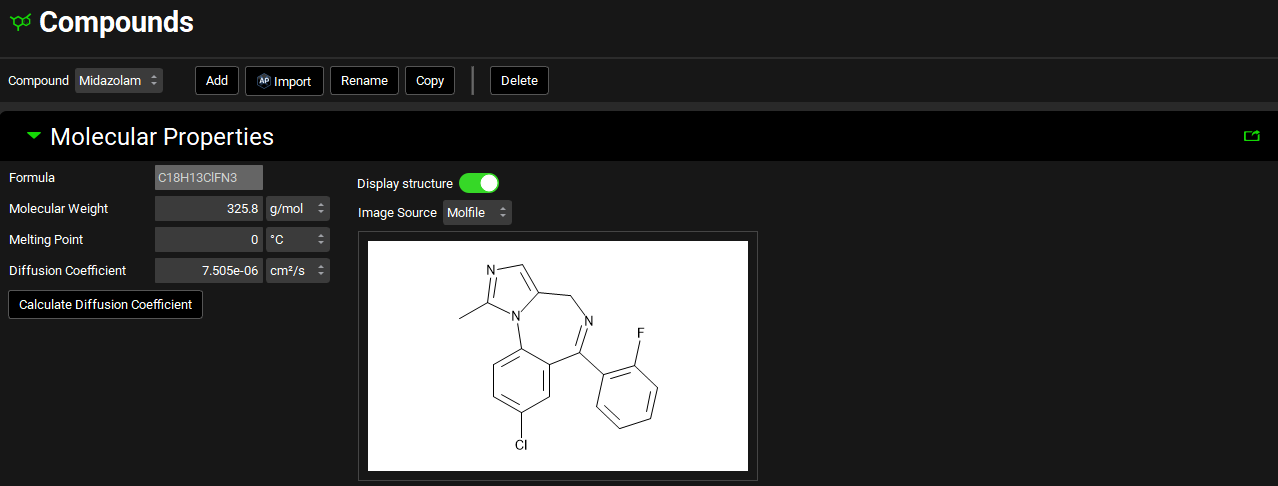
Molecular Properties panel
Compound view, Molecular Properties panel
|
Input/Option |
Description |
|
Formula |
The chemical formula for the selected compound. Note: The formula is provided for your convenience only. GPX™ does not require or use this information for any calculation purposes. |
|
Molecular Weight |
The molecular weight for the selected compound. The default value is 100 g/mol. Both the value and the units (g/mol, kg/mol) can be edited. |
|
Melting Point |
The melting point for the selected compound. The default value is 0 °C. Both the value and the units (°C, K, °F) can be edited. |
|
Diffusion Coefficient |
The diffusion coefficient for the selected compound, defined as the proportionality constant between the time rate of change of concentration at a point and the spatial variation of the concentration at that point. It is representative of how rapidly molecules in solution move away from the surface of a dissolving particle into the free stream and is a function of the viscosity of the surrounding fluid. As such, it is dependent on temperature and surfactant effects; however, it is treated as a constant in GPX™. The default value is 7.5e-06 cm2/s. Both the value and the units (cm2/s, mm2/s, m2/s) can be edited. |
|
Calculate Diffusion Coefficient |
If the diffusion coefficient is unknown, but the molecular weight is entered clicking this button will calculate an estimated value based on the molecular weight. |
|
Display Structure |
A toggle. When the toggle is on, the structure is displayed, turning it off hides the displayed structure. |
|
Image Source |
Indicates the source of the displayed structure. |
To delete a structure, within the Molecular Properties panel, right click on the structure and then select Delete. This removes the structure from the project.
When using the ADMET Predictor module you can choose not to include the structure when importing compounds(s) via the Include image data toggle in the Import panel.
A structure can be pasted into the project by right clicking in the structure display box and selecting Paste. The Image Source will then be automatically set to Image.
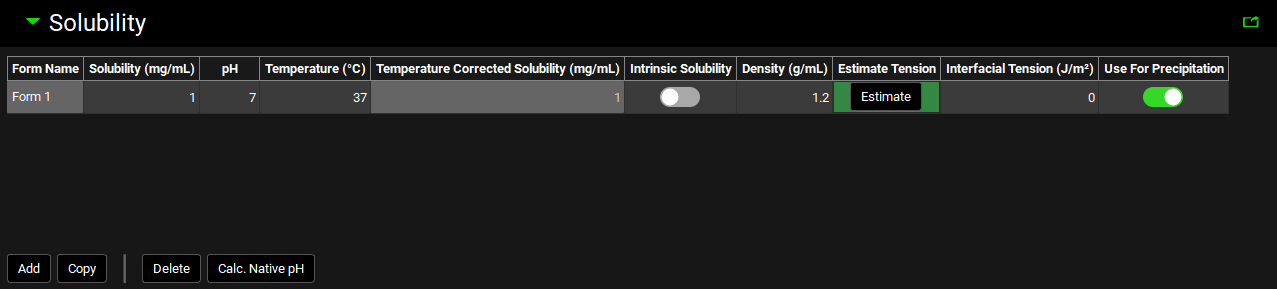
Solubility panel
Compounds view, Solubility panel
|
Input/Option |
Description |
|
Form Name |
If there are two or more solid forms of the selected compound with different solubilities (either two different crystalline forms or a mixture of an amorphous and a crystalline form) or the compound might precipitate in a solid form with different solubility than the administered compound, then this value identifies each different form. The default value is Form 1. Subsequent forms will be Form 2, Form 3, etc. The Form Name cannot be edited. |
|
Solubility (mg/mL) |
The measured or estimated solubility of the selected form. The default value is 1 mg/mL. Both the value and the units (mg/mL, mg/L) can be edited. |
|
pH |
The pH at which the solubility of the selected form was measured or estimated. This value is not applicable for intrinsic solubilities (see below). The value can be edited. |
|
Temperature |
The temperature at which the solubility of the selected form was measured or estimated. The default value is 37°C. Both the value and the units (°C, K, °F) can be edited. |
|
Temperature Corrected Solubility (mg/mL) |
Calculates the solubility at body temperature (37°C) based on the melting point, the measured solubility and the temperature at which the solubility was measured, as entered in the Compound view. |
|
Intrinsic Solubility |
A toggle. Off by default. Controls whether the solubility value entered is considered an intrinsic solubility (solubility of the pure neutral species). Activating the toggle removes the associated pH. The solubility value is still used to define the pH solubility curve, but the point will not appear on the plot. |
|
Density |
The average density (in g/mL) of the particles of the indicated form (after disintegration) in the dosage form. The default value is 1.2 g/mL. The value can be edited. |
|
Estimate Tension |
A button. Applicable for Precipitation models. Uses the GastroPlus® built-in correlation between the interfacial tension and native solubility of the drug 1 to estimate interfacial tension if a value is not available from another source. The correlation is applicable only for low solubility compounds. To estimate the interfacial tension, click the Estimate button and the Interfacial Tension (J/m3) column will be populated for the specified Form. |
|
Interfacial Tension (J/m2) |
Applicable for Precipitation models. The interfacial tension between the crystal and surrounding solution. The value is used in the Kelvin equation to adjust solubility for the particle size effect. The default value is 0 J/m2. Both the value and the units (J/m2, mJ/m2) can be edited. |
|
Use For Precipitation |
A toggle. Turned on by default for Form 1. Controls which Form will be used to define the solubility of any precipitate. |
|
Add |
Adds a Form to the solubility table for the selected compound. |
|
Copy |
Copies the currently selected Form. Hold [CTRL]-key and click to highlight a row to copy. |
|
Delete |
Deletes the currently selected Form. Hold [CTRL]-key and click to highlight a row for deletion. |
|
Calc. Native pH |
For ionized compounds, if you are using the solubility measured in pure water by adding drug compound until it is saturated, then the pH of the resulting solution is changed by the addition of the drug. This pH is called the “native pH”. Clicking the Calc. Native pH button, will cause GPX™ to calculate the native pH for your compound if the pKa’s have been entered in the Dissociation (pKa) panel. |
To select a row in a table within GPX™ hold [CTRL]-key on the keyboard and click the desired row. This will enable the Add, Copy and Delete Buttons.
Note that for every form added here for a given compound, there must be a corresponding form in any solid oral formulation(s) that will be used in simulations including this compound. This is to ensure that each form has a corresponding particle size distribution.
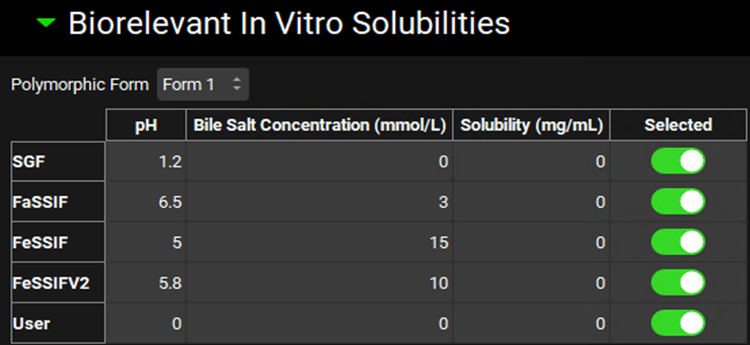
Biorelevant In Vitro Solubilities sub-panel
The solubilization ratio is a compound-specific parameter that relates the concentration of bile salts to their effect on the solubility of the compound. An in vitro value of this parameter can be obtained from in vitro solubilities that are predicted by ADMET Predictor® or measured in SGF, FaSSIF, FeSSIF, FeSSIFV2, or other (User) biorelevant media. The in vitro solubility values for each Form can be specified by selecting the relevant Form in the Polymorphic Form drop-down on the Biorelevant In Vitro Solubilities sub-panel. The toggle next to each solubility indicates whether, if the value is populated, it will be used in the calculation of the solubilization ratio. If the value is set to zero it will automatically not be used.
Compounds view, Solubility panel, Biorelevant In Vitro Solubilities sub-panel
|
Input/Option |
Description |
|
Polymorphic Form |
A drop-down. Selects the form for which biorelevant solubilities (and thus solubilization ratio) will apply. |
|
Media options |
Note: If solubilities in three different media with varying bile salt concentrations are available, then the User option for biorelevant solubility provides an option for a more accurate calculation of the bile salt solubilization ratio. |
|
pH |
The final pH of the indicated medium. The value can be edited to reflect the in vitro assay conditions used to generate the solubility in the given media. |
|
Bile Salt Concentration |
The bile salt concentration, in mmol/L, for the indicated medium. The value can be edited to reflect the in vitro assay conditions used to generate the solubility in the given media. |
|
Solubility |
The in vitro solubility, in mg/mL, of the form in the given medium. The value can be edited. |
|
Selected |
A toggle. Controls whether the indicated biorelevant solubility will be included in the calculation of the solubilization ratio. On by default. Note that if the solubility is 0, the value will not be used in the calculation of solubilization ratio, even if this toggle is on. |
Additional Solvents and Solubilizers sub-panel
The Additional Solvents & Solubilizers sub-panel is used to enter information about excipients used to increase solubilization of the compound. This can include solvents, such as ethanol, used to increase solubility in suspension drug formulations, as well as solubilizers, such as cyclodextrin, which form drug-solubilizer complexes with enhanced solubility.
Both solvents and solubilizers have additional settings which must be configured for each formulation in the Formulations panel (See Formulations Panel). The effects of excipients on the compound are input here in the Compounds view, while the parameters describing the incorporation of excipients in the formulation are input in the Formulation panel in the Dosing view.
Compounds view, Solubility panel, Additional Solvents & Solubilizers sub-panel
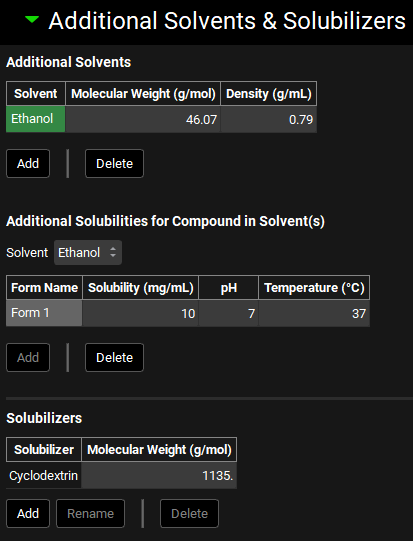
The additional solvents and solubilizers shown in the screenshot above have been entered manually. All tables in this screenshot are empty by default.
|
Input/Option |
Description |
|
Additional Solvents |
Parameters for additional solvents for use with suspension dosage formulations. |
|
Solvent |
The name of the additional solvent. Solvents are added to the table automatically when clicking the Add button. |
|
Molecular Weight |
The molecular weight, in g/mol, of the solvent. The value can be edited. |
|
Density |
The density, in mg/mL, of the solvent. The value can be edited. |
|
Add |
Adds a new solvent to the table. |
|
Delete |
Deletes the selected solvent from the table. Hold [CTRL]-key and click on any cell in a row to highlight a row for deletion. |
|
Additional Solubilities for the Compounds in the Solvent(s) |
Parameters for the solubility of the selected compound in the additional solvent. If there are multiple forms (polymorphs) of the compound, each form will have a line in this table. |
|
Solvent |
A drop-down. Selects the solvent for which information will be entered. This drop-down is automatically populated with the solvents in the Additional Solvents table. |
|
Form Name |
The name of the compound form for which solubility information will be entered. Form Names are added to the table automatically when clicking the Add button and must match those added in the Solubility panel. |
|
Solubility |
The solubility, in mg/mL, of the compound in the additional solvent. The value can be edited. |
|
pH |
The final pH of the solution in which the solubility was measured. The value can be edited. |
|
Temperature |
The temperature, in °C, at which the solubility was measured. The value can be edited. |
|
Solubilizers |
Parameters for solubilizers for use with oral dosage formulations. |
|
Solubilizer |
The name of the solubilizer. Solubilizers are added to the table automatically when clicking the Add button. |
|
Molecular Weight |
The molecular weight of the solubilizer in g/mol. The value can be edited. |
|
Add |
Adds a new solubilizer to the table. |
|
Delete |
Deletes the selected solubilizer from the table. Hold [CTRL]-key and click to highlight a row for deletion. |
|
Rename |
Renames the selected solubilizer. Hold [CTRL]-key and click to highlight a row for renaming. |
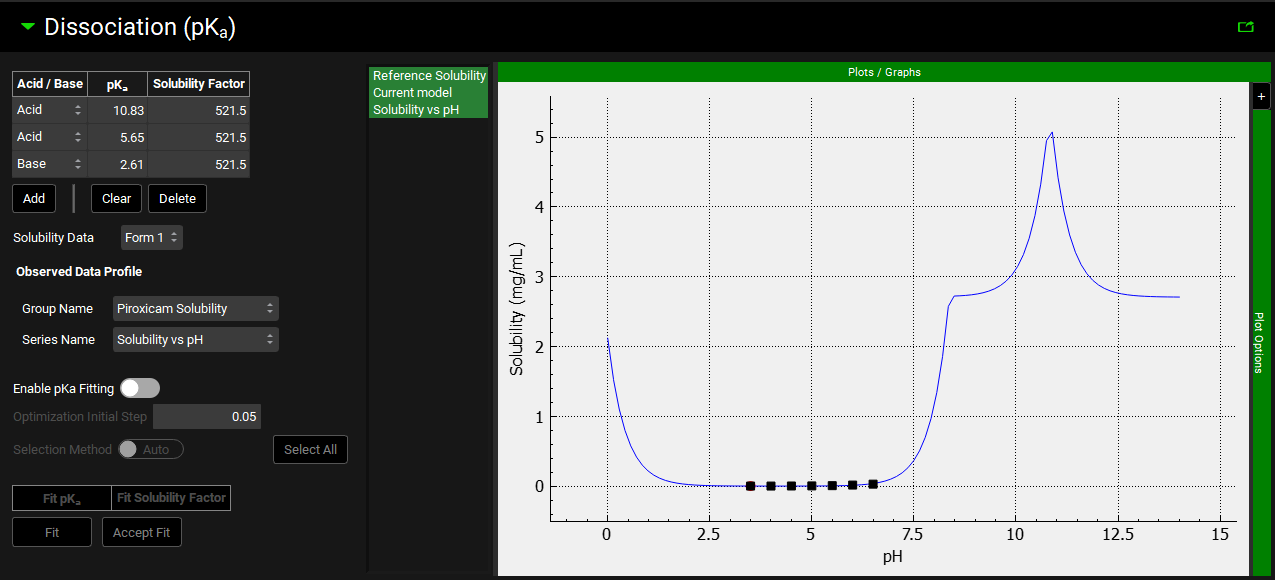
Dissociation (pKa) panel
The Dissociation (pKa) panel is relevant if the compound has one or more titratable groups (Acid, Base, or Mixed).
Compound view, Dissociation (pKa) panel
|
Input/Option |
Description |
|
Acid/Base |
A drop-down. Selects the type of titratable group: Acid, Base, or Mixed. Note that Mixed pKa values are predicted by ADMET Predictor®. Manually added pKa values cannot be set to Mixed. The default value for user-added pKa values is Acid. |
|
pKa |
The corresponding pKa of the titratable group. The default value is 7. |
|
Solubility Factor |
The ratio of the solubility of the ionized state of the compound to the solubility of the un-ionized state for the pKa. The default value is 1. |
|
Solubility Data |
A drop-down. Selects the Form to which the solubility data corresponds (both reference and observed). |
|
Observed Data Profile |
Enables selection of Solubility Data that has been entered in the Observed Data View to be used to fit the pKa values and Solubility Factor for a Compound and Form. The data selected is shown on the graph to the right, with the legend name taken from the Series Name for the data. Note: This selection is not saved. It will need to be reselected when the project is reopened to allow the Current model to be compared to the solubility profile. |
|
Group Name |
A drop-down. Selects the relevant Group Name that contains the observed Solubility data. |
|
Series Name |
A drop-down. Selects the relevant Series Name in the selected Group that contains the observed Solubility data. |
|
Enable pKa Fitting |
A toggle. Turn on to enable the pKa values and Solubility Factors to be fitted to the observed data. |
|
Optimization Initial Step |
The initial step size used for optimization. Set to 0.05 by default. This value can be edited. |
|
Selection Method |
A toggle. Switched to Auto by default meaning the program will determine the pKas and Solubility Factors to optimize. Switching to User enables user selection of the pKas and Solubility Factors to optimize. |
|
Fit pKa toggle |
A toggle for each pKa value in the table – if User is chosen as the Selection Method these will be enabled. Turn on to optimize the particular pKa value displayed as the toggle label. All are turned off by default. |
|
Fit Solubility toggle |
A toggle for each Solubility Factor in the table – if User is chosen as the Selection Method these will be enabled. Turn on to optimize the particular Solubility Factor displayed as the toggle label. All are turned off by default. |
|
Fit |
Click to fit the pKa values and Solubility Factors to the observed solubility data. The alternative Solubility vs pH curve is displayed in green on the plot. The optimized values for the pKas and Solubility Factors are displayed as the toggle label. |
|
Accept Fit |
Click to accept the fitted pKa values and Solubility Factors |
|
Plot |
The plot allows the Solubility vs pH curve to be visualized, together with the reference solubility and any observed solubility data. The fitted solubility profile will also be displayed prior to the fit being accepted. Clicking on the series names on the left of the plot displays only the series in green. To select multiple for display hold [CTRL]-key and click. |
Typical values for the Solubility Factor can range from 10 to over 1,000,000. If you do not know the Solubility Factor for the compound, then you can estimate it from the following equation: 20/intrinsic solubility of the molecule in mg/mL.
The pKa information is used to calculate the following pH-dependent properties:
-
Solubility vs. pH in pH-dependent solubility models and pH-dependent dissolution models.
-
LogD vs. pH in pH-dependent LogD models and pH-dependent absorption models.
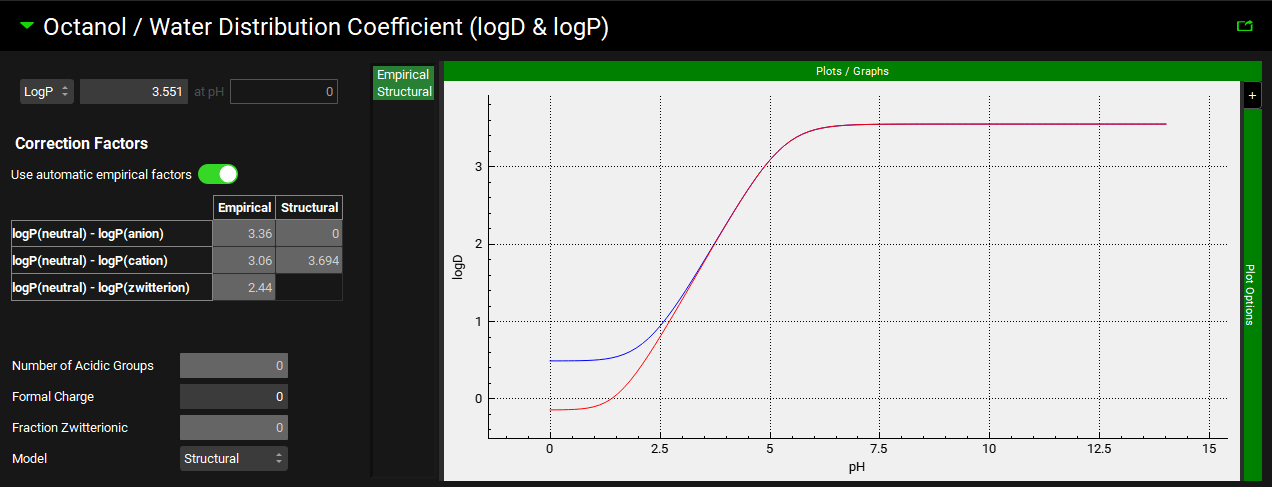
Octanol/Water Distribution Coefficient (logD & logP) panel
The Octanol/Water Distribution Coefficient (logD & logP) panel contains the input for the logP or logD of the compound, as well information regarding the empirical and structural distribution coefficient models. The LogD vs pH profile for both models is also displayed in the plot on the right-hand side. LogD is used in the calculation of the adjusted fraction unbound in plasma (Fup), absorption scaling factors (ASFs) and Kp values, as well as estimating the in vitro fraction unbound in the Metabolism & Transporter module.
Compounds view, Octanol/Water Distribution Coefficient (logD & logP) panel
|
Input/Option |
Description |
|
LogD [ ] at pH [ ] |
|
|
LogP [ ] |
The default value is 1. |
|
Correction factors |
Settings for the correction factors used in interconverting between LogD and LogP based on the prevalence of different charged species of the compound across the pH range. |
|
Use Automatic Empirical Factors |
A toggle. Indicates whether built-in correction factors should be used for the empirical LogD model. Toggled on by default. Toggling this off enables editing of the empirical correction factors in the table below. |
|
Correction Factors Table |
The Correction Factors used for empirical and structural LogD models, for the Anionic, Cationic, and Zwitterionic species. Empirical correction factors can be edited if Use Automatic Empirical Factors is toggled off. Structural correction factors are generated only if the compound is imported through ADMET Predictor® and cannot be edited. |
|
Number of Acidic Groups, Formal Charge, and Fraction Zwitterionic |
Parameters generated by ADMET Predictor® for applying the structural model correction factors. If the compound was not imported through ADMET Predictor®, these will be 0 or -1. These values cannot be edited. |
|
Model |
A drop-down. Selects whether the Structural or Empirical LogD model will be used for this compound. The structural model only applies to compounds imported through ADMET Predictor®. |
|
Plot |
The plot allows the LogD vs pH curve to be visualized and to observe the impact of using the Structural or Empirical LogD model. Clicking on the series names on the left of the plot displays only the series in green. To select multiple for display hold [CTRL]-key and click. |
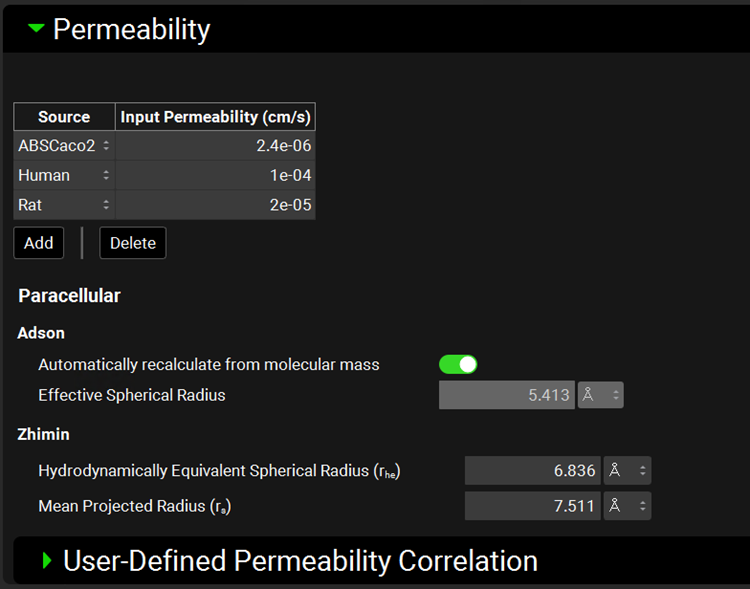
Permeability panel
The permeability panel contains information used to calculate total and paracellular intestinal effective permeability (Peff) for the compound. This panel supports inputs for multiple permeability measurements from different sources, as well as parameters for calculation of paracellular permeability using both the Adson and Zhimin models 2 3 .
Multiple permeability input values are supported in GPX™, for such cases as having experimental values from Caco2 and Rat, and the predicted Human value. The specific input permeability, as well as the paracellular model, that will be used in a given simulation is selected within the Simulations panel (See Simulations View).
Compounds view, Permeability panel
|
Input/Option |
Description |
|
Source |
The source(s) for input permeability values, from in vitro Papp or in vivo Peff experiments, or user-defined permeability correlations (see below). The source also dictates which correlation, if any, will be used to convert to the Peff during simulation. Sources available to select:
|
|
Input Permeability |
The permeability for the selected compound and permeability source. The value can be edited. The units (cm/s, nm/s, µm/s) can be changed in the column header. |
|
Adson |
Parameters for the Adson paracellular model |
|
Automatically recalculate from molecular mass |
A toggle. Turned on by default. Indicates whether the Adson effective spherical radius will be calculated from the molar mass of the compound, as input in the Molecular Properties panel. Turning the toggle off enables the Adson Effective Spherical Radius to be edited (see below). |
|
Effective Spherical Radius |
The molecular radius utilized by the Adson model for paracellular permeability calculations. If “Automatically recalculate from molecular mass” is toggled on, this box displays the calculated value. Toggling “Automatically recalculate from molecular mass” off enables editing of the value and the units (A, nm, µm). |
|
Zhimin |
Parameters for the Zhimin paracellular model |
|
Hydrodynamically Equivalent Spherical Radius and Mean Projected Radius |
The radii utilized by the Zhimin model for paracellular permeability. These parameters are calculated by ADMET Predictor® upon structure import and will be invalid for compounds not imported through ADMET Predictor®. These values can be edited. If the values are zero, the Zhimin model will not be available for use in the Simulations view (see Permeability sub-panel). |
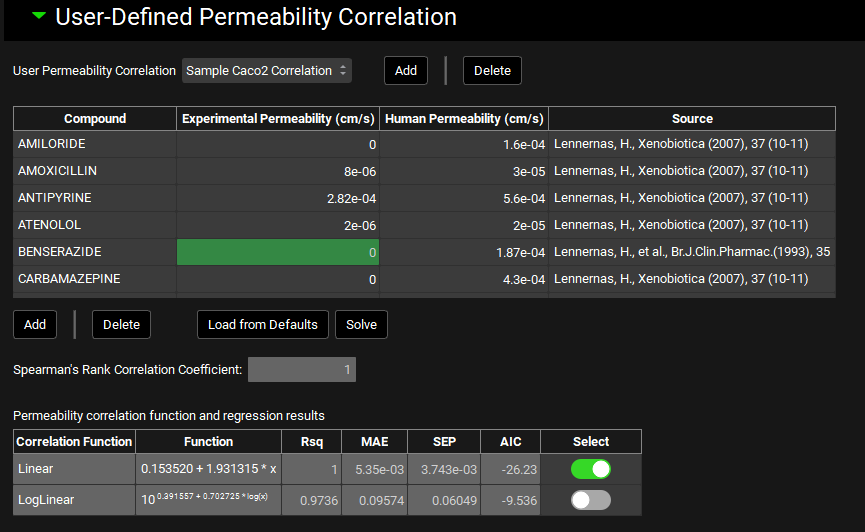
User-Defined Permeability Correlation sub-panel
The user-defined permeability correlations sub-panel can be used to create new correlations to convert in vitro experimental permeability to in vivo human intestinal permeability based on user-supplied data. Correlations created here are then available as a “source” in the Permeability panel.
To establish the correlation between in vitro Papp and human Peff, GPX™ will scale the in vitro Papp values by a factor of 100000 and the human Peff values by 10000, to improve legibility of the correlation equations.
Note that GPX™, compared to the legacy version, uses explicit units for permeability when inputting the correlation data. As such, be mindful of the scale of the values entered.
User-Defined Permeability Correlation sub-panel
|
Input/Option |
Description |
|
User Permeability Correlation |
A drop-down. Selects the current user-defined correlation to view and/or edit. Newly added user-defined correlations appear in this menu after adding. |
|
Compound |
The name of the reference compound for which experimental and human permeability measurements are available. |
|
Experimental Permeability |
The in vitro Papp measurement, which serves as the independent variable in the correlation. Values of 0 will be ignored when solving the correlation. |
|
Human Permeability |
The in vivo human Peff measurement, which serves as the dependent variable in the correlation. Established Peff values for a set of standard reference compounds is provided by default (see ‘Load from Defaults’ below). |
|
Source |
The source of the permeability data. This is provided for the default reference compounds. Users may enter their own references for their data in this column. This field is for record-keeping purposes. |
|
Add/Delete |
Add compounds to, or delete compounds from, the table. |
|
Load from Defaults |
Populates the table with 33 standard reference compounds with established human Peff values. Experimental permeability will be 0 for all of these compounds and must be filled in by the user. |
|
Solve |
Solves the correlation functions using the data in the table. |
|
Spearman’s Rank Correlation Coefficient: |
Statistical parameter indicating the degree of association between the rank orders of Experimental Permeability and Human Permeability; higher positive values (closer to +1) indicate a stronger association between the ranks. This value is calculated upon fitting the correlation and cannot be edited. |
|
Correlation Function |
Indicates the correlation equation type: linear or log-linear. |
|
Function |
Displays the respective equations with fit coefficients. |
|
Rsq, MAE, SEP, AIC |
Statistical parameters indicating the goodness-of-fit of each equation type. |
|
Select |
A toggle which indicates which equation will be used when the correlation is applied. By default, the equation with the lowest AIC will be selected. The selection can be edited. |
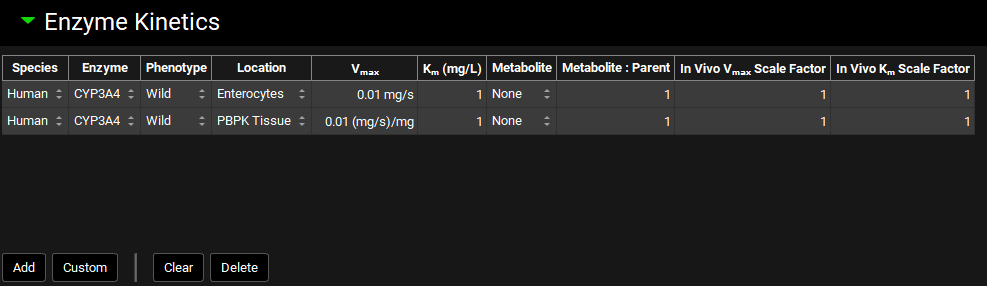
Enzyme Kinetics panel
The Enzyme Kinetics panel is used to enter Michaelis-Menten data for the compound, controlling the kinetics of metabolic clearance in simulations. Each row in the enzyme table represents a unique metabolic pathway and is referred to as a “Metabolism” in GPX™. The information here is also used to calculate metabolite generation if it is enabled. Conversions of in vitro data to in vivo kinetics done using the Metabolism & Transport module (See Metabolism and Transport Module) will automatically appear here when transferred from that module.
Enzyme kinetics can be added for all species and phenotypes under a single compound. The specific metabolisms used in each simulation will be determined when the simulation is run, based on the physiology used in the simulation.
Compounds view, Enzyme Kinetics panel
|
Input/Option |
Description |
|
Species |
The species to which the metabolism kinetics apply. |
|
Enzyme |
The enzyme for the metabolism. Default enzymes will vary based on the species. For adding custom enzymes, see Custom below. |
|
Phenotype |
The phenotype for the enzyme for this metabolism. It is possible to have individual metabolism entries for each phenotype of an enzyme. |
|
Location |
The model-level location for the metabolism (e.g. Enterocytes, Compartmental Liver, PBPK Tissue, etc.). |
|
Vmax |
The Vmax for the metabolism, in mg/s for Enterocytes, Lumen, and Compartmental Liver locations, and mg/s/mg for PBPK Tissue and other locations. the value and the units (mg/s, mg/min, mg/s/mg, mg/min/mg, mg/s/g, mg/min/g) may be edited. |
|
Km |
The Km for the metabolism. Both the value and the units (mg/L, µg/mL, mg/mL) can be edited. |
|
Metabolite |
The metabolite generated by this metabolism, used for metabolite tracking. Set to None by default, which will not track metabolites. Metabolites must first be added as additional compounds, after which they can be selected here. |
|
Metabolite:Parent |
The ratio of metabolite molecules formed for each parent molecule metabolized. The default value is 1. This can be increased for substrates that are cleaved into symmetrical metabolites. |
|
In Vivo Vmax Scale Factor |
A scale factor for Vmax. The Vmax value will be multiplied by the scale factor when the Simulation is run to yield the final value used in the simulation. This is useful for exploring the effect of changing Vmax without having to change the baseline value. The Scale Factor is also the parameter which is permuted by Optimization (see Optimization View). |
|
In Vivo Km Scale Factor |
A scale factor for Km. The Km value will be multiplied by the scale factor when the Simulation is run to yield the final value used in the simulation. This is useful for exploring the effect of changing Km without having to change the baseline value. The Scale Factor is also the parameter which is permuted by Optimization (see Optimization View). |
|
Add |
Add a new row to the enzyme table. After adding the row, the species, enzyme, phenotype, etc. can be selected. Only default enzymes, or previously added custom enzymes, may be selected using this method. |
|
Custom |
Add a custom enzyme for an indicated species. Once the custom enzyme is created, it will be added automatically as a row to the table. It will also be available thereafter in the enzyme drop-down for selection. Expression of custom enzymes must also be added in the Physiologies (gut enzymes) or Pharmacokinetics (PBPK enzymes) views (see sections Physiology sub-panel and Pharmacokinetics View). |
|
Clear |
Clear the entire table. |
|
Delete |
Delete the selected row from the table. Hold [CTRL]-key and click to highlight a row for deletion. |
Only one row can exist for each enzyme-phenotype-location combination for a given species unless the metabolite generated differs. To add multiple rows for the same enzyme with different locations, you will need to update the location to something other than the default, Compartmental Liver, location.
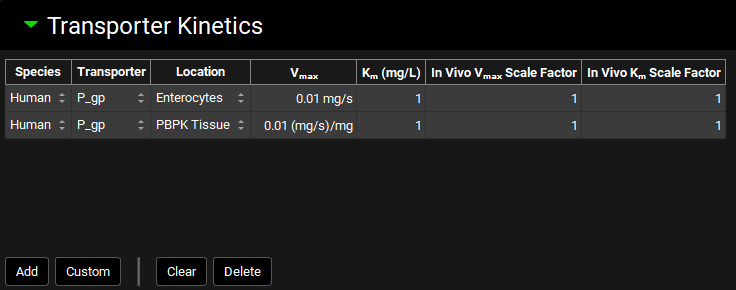
Transporter Kinetics panel
The Transporter Kinetics panel is used to enter Michaelis-Menten data for the compound, controlling the kinetics of active transport in simulations. Each row in the transporter table represents a unique active transport process and is referred to as a “Transport” in GPX™. Conversions of in vitro data to in vivo kinetics done using the Metabolism & Transporter module (See Metabolism and Transport Module) will automatically appear here when transferred from that module.
Transporter location refers to the model in which the transport will be used, such as Enterocytes for the ACAT model, or PBPK Tissue for the systemic PBPK model. The membrane location and flux direction of the transporter are set in the Gastrointestinal and PBPK panels, respectively (See Transporters sub-panel and Transporters sub-panel – Tissues and Blood Compartments).
Compounds view, Transporter Kinetics panel
|
Input/Option |
Description |
|
Species |
The species to which the transporter kinetics apply. |
|
Transporter |
The transporter for the transport. Default transporters will vary based on the species. For adding custom transporters, see Custom below. |
|
Location |
The model-level location for the transport (e.g. Enterocytes, PBPK Tissue) |
|
Vmax |
The Vmax for the transport, in mg/s for Enterocytes and mg/s/mg for PBPK. Both the value and the units (mg/s, mg/min; mg/s/mg, mg/min/mg, mg/s/g, mg/min/g) can be edited. |
|
Km |
The Km for the transport. Both the value and the units (mg/L, µg/mL, mg/mL) can be edited. |
|
In Vivo Vmax Scale Factor |
A scale factor for Vmax. The Vmax value will be multiplied by the scale factor when the Simulation is run to yield the final value used in the simulation. This is useful for exploring the effect of changing Vmax without having to change the baseline value. The Scale Factor is also the parameter which is permuted by Optimization (see Optimization View). |
|
In Vivo Km Scale Factor |
A scale factor for Km. The Km value will be multiplied by the scale factor when the Simulation is run to yield the final value used in the simulation. This is useful for exploring the effect of changing Km without having to change the baseline value. The Scale Factor is also the parameter which is permuted by Optimization (see Optimization View). |
|
Add |
Add a new row to the transporter table. After adding the row, the species, transporter, location, etc. can be selected. Only default transporters, or previously added custom transporters, may be selected using this method. |
|
Custom |
Add a custom transporter for an indicated species. Once the custom transporter is created, it will be added automatically as a row to the table. It will also be available thereafter in the transporter drop-down for selection. Expression of custom transporter must also be added in the Physiologies (gut transporters) or Pharmacokinetics (PBPK transporters) views (see Physiology sub-panel and Pharmacokinetics View). |
|
Clear |
Clear the entire table. |
|
Delete |
Delete the selected row from the table. |
Only one row can exist for each transporter/location pair for a given species. To add multiple rows for the same transporter with different locations, the location must first be updated to something other than the default, Enterocytes, location.
- Carlert, S., Pålsson, A., et al. (2010). “Predicting intestinal precipitation-A case example for a basic BCS class II drug.” Pharm. Res. 27(10): 2119-30.
- Adson, A., Raub, T.J., et al. (1994). “Quantitative approaches to delineate paracellular diffusion in cultured epithelial cell monolayers.” J. Pharm. Sci. 83(11): 1529-1536.
- Zhimin, H. (1995). “Theoretical effects of molecular dimension and configuration on effective diffusion coefficient of macromolecules in microporous membranes.” Transactions Tianjin Univ. 1(1): 42-47.